Mark Azer

Kai Xin Tai

David Lentz
Service level objectives (SLOs) state your team’s goals for maintaining the reliability of your services. Adopting SLOs is an SRE best practice because it can help you ensure that your services perform well and consistently deliver value to users. But to gain the greatest benefit from your SLOs, you need ongoing visibility into how well your services are performing relative to your objectives.
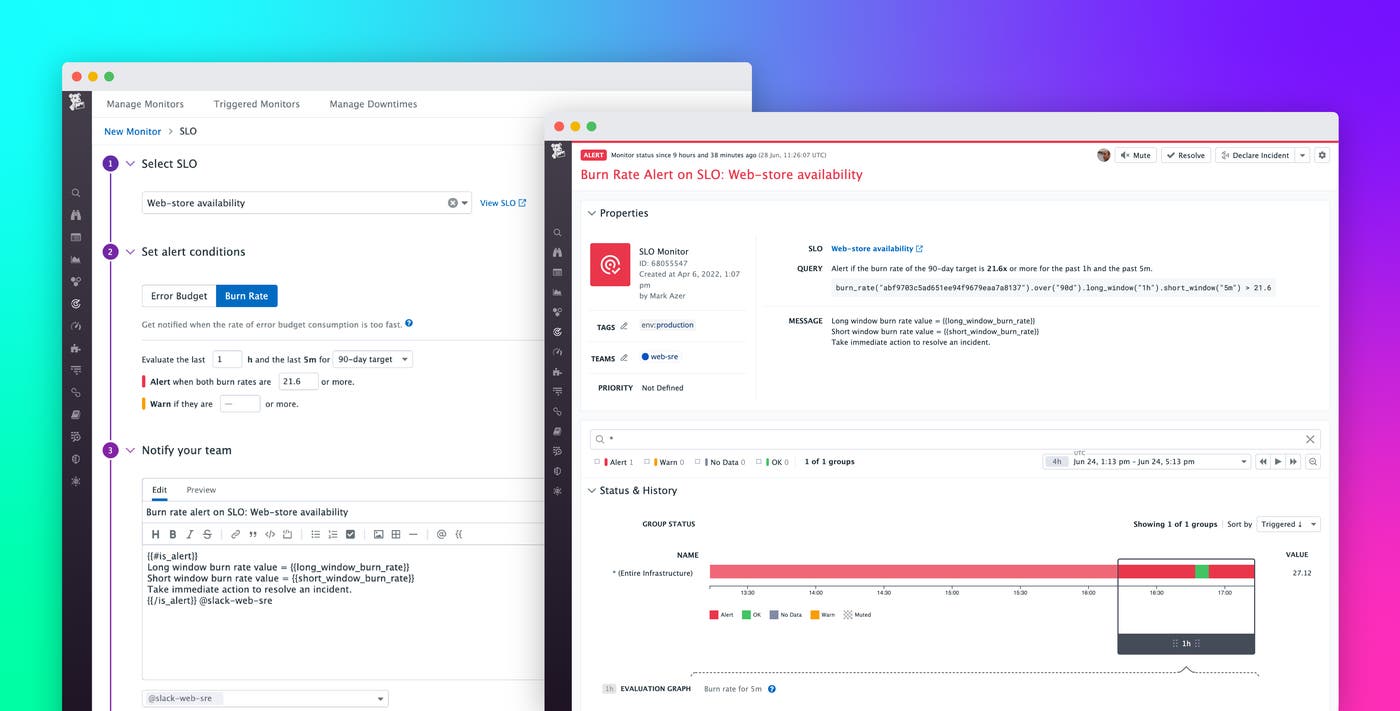
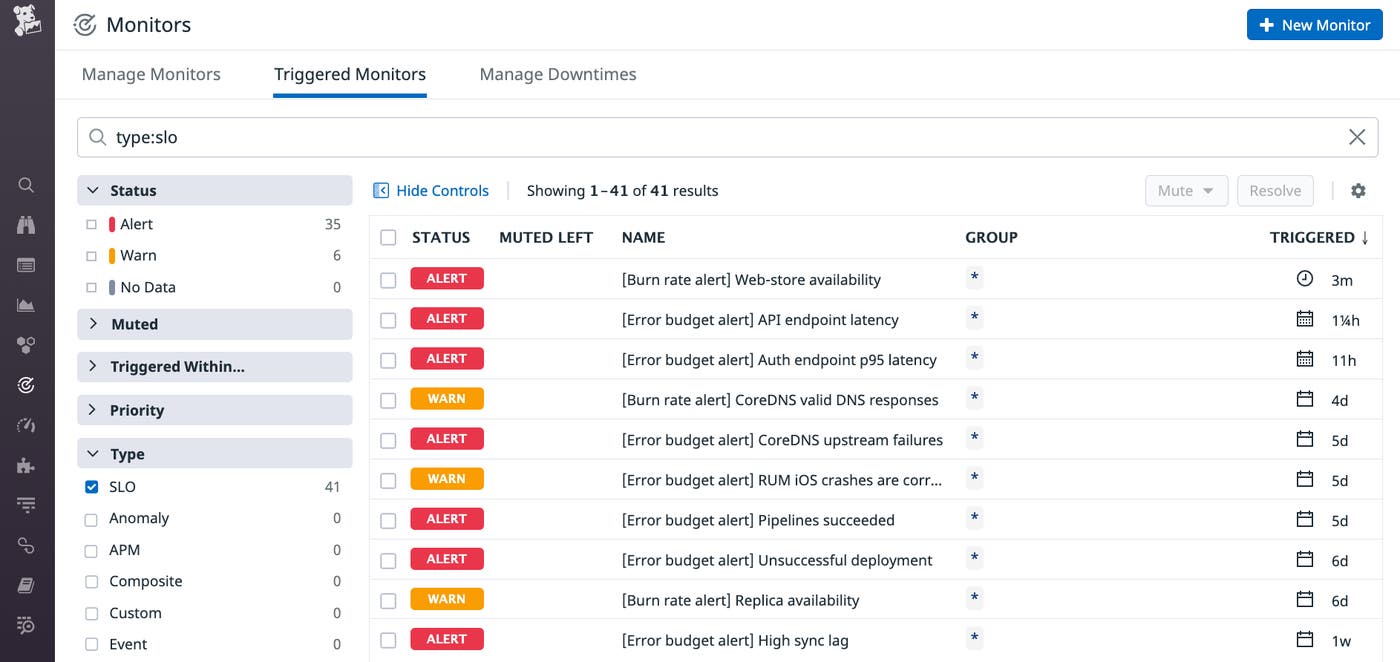
SLO alerts automatically notify your team if a service’s performance might result in an SLO breach. This enables your team to proactively balance priorities by gauging when it makes sense to focus on remediating reliability issues versus developing features. In this post, we’ll walk through two types of SLO alerts—error budget alerts and burn rate alerts—and explain when and how to use each one.
Alert on your error budget consumption
Error budget alerts track how much of your service’s error budget has been consumed and notify your team when consumption passes a threshold. This can help you see how well your service is performing against your SLO. It can also help you make informed, timely decisions about your team’s priorities—for example, indicating when you should reduce your team’s development velocity and focus on reliability work to avoid breaching your SLO. In this section, we’ll show you how error budget alerts work and how to use them. But first, we’ll provide some details about what error budgets tell you about the performance of your service.
What is an error budget?
An error budget states the maximum unreliability the service can have, based on its SLO. It’s calculated by subtracting the SLO’s target percentage—which is your SLO’s goal for desired behavior from your service—from 100 percent. For example, an SLO with a target of 99.99 percent has an error budget of 100% - 99.99%, or 0.01%. This number translates to either a duration or a percentage of requests that exhibit your desired behavior, depending on the type of SLO.
In the case of a monitor-based SLO, the service’s maximum allowed unreliability is the amount of time the SLO’s underlying monitor can be in an alert state before the SLO is breached. For example, a monitor-based SLO with a 30-day time window and a target of 99.99 percent has a limit of 4.32 minutes of alert time before the SLO is breached. This is determined by multiplying the time window (converted to minutes) by the error budget: (30 days * 24 hours * 60 minutes) * (100% - 99.99%) = 4.32 minutes. If this SLO has an error budget alert with a threshold of 50 percent, the alert will fire if the SLO’s underlying monitor has been in an alert state for a total of 2.16 minutes over the last 30 days.
In the case of a metric-based SLO, the service’s maximum allowed unreliability is the percentage of requests that don’t meet the performance requirements specified in the SLO. As an example, consider a metric-based SLO that sets a latency goal of under 200 ms for 99 percent of requests. If you define an error budget alert for this SLO and set the alert threshold to 50 percent, it will fire if less than 50 percent of the requests in the time window achieved acceptable latency.
How to create an error budget alert
As you’re setting up an error budget alert, it is important to consider any standards your organization has around how to use variables in alert messages, which notification integrations to use to send your alert, and which tags to add to provide useful metadata for your alert.
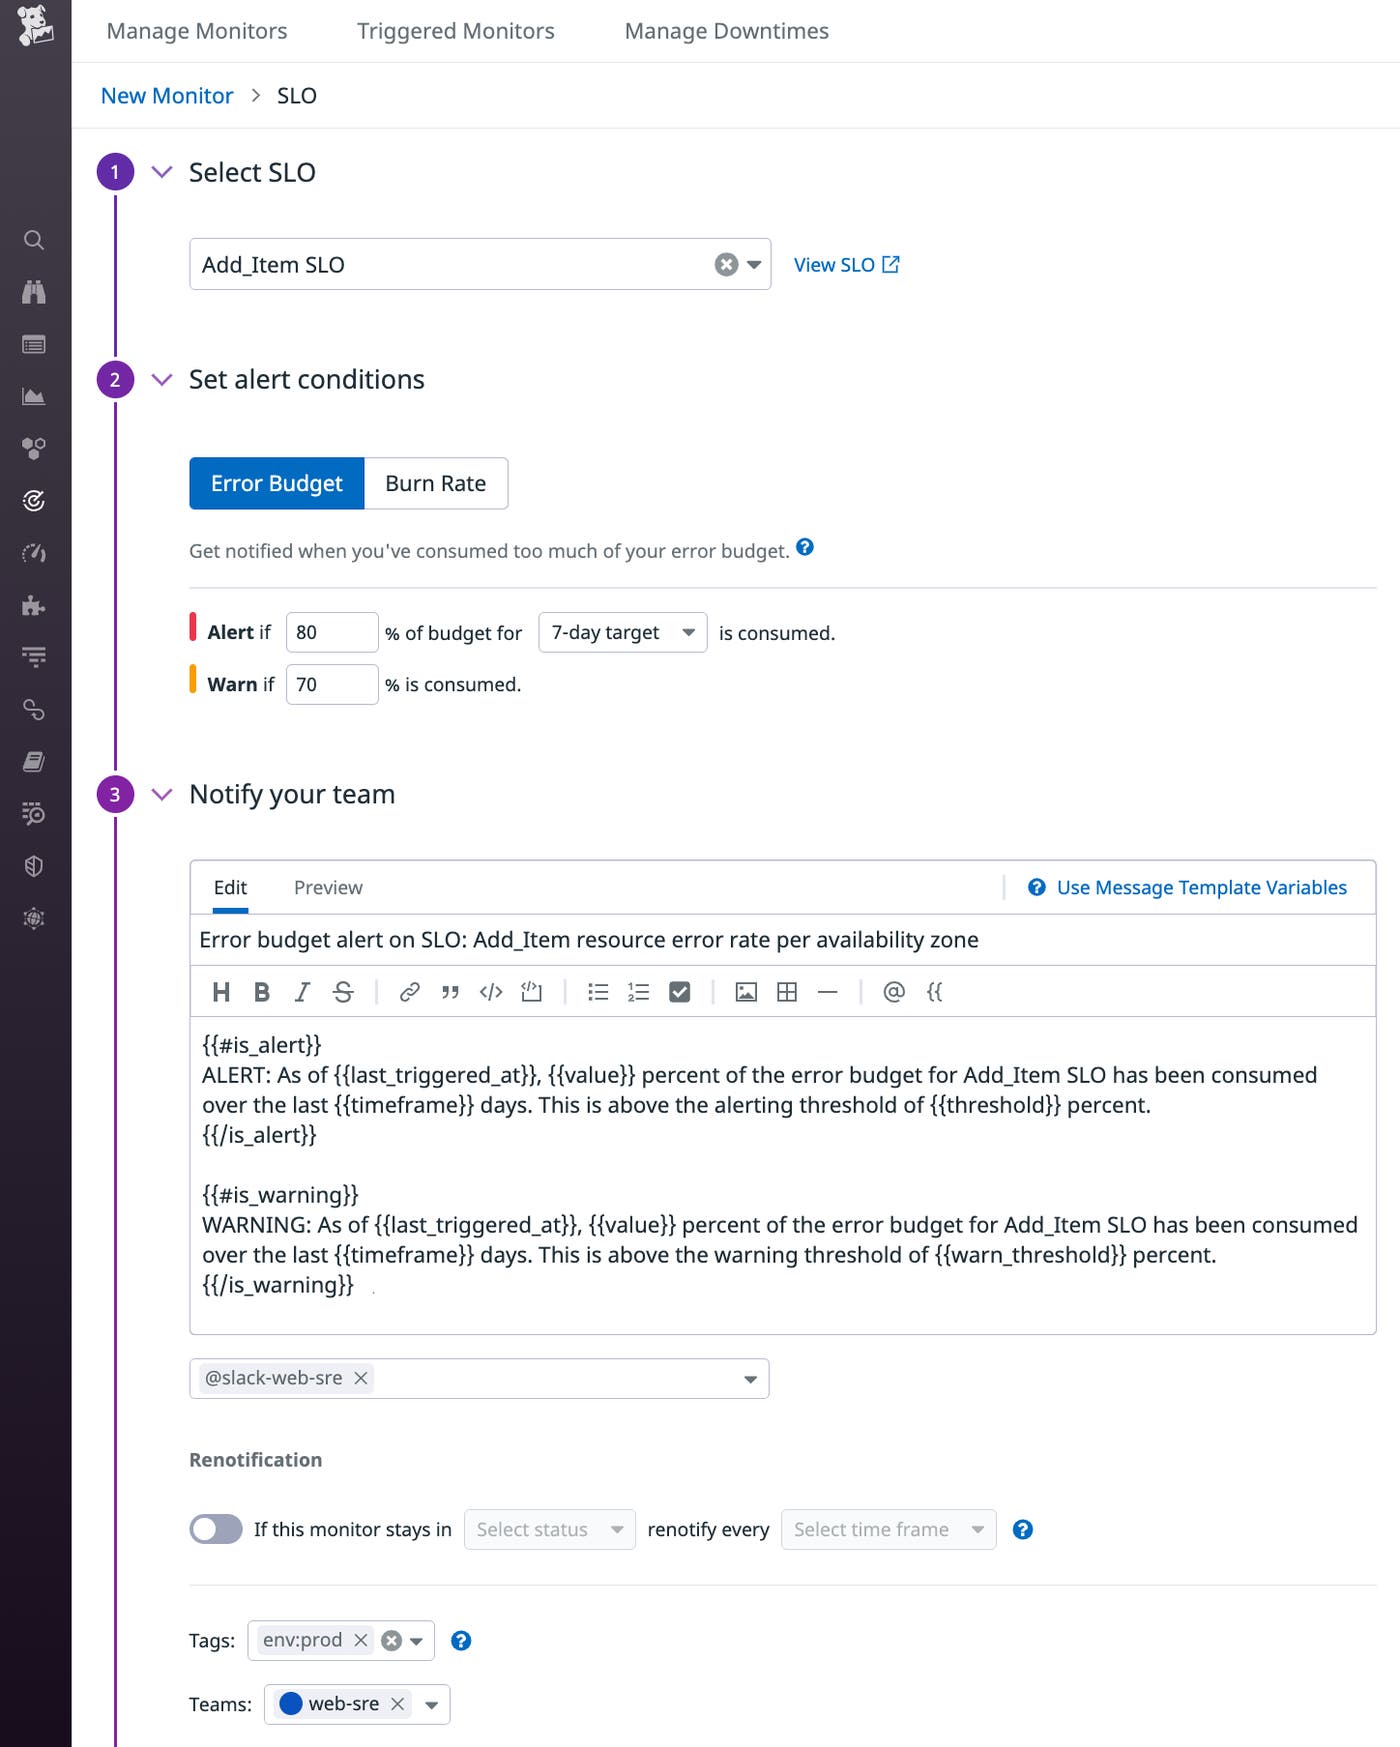
The screenshot below shows an error budget alert with an 80 percent alert threshold and a 70 percent warning threshold. The notification message includes template variables ({{timeframe}} and {{value}}) to dynamically add useful details to the message. The alert will be sent to the web-sre Slack channel, and it’s tagged to show that it belongs to the web-sre team.
See the documentation for more information about creating error budget alerts.
Error budget alerts don’t need to page anyone, since they don’t necessarily correspond to an incident that needs to be immediately investigated. Instead, you can notify team members via email or real-time collaboration tools so they can evaluate and decide how to proceed. For example, it may be normal for you to use more than 50 percent of your error budget by the end of the SLO’s time window, but it may mean different things if it happens after 15 days versus 29 days.
Alert on your burn rate
Error budget alerts can give you time to bring your service’s performance into SLO compliance, but they only notify you after the defined portion of the budget is gone. For an even more proactive approach to SLO monitoring, you can create a burn rate alert to notify you if you’re consuming your error budget more quickly than expected.
A fast-rising burn rate could indicate that your service’s performance has suddenly degraded. You can use burn rate alerts to reduce your mean time to detection (MTTD) and automatically trigger your team’s incident response procedure, giving you a chance to address the issue before it escalates to a high-severity incident. Burn rate alerts can also detect subtle changes that can be hard to notice. Even if they don’t cause a noticeable impact on user experience initially, performance and reliability issues that are left unresolved for hours or days can contribute to an incident that could have been caught sooner rather than later. In this section, we’ll show you how burn rate alerts work and how to create them.
What is a burn rate?
A service’s burn rate is expressed as an integer, and tells you how quickly the service will consume its error budget relative to its SLO’s time window. As an example, consider an SLO that uses a 30-day time window. With a burn rate of 1, the service will take 30 days to deplete the SLO’s error budget. If the burn rate is 3, it will take 10 days to use up the budget, and a burn rate of 0.5 will require 60 days—twice the length of the SLO’s time window.
How burn rate alerts work
Your burn rate fluctuates according to changes in your service’s performance. Datadog automatically calculates your service’s burn rate across a subset of your SLO’s time window, known as an alerting window. A burn rate alert uses a long alerting window (to help prevent flapping and alert fatigue) and a short alerting window (to allow the alert to recover quickly when the burn rate falls back below the threshold). The alert will trigger when the burn rate across both windows is above your alert’s threshold.
A notification from a burn rate alert tells you that at its current level of performance, your service is on track to miss its SLO. The more time that passes before you can bring your burn rate back down, the more likely it is that you’ll breach your SLO, so burn rate alerts give you time to shift priorities to remediate the problem or, if necessary, call an incident.
How to choose a burn rate alert threshold
The maximum possible threshold you can use for your burn rate alert depends on your SLO’s target percentage. Datadog will automatically calculate the maximum possible threshold for your burn rate alert and enforce this maximum to ensure that you enter a valid threshold value. See the documentation for more details about maximum burn rate values.
There are two main approaches you can use to decide on a value for your burn rate alert threshold. One way is to estimate the time required to recover from an issue before it causes you to miss your SLO. Let’s look at an example of an SLO with a seven-day time window. If you expect that it would take two days (or less) to remediate an elevated burn rate, you can set a threshold of 7 / 2, or 3.5. But if you expect that your team can resolve the issue in just half a day—for example, by rolling back a faulty deployment or relying on self-healing mechanisms like auto-scaling and throttling—you can increase your threshold to 7 / 0.5, or 14. See our documentation for more information about this approach.
Another approach to choosing a threshold is to decide the maximum percentage of your error budget that you want to consume across the SLO’s time window. For example, if you want to be alerted when you’re on track to consume 80 percent of your error budget, multiply your SLO time window (in hours) by 0.80, then divide that by the length of your long alerting window. The following equation illustrates how you would calculate this for an SLO with a time window of seven days and a long window of four hours: ((7 * 24) * 0.80) / 4 = 33.6.
See our documentation for more information about this approach and for recommended values that you can use for your burn rate alert thresholds.
How to create your burn rate alert
When you create your burn rate alert, you need to specify the length of your long alerting window. To decide on a duration for the long window, consider the behavior and request patterns of your service. For example, if the health checks or readiness checks of your VMs or pods cause a delay in scaling out, you should factor that time in as you decide on the length of your long alerting window.
Enter a long window size between one and 48 hours, and Datadog will automatically create a short window that is 1/12 the length of your long window. If you’re using Terraform or the Datadog API to create your alert, you have the option to choose the size of the short window yourself.
Next, specify your threshold value, optional warning value, notification message, and tags. Be sure to take into account any standards your organization follows, such as using variables, notification integrations, and tags to make your alerts easier to manage.
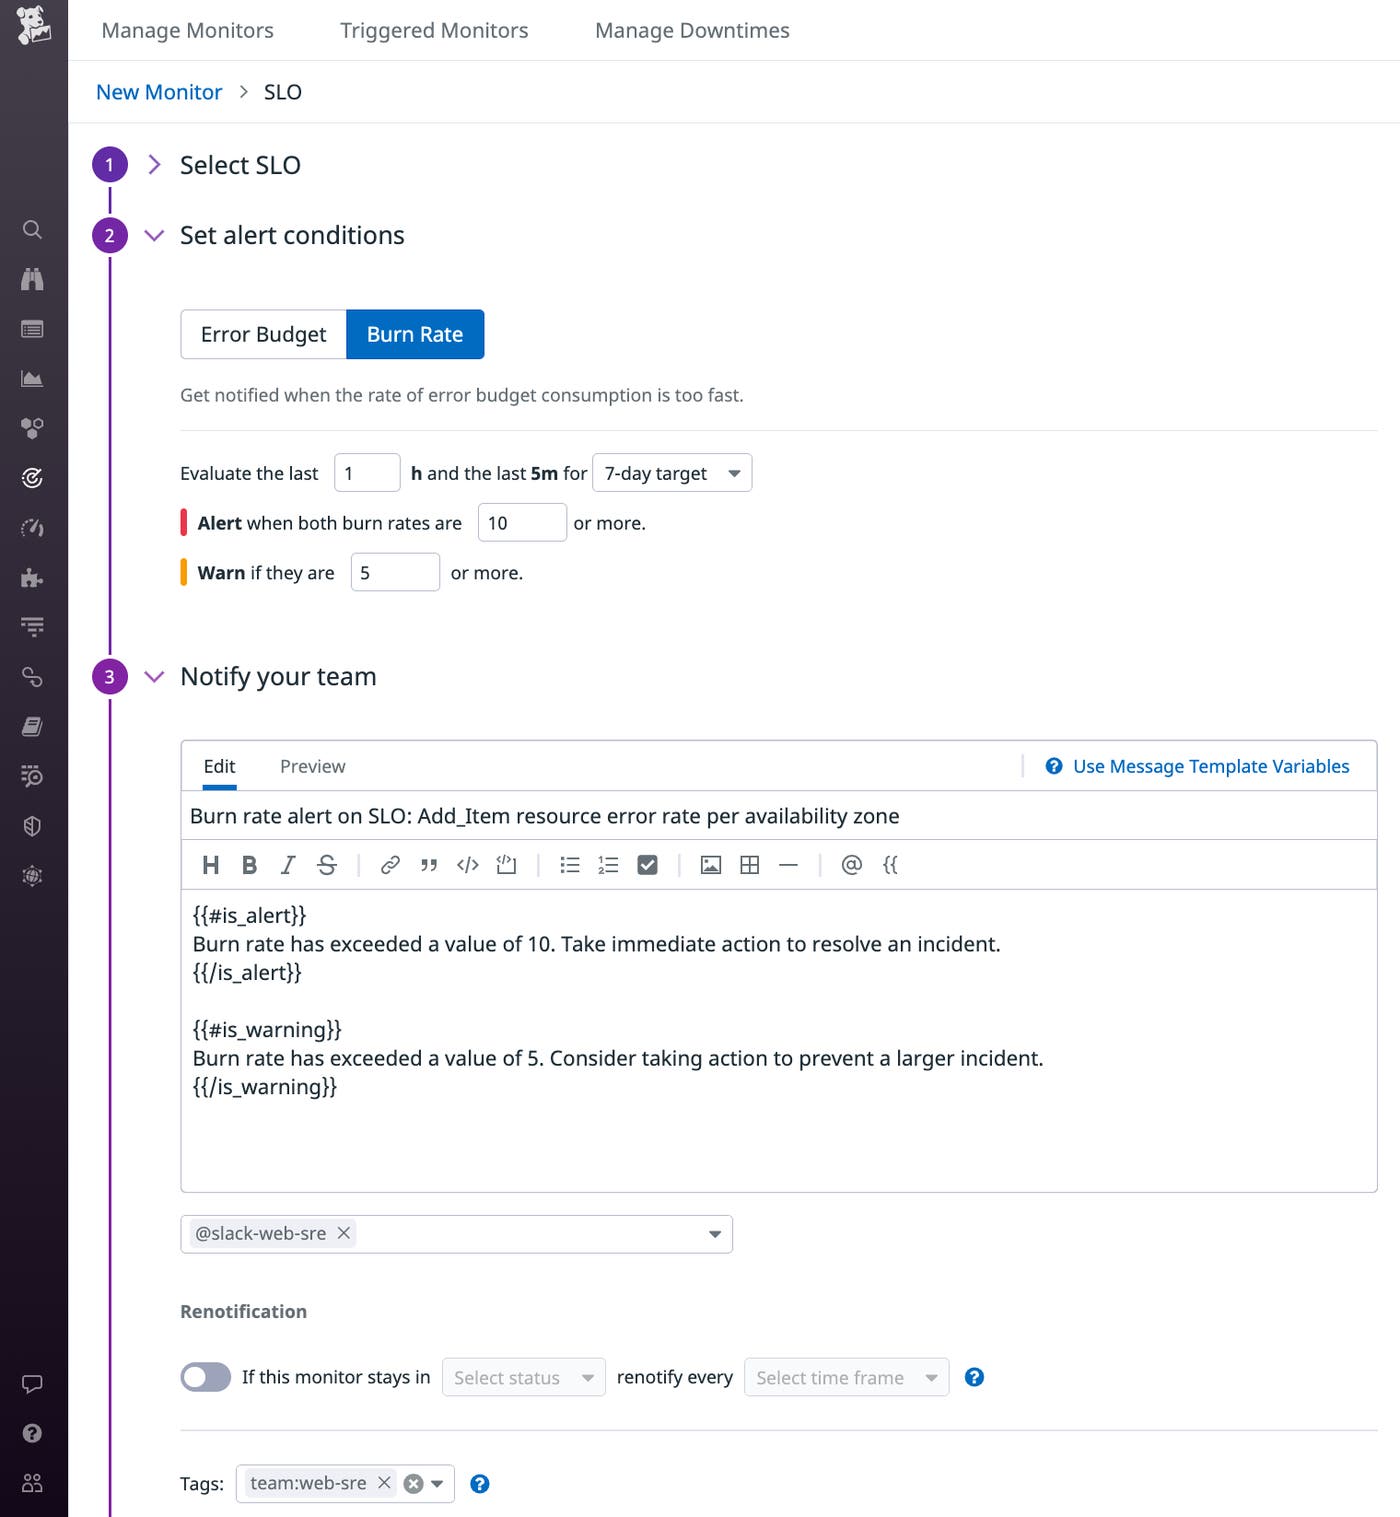
The screenshot below shows a burn rate alert that uses a long window of one hour and a short window that’s set automatically by Datadog. The alert is tagged to show that it belongs to the web-sre team. The notification includes template variables and conditionals in the message, which will be sent to the web-sre Slack channel.
Because an increase in your burn rate could mean either an active incident or a longer-term opportunity for improvement, you can create multiple burn rate alerts for an SLO to reflect these different priorities and respond accordingly. As an example, consider an SLO with a 7-day time window, a target of 99.9 percent, and two burn rate alerts. To notify your team of a fast-burning error budget, you can set an alert with a high threshold, using our recommended value of 16.8—which corresponds to a theoretical error budget consumption of 10 percent—with a long window of one hour and a short window of five minutes. To detect a slow-burning error budget, you can set another alert with a lower threshold of 2.8—which corresponds to a theoretical budget consumption of 40 percent—with a long window of 24 hours and a short window of 120 minutes. If that alert triggers, you can create a ticket to indicate a low-priority issue to be investigated.
Get started with SLO alerts
Creating and managing SLOs in Datadog can help you ensure that your services are reliable. Now you can also alert on your SLOs to stay informed about issues that could deplete your error budget—even before they progress to a point that puts your application’s reliability and end-user experience at risk. See our documentation to learn more about getting started using SLOs, creating error budget alerts and burn rate alerts, and leveraging collaboration tools like Slack and PagerDuty to deliver SLO status data to your team.
You can also learn how to create alerts in Datadog using Terraform or the Datadog API. If you’re not yet using Datadog, you can start today with a free 14-day trial.
