Kai Xin Tai
Scylla is an open source database alternative to Apache Cassandra, built to deliver significantly higher throughput, single-digit millisecond latency, and always-on availability for real-time applications. Unlike Cassandra which is written in Java, Scylla is implemented in C++ to provide greater control over low-level operations and eliminate latency issues related to garbage collection. With its [shared-nothing architecture][scylla-architecture], Scylla runs a single thread per core—instead of relying on shared memory—to avoid expensive locking and allow performance to scale linearly with the number of cores. You can run Scylla on a variety of platforms, including Red Hat, CentOS, Debian, Docker, and Ubuntu.
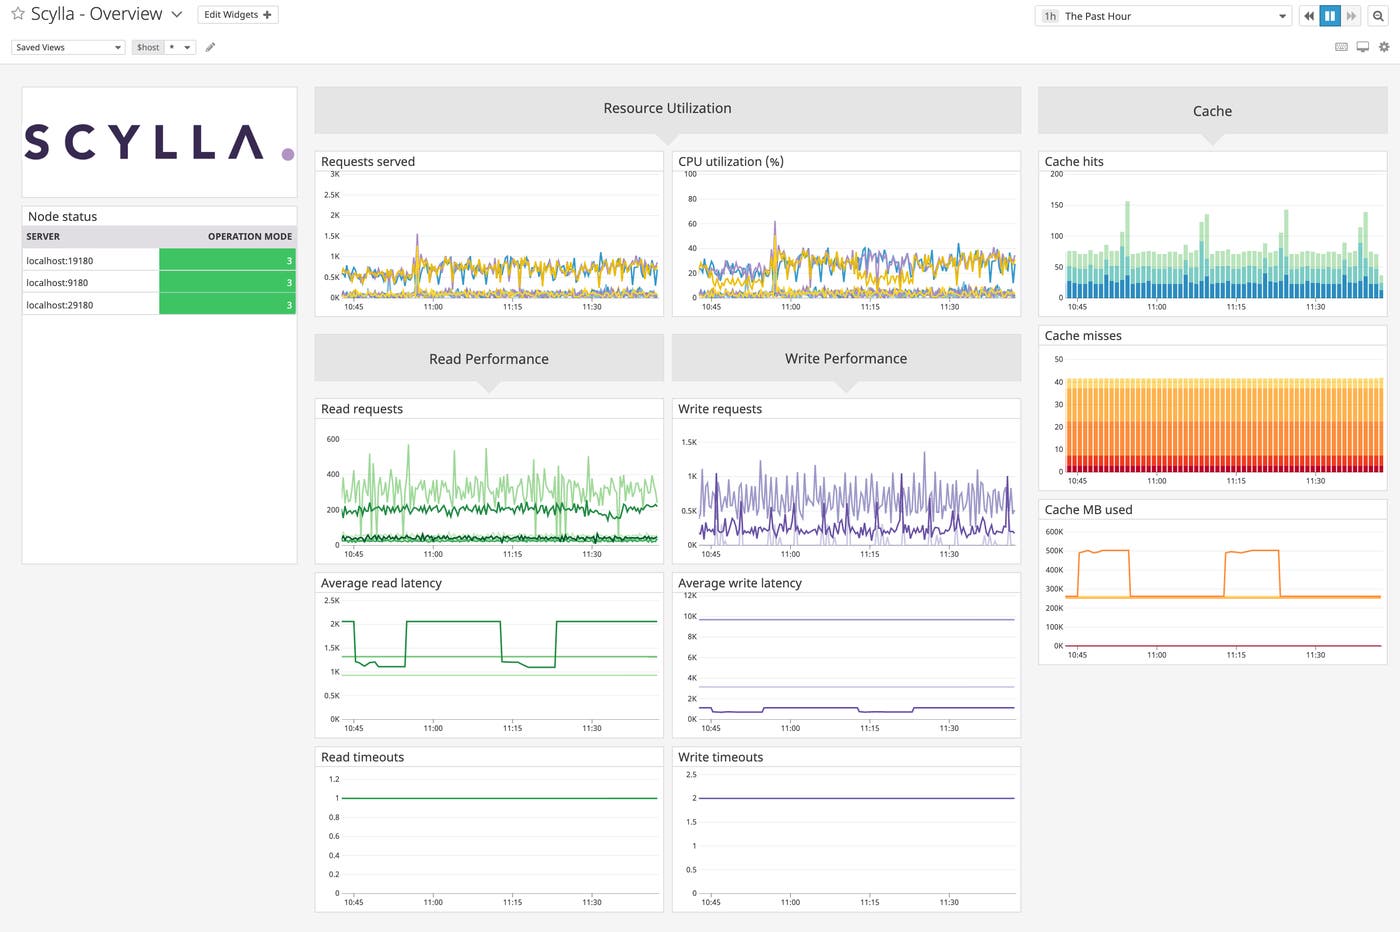
We are excited to announce that with our latest integration, you can now monitor the health of your Scylla clusters—and ensure that they have sufficient resources to maintain high levels of performance. Once you’ve enabled our integration, you can immediately start visualizing key Scylla metrics—including node status, resource usage, and query latency—in an out-of-the-box dashboard. You can clone and customize this dashboard to display metrics from the rest of your infrastructure—and create alerts to notify your team of any performance or capacity issues.

Ensure high cluster availability
Scylla uses two parameters to maintain fault tolerance:
- Replication factor: the number of replicas across the cluster
- Consistency level: the number of replica nodes that must respond to a read or write request before Scylla sends the client a success response
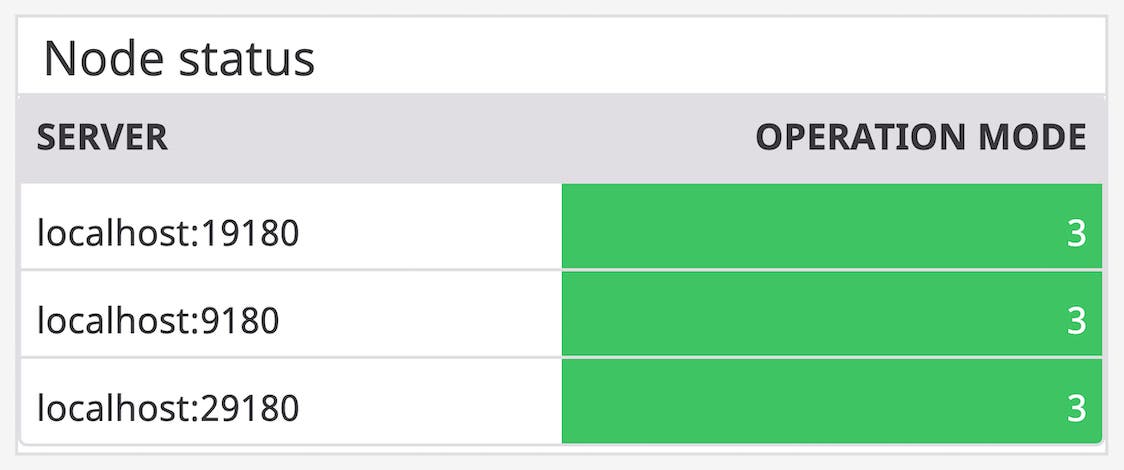
If the number of available nodes in your cluster falls below either of these configured values, read and write requests to your database may fail. Our integration with Scylla provides high-level information on the health of your nodes to help you ensure that your cluster is always able to serve requests. As shown in the screenshot below, our dashboard displays a list of nodes, along with their operation mode. You can then easily set up an alert to notify your team when a node is not in the STARTING (1), JOINING (2), or NORMAL (3) state—which indicates that its status is either unknown or down—so you can begin troubleshooting right away.

Prevent query timeouts
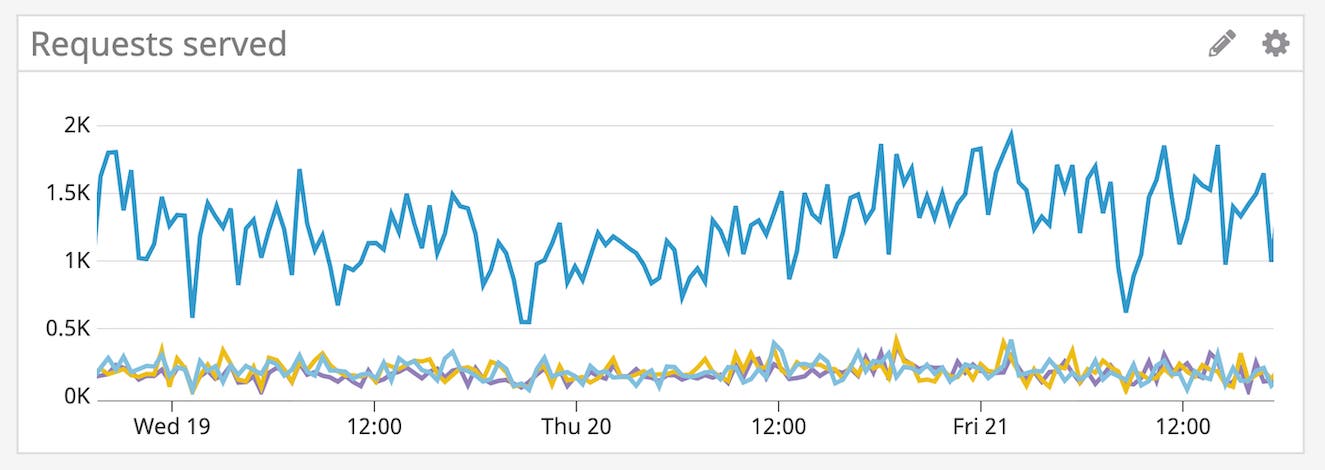
Excessive connections can overload database servers and cause queries to time out. Therefore, you will want to monitor the volume of requests—both read and write—that Scylla is receiving over time and correlate it with the number of request timeouts to determine if your database is able to keep up with its workload. When a server is overloaded, requests take longer to handle—and clients may begin aggressively retrying, which leads to even more overload. If you see a correlated spike in read requests (scylla.storage.proxy.coordinator_reads_local_node) and timeouts (scylla.storage.proxy.coordinator_read_timeouts), you should ensure that the client timeout value is equal or higher than the server timeout value to allow the server to respond to requests before they expire, as detailed in the documentation.

Catch unexpected changes in resource utilization
Each time Scylla writes to the disk, it creates an immutable file, known as an SSTable. To handle updates, Scylla writes a timestamped version of the inserted data into a new SSTable, and marks deleted data as a tombstone. This means that over time, different columns for a single row can exist across multiple SSTables, so queries may need to access a number of SSTables to retrieve the desired data. In order to make querying more efficient, Scylla performs a background operation known as compaction to consolidate SSTables and evict any tombstones.
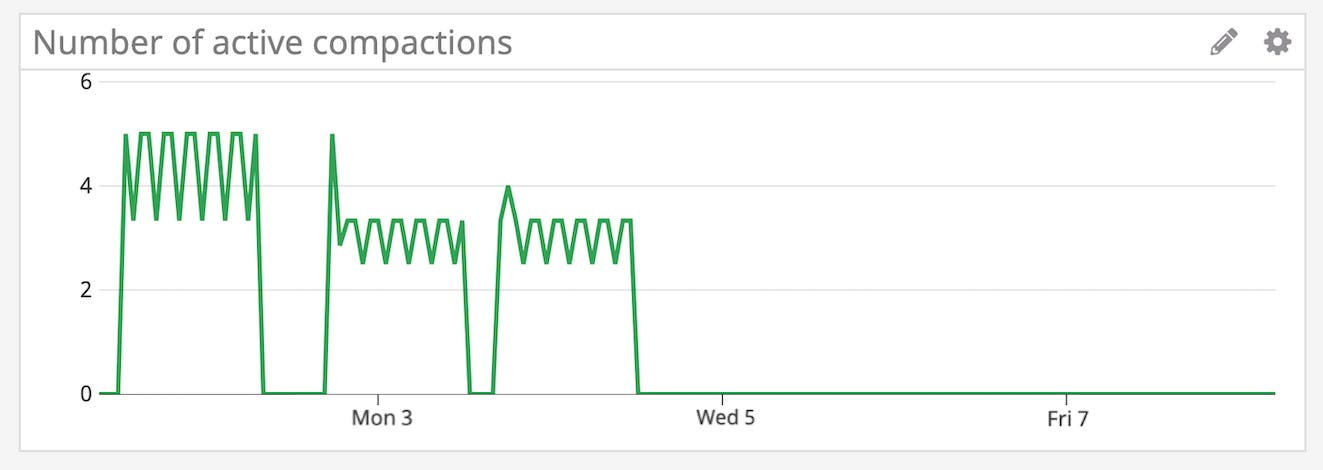
While disk space and CPU utilization is expected to increase during compaction, it should drop back down to normal levels after the process is completed. Therefore, you’ll want to keep an eye on the number of active compactions (scylla.compaction_manager.compactions), along with any sustained spikes in resource usage, which could indicate an issue with the process.

By configuring the Agent to collect data from the /var/lib/scylla directory, you can begin tracking the volume of data written to disk. If you notice that disk usage continues to increase after compaction, use the lsof utility in Linux to check if the files deleted by Scylla are, in fact, reflected in the filesystem. It is possible that references to old files are kept when repairs or large reads are running, in which case you can restart the Scylla node to delete the references and free up resources.

Or, if you see an increase in CPU utilization (scylla.reactor.utilization) on our out-of-the-box dashboard, it could be due to Scylla forcing a compaction to happen in a table which does not have any expired tombstones to drop. To troubleshoot, you can increase the interval between compactions by adjusting your tombstone_compaction_interval configuration. Our integration also includes a built-in log processing pipeline that automatically parses and enriches your database logs with metadata, so you can easily pivot between metrics and logs to get deeper context around a performance issue—and identify specific areas for investigation.
Optimize the size of your partitions

Tracking the distribution of requests across nodes can shed light on whether certain nodes are handling a disproportionate share of traffic. By correlating this distribution with cache performance and query latency, you can determine whether you might need to fine-tune the design of your table partition key or increase the size of your cache. For instance, if you observe a spike in cache misses and read latency on a node that is receiving a large amount of traffic, it could mean that your queries are reading from large partitions.

Read queries will need to access the whole partition if the data is not available in the cache. And as the partition size grows, these queries start consuming larger portions of memory, which in turn increases latency and can cause servers to crash when the node runs out of memory. You can query Scylla’s built-in system.large_partitions table to find large partitions across SSTables in a node—and remodel your data with more granular partition keys to distribute data more evenly across your cluster.
Scylla(brate) with Datadog
With Datadog, you can get comprehensive visibility into the health and performance of your Scylla database, alongside more than 1,000 other technologies that you might also be running. If you’re already using Datadog, check out our documentation to learn how to start monitoring Scylla right away. Otherwise, you can sign up for a 14-day free trial.


