Thomas Sobolik
Red Hat Gluster Storage is a distributed file system, built on GlusterFS and operated by Red Hat for Linux environments. With its focus on scalability, low cost, and deployment flexibility across physical, virtual, and cloud-based environments, organizations use Gluster Storage in a variety of high-scale, unstructured data storage applications.
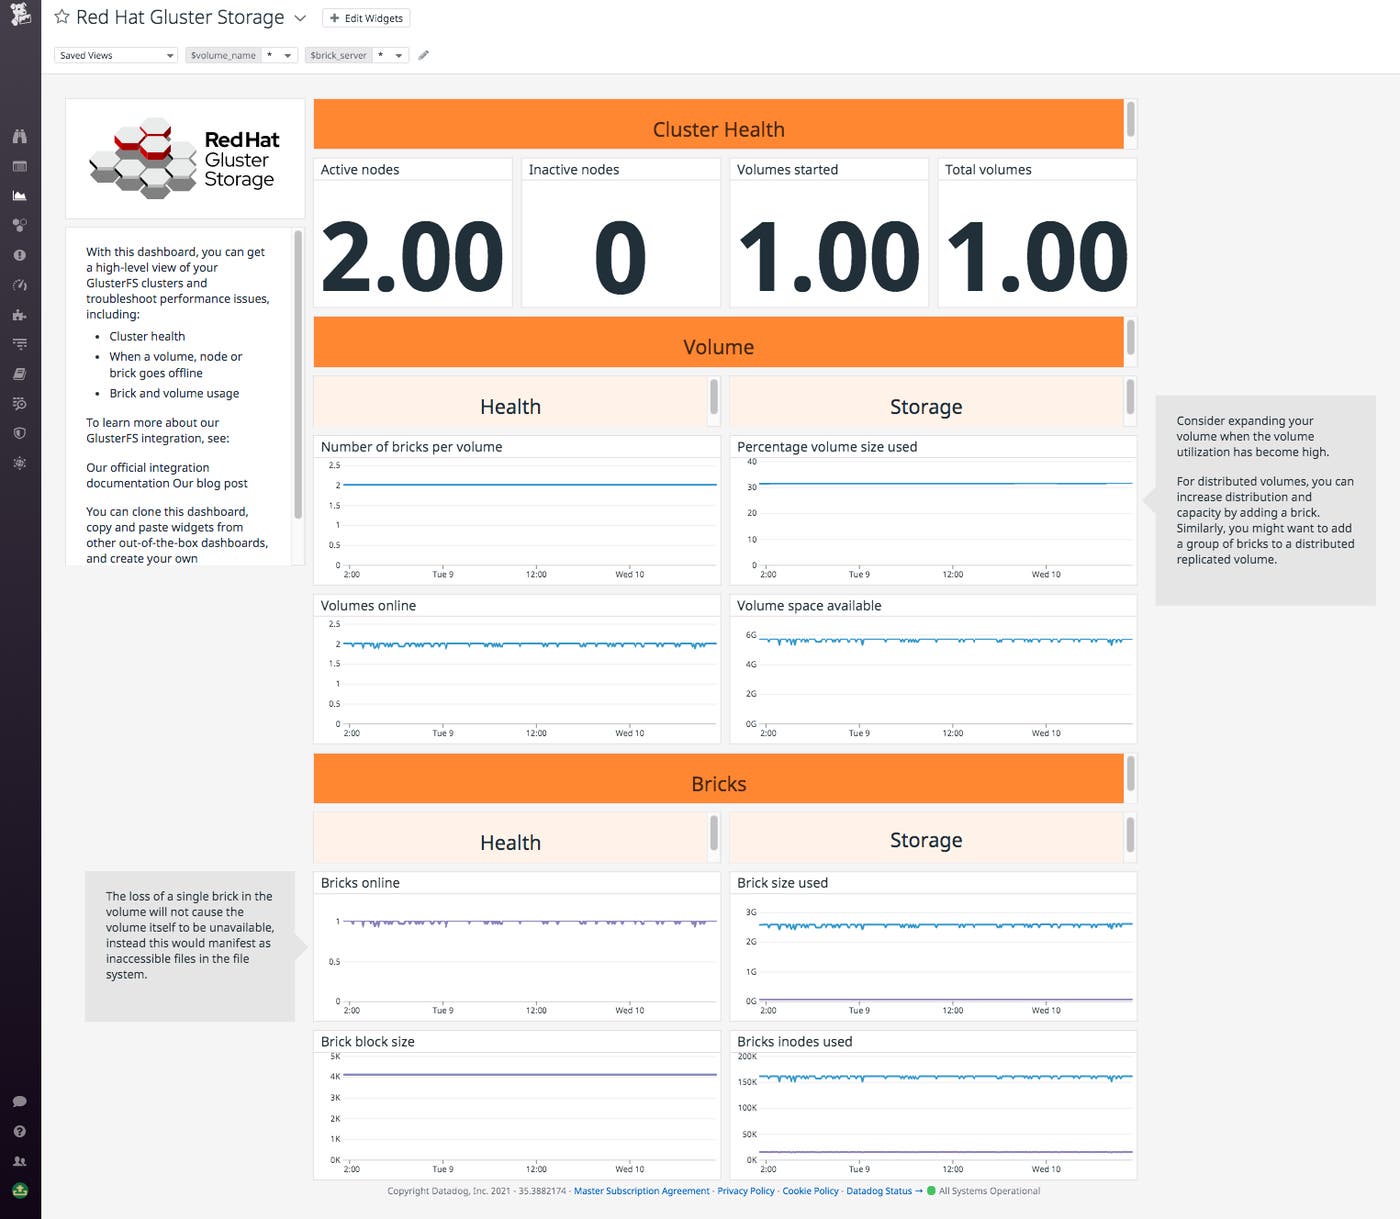
Datadog now integrates with Red Hat Gluster Storage, so you can get comprehensive visibility into the health of your clusters and their constituent nodes, volumes, and bricks. The integration ingests key metrics from Red Hat Gluster Storage’s gstatus command line tool, as well as cluster logs, allowing you to monitor, alert on, and correlate data for your Gluster file system alongside telemetry from the rest of your stack. Once you’ve enabled the integration, our out-of-the-box dashboard visualizes health and disk usage metrics for the objects in your cluster, providing a high-level overview of your deployment’s health.
Scale out smartly
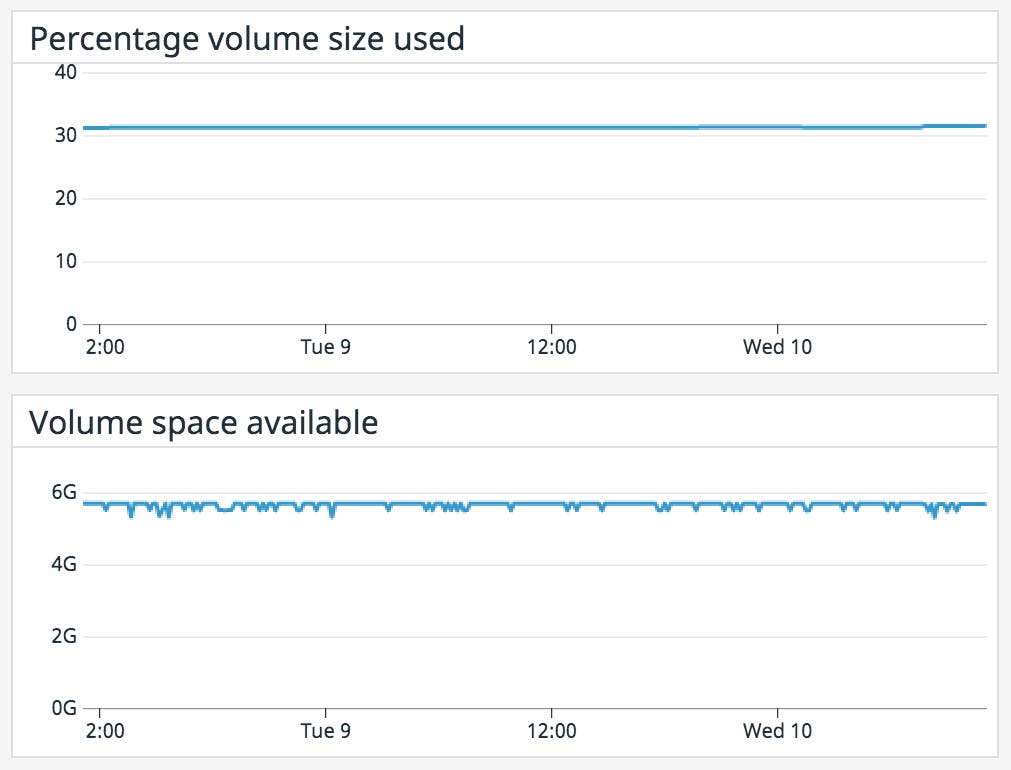
A primary feature of Red Hat Gluster Storage is its ability to scale linearly without loss of performance. It uses an elastic hashing algorithm to locate files instead of a traditional metadata server, which often becomes a performance bottleneck and a central point of failure as systems scale out. Red Hat Gluster Storage clusters are comprised of volumes that are abstracted across nodes and form what’s called the shared storage pool. As your volumes fill up, you’ll need to consider expanding the shared storage pool by adding more more nodes to your cluster (and potentially more volumes, as your nodes-per-volume grows). With Datadog, you can monitor the available disk space and the percentage of space used across your volumes to determine if you need to scale out your file system.
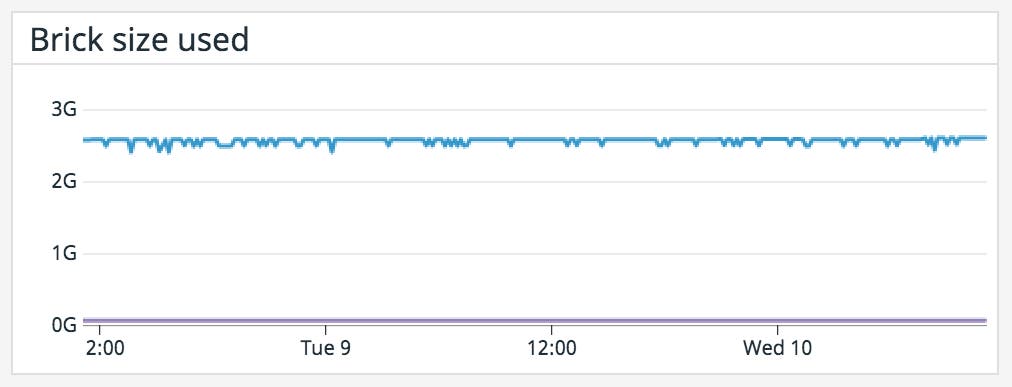
Volumes in the cluster’s shared storage pool are made up of bricks distributed across the nodes. Each brick is represented as an export directory in that node’s file system. In most configurations, Red Hat Gluster Storage automatically sets the brick size according to the capacity of your cluster nodes. Depending on the complexity of your data (i.e., the range in size between different data elements), you may need to adjust the brick size to ensure availability and performance.
Monitoring metrics such as how much space is in use (brick.size.used) and how much space is available (brick.size.free) across your bricks helps you track when an adjustment is necessary. Correlate these metrics with error logs from your nodes to determine if clients are trying to write items that exceed the brick size.
In order to stay ahead of possible space issues, you can set forecast alerts to warn you in advance when your bricks and volumes are about to fill up, so your team can step in early.
Track your cluster’s health
Red Hat Gluster Storage supports distributed replicated volumes, meaning that it copies bricks across multiple nodes in order to guarantee high availability and failsafe data. Of course, you’ll still want to monitor the health of your bricks in order to maintain optimal availability. Datadog lets you track the health and status of your bricks to keep you abreast of outages. You can view the total number of online bricks, or view a breakdown of active bricks by volume to locate any volumes that are experiencing problems that might lead to downtime.
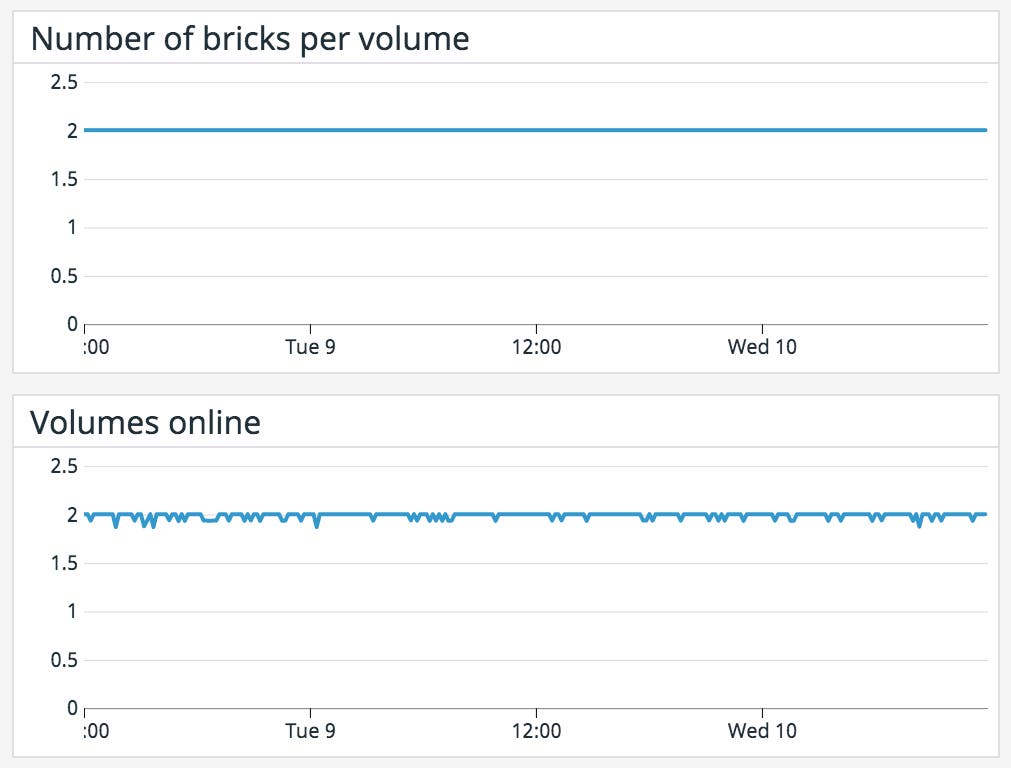
You can also use Datadog to set alerts that proactively notify you when a brick goes down, or when there are unusual spikes or drops in available disk space on your volumes. You can customize your alert with tags—for example, using the vol_name tag lets you quickly identify which volume(s) are affected. This enables you to focus your troubleshooting when a brick goes offline. You can pivot to the Logs Explorer to view Red Hat Gluster Storage logs tagged with the volume associated with the alert. Logs provide greater context around issues and help you identify and diagnose any errors which may have led to your brick’s demise, such as “peer rejected” errors caused by discrepancies in the op-version of your nodes.
Start monitoring Red Hat Gluster Storage with Datadog
With Datadog’s integration for Red Hat Gluster Storage, you can get full visibility into your distributed file system. And, alongside our integrations for more than 1,000 technologies, including Red Hat OpenShift, you can easily monitor the health and performance of your entire stack in one place. The Red Hat Gluster Storage integration is now available in Agent 7.26. For help setting it up, refer to our documentation. Or if you’re brand new to Datadog, you sign up for a 14-day free trial to get started.


