Khang Truong

Simone Tafaro
As organizations scale their infrastructure, monitoring systems can become a source of noise rather than insight. A clean, straightforward set of alerts for a handful of services can quickly spiral into a mess of overlapping thresholds, redundant triggers, and inconsequential notifications across hundreds (or thousands) of components. This flood of notifications can slow response times, overwhelm engineers, and increase the chance of overlooking critical problems. Efficiently managing monitor notifications at scale is crucial for maintaining operational excellence, safeguarding customer experience, and minimizing costs associated with downtime.
Datadog’s monitor notification rules, which are generally available, address this challenge by helping you manage alert delivery to prevent critical issues from slipping through the cracks. Monitor notification rules replace manual configuration with dynamic, tag-driven logic to help you build a notification system that’s reliable, actionable, and aligned with your business priorities.
In this blog post, we’ll explore the challenges of large-scale alerting and explain how monitor notification rules can help you overcome these obstacles. We’ll also provide some best practices to assist you in optimizing your monitor notification rules.
Challenges of large-scale alerting
At scale, the major challenge of monitoring isn’t generating alerts. It’s making sure that the alerts are meaningful, actionable, and routed to the right people at the right time. Without an alert routing strategy, teams can drown in a sea of notifications: some critical, some informational, many duplicated. The negative impacts can include alert fatigue, delayed response times, and missed incidents altogether.
The existing @notification system was originally built for a scenario in which a single team owns and manages all monitors. In this situation, alerts naturally flow to one destination with no complex routing required. When you craft a monitor message, you can tag anyone or anything you need: individual engineers, Slack or Microsoft Teams channels, or automated workflows. This system gives monitor authors full control over who gets paged for each monitor that they build.
However, this same flexibility leads to the following challenges as your infrastructure outgrows a one-team model:
- Manual upkeep at scale: Teams must edit every monitor by hand to set—or later change—its recipients. Adjusting a dozen monitors might be quick, but adjusting hundreds of monitors becomes a slog.
- Complex conditional logic: When one monitor covers services that are owned by several teams, authors often resort to nested template variables or if-else blocks to route alerts correctly. The more conditions that you add, the higher the risk of misconfiguration.
- Centralized triage bottlenecks: To avoid the complexity of conditional logic, some organizations send every alert to a single catch-all team that then forwards incidents to the real owners. This manual hop slows responses and increases mean time to resolution (MTTR).
What are monitor notification rules?
To bridge the gap between static @notifications and the dynamic, policy-driven routing that modern teams need, monitor notification rules power alert delivery from a centrally managed rule engine. These notification rules are predefined sets of conditions that automate the alerting process. Instead of burying complex logic in every monitor, you define policies scoped by any tag that fits your monitoring strategy: team, service, env, priority, and more.
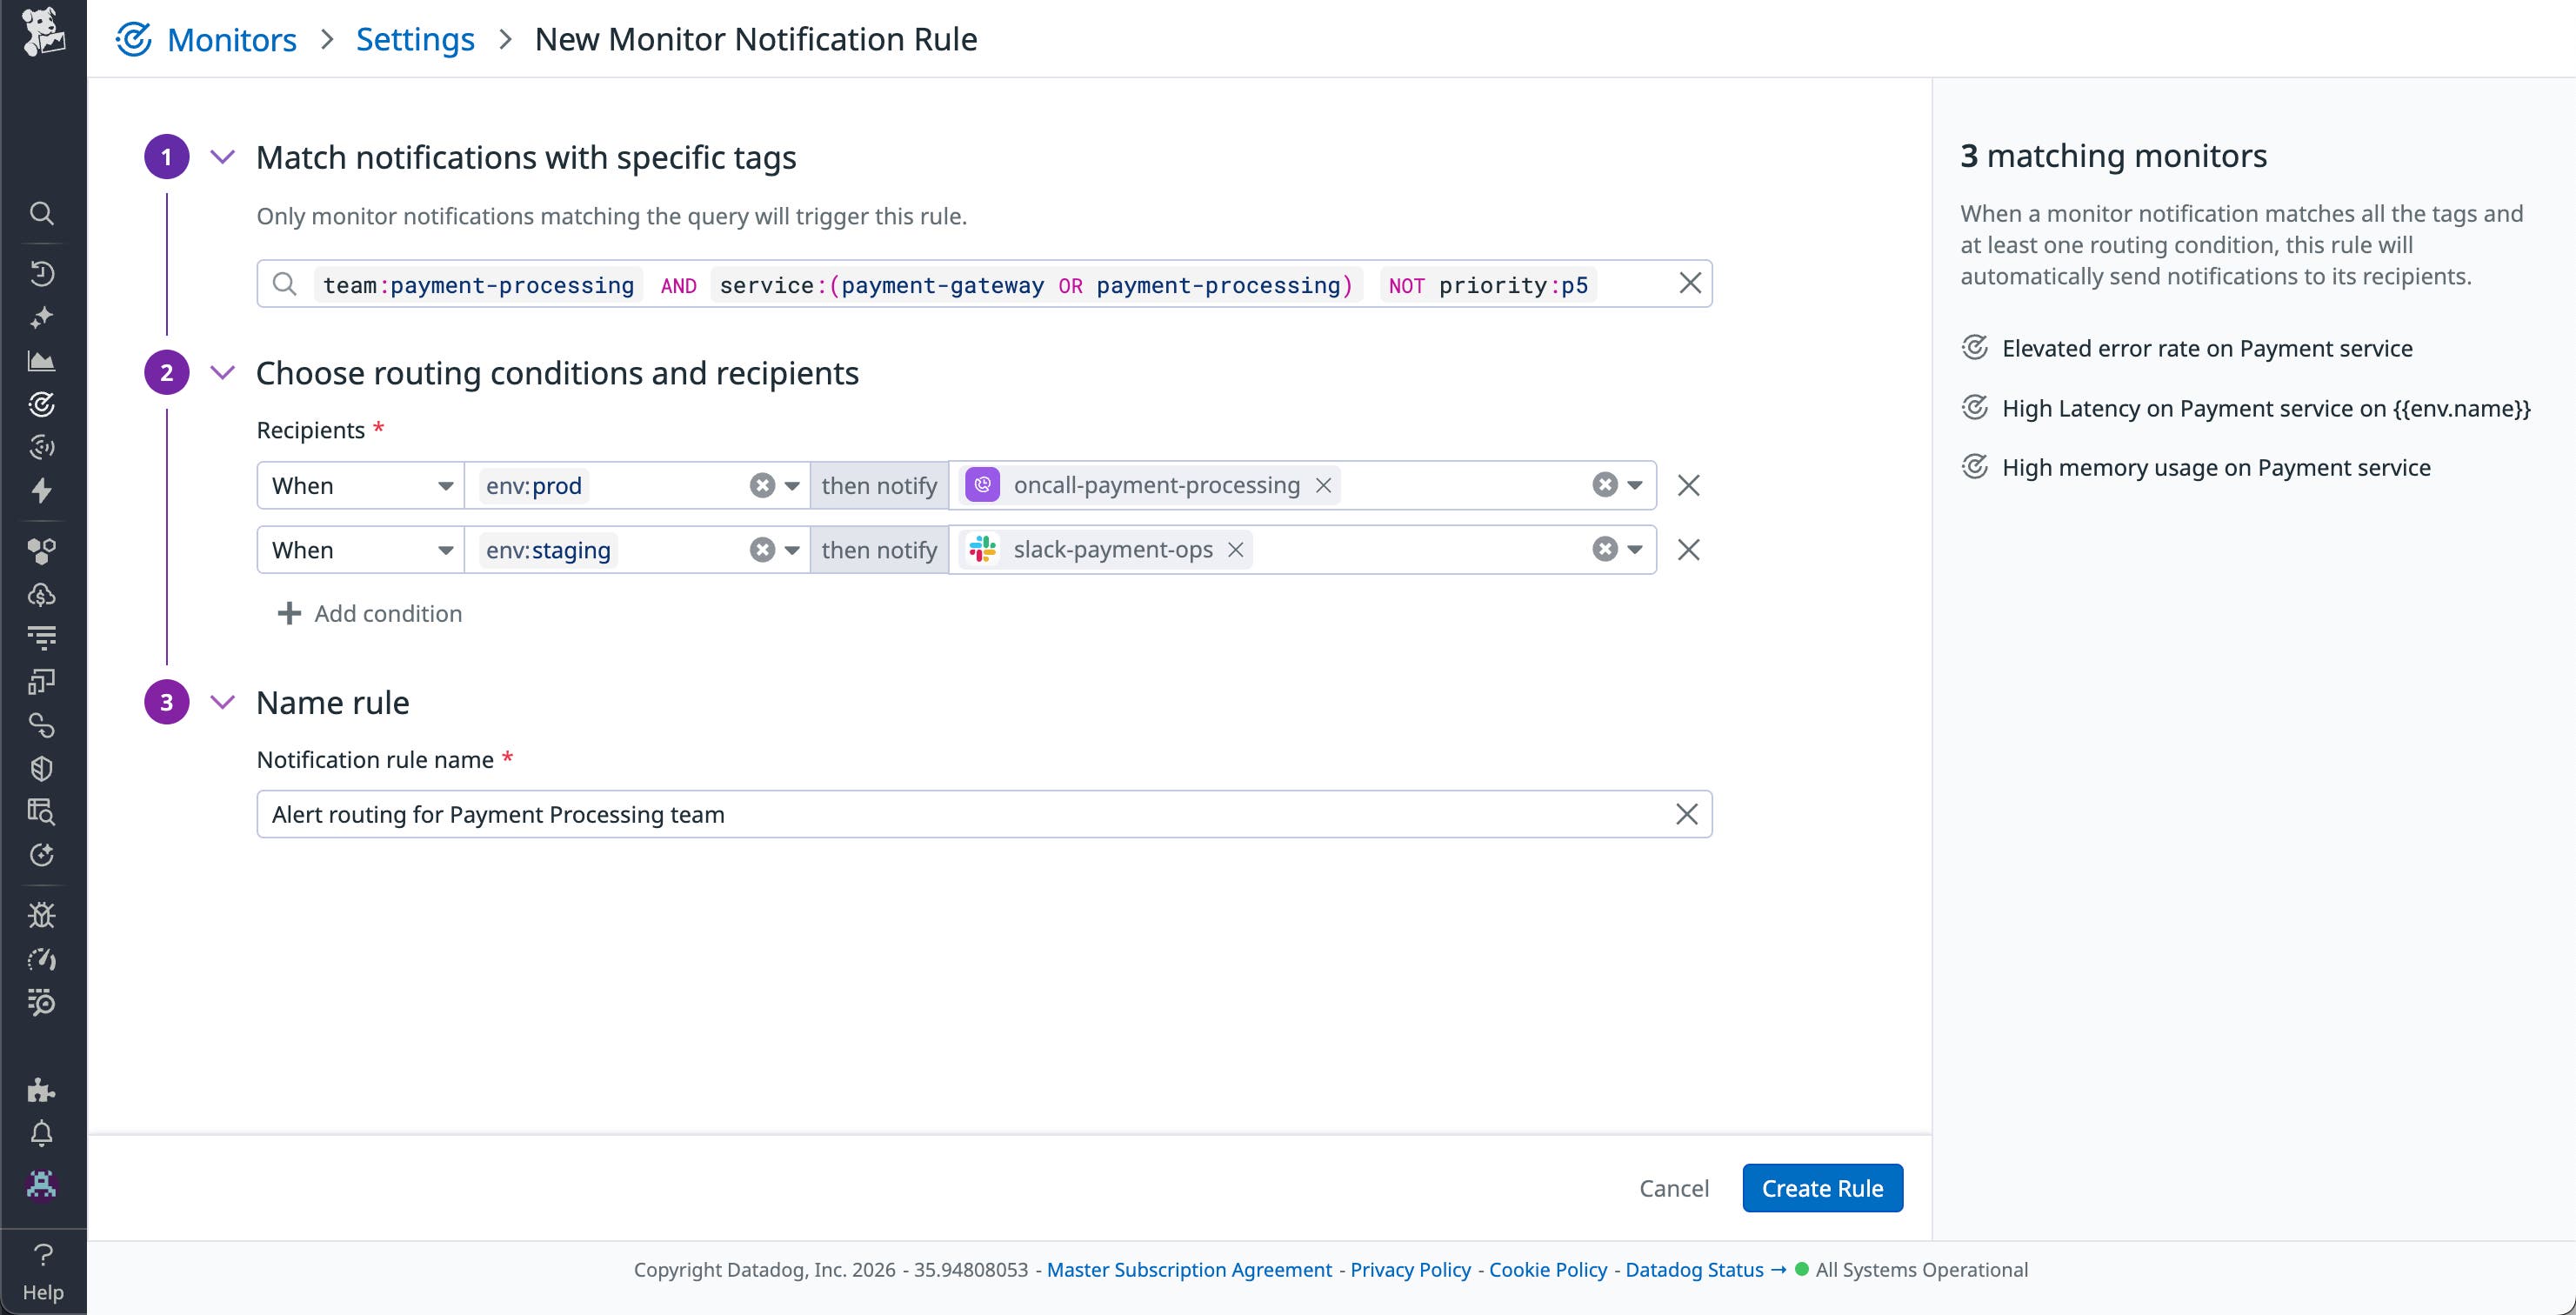
You can define scopes by using a query language that supports AND, OR, and NOT operators, enabling you to consolidate your routing strategy into a single, comprehensive rule. You can also filter rules based on the monitor’s transition type (for example, alert, warning, and recovery), ensuring that only the most meaningful transitions trigger a notification. Finally, to eliminate complex conditional logic in monitor messages, you can set conditional logic directly on recipients within a rule, routing alerts to different channels based on tags (for example, env or priority). These capabilities give you centralized control over alert delivery without the manual overhead.
Let’s say that you have an ecommerce platform that includes checkout, catalog, search, and payment services. Each service is owned by a separate team and is instrumented with dozens of monitors that have tags of team, service, and env. By migrating to monitor notification rules, you can use those existing tags instead of editing message templates.
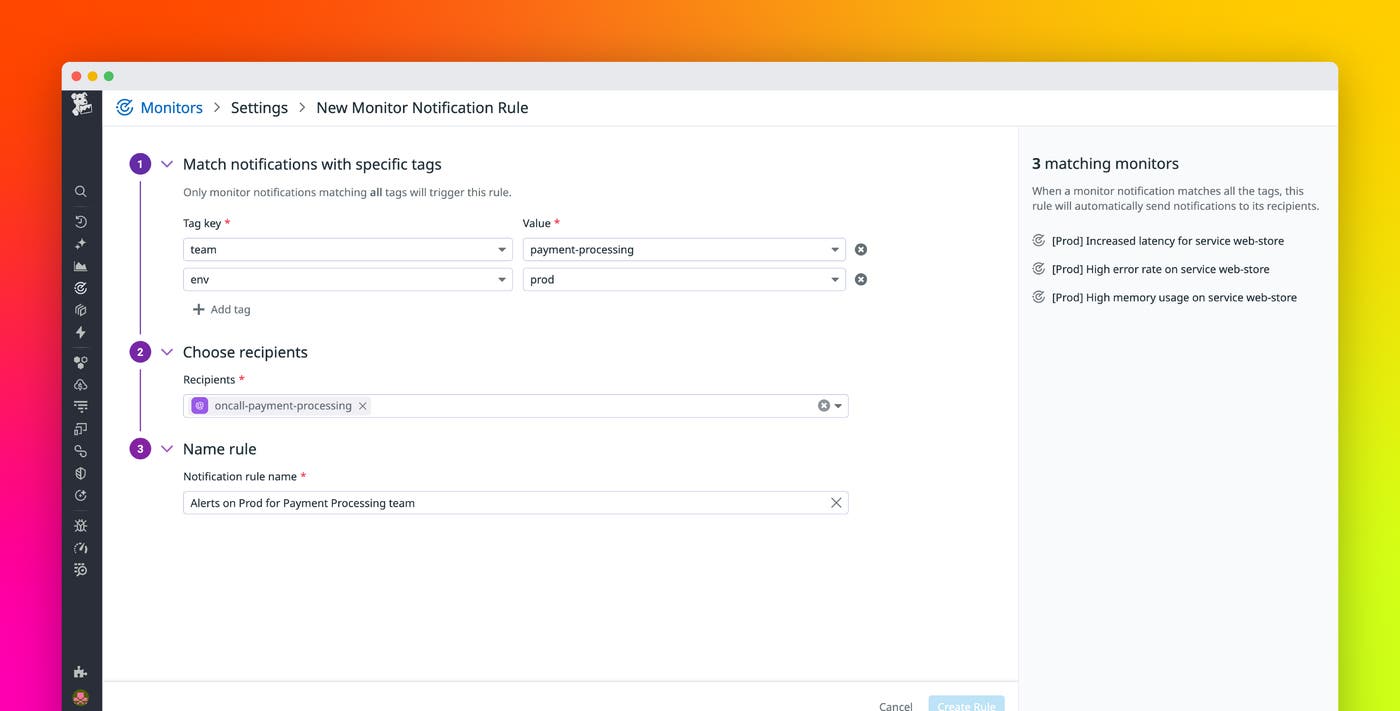
A single rule that is scoped to team:payment-processing can route alerts to different destinations based on environment. For example, alerts with env:prod page the on-call engineer, while alerts with env:staging post quietly to a Slack backlog. You can also rely on the query language, using team:payment-processing AND service:(payment-gateway OR payment-processing) NOT priority:p5 to include only specific services and exclude low-priority signals. Because scope is tag-based, current and future monitor notifications that match the rule’s logic will be routed to the right recipients. When payments team members create new monitors for additional failure scenarios, they simply tag them team:payment-processing. No one touches a notification string, yet routing works from day one.

By thinking beyond individual monitors and using the query language and the conditional logic on recipients, you can create notification rules that handle complexity with ease. As a result, you can group related alerts, reduce noise by getting notified only for specific transitions that matter to you, escalate only when necessary, and align alert priority with business impact.
Best practices for monitor notification rules
A solid tagging strategy is the gateway to effective alert routing. If you’re still refining your tagging strategy, read our blog post about managing monitors with Datadog Teams. When your monitors carry consistent tags, each team can formalize its own routing logic in minutes.
To get the most out of your monitor notification rules, we recommend the following best practices:
- Tag your monitors: Make tags (such as
team,service, andenv) that fit your alerting strategy a required element on every monitor. Clean, consistent tagging keeps rule scopes precise and helps ensure that notification rules apply automatically as new monitors appear. Check out how Datadog monitor tag policies can help you implement an effective tagging strategy. - Define clear ownership: Every rule should have an obvious owner. Scope each rule to a specific team so that it’s clear who maintains the policy—and who gets paged—when a matching monitor fires. Clear ownership prevents orphaned routes and speeds up reviews.
- Start narrow and then broaden: Begin with the tightest scope that meets your immediate need (for example,
team:payment-processing AND env:prod AND priority:P0). After you confirm that routing works, widen the scope incrementally (for example, include all priorities, not onlyP0). Shrinking an overly broad rule after alerts start spamming multiple teams is much harder than widening a precise rule.
Start managing your alerts more efficiently today
As your infrastructure grows at an ever-increasing rate, managing alerts effectively is crucial to maintaining operational efficiency. Datadog’s monitor notification rules provide flexibility, control, and scalability to help your teams stay informed, focused, and ready to act when critical issues arise. To learn more, check out the monitor notification rules documentation.
If you don’t already have a Datadog account, you can sign up for a 14-day free trial to get started.


