Mahip Deora

Barry Eom

Nicole Cybul
As organizations rapidly scale their use of large language models (LLMs), many teams are adopting LiteLLM to simplify access to a diverse set of LLM providers and models. LiteLLM provides a unified interface through both an SDK and proxy to speed up development, centralize control, and optimize LLM-powered workflows. But introducing a proxy layer adds abstraction, making it harder to understand how requests are processed. This challenge is particularly prominent when it comes to understanding model selection, performance, and cost attribution.
To address this, we are pleased to announce Datadog’s Agent integration and SDK with LiteLLM, which enable you to easily monitor, troubleshoot, and optimize your LiteLLM-powered applications.
The LLM Observability SDK provides deep, application-level visibility into how agents and applications interact with LLMs through LiteLLM. The SDK traces every request end-to-end, giving you insights into model and provider performance, token usage, latency, and prompt content. Whether you’re debugging slow agent responses or analyzing model cost tradeoffs, the SDK helps teams rapidly identify issues and optimize behavior.
The Datadog Agent integration monitors the LiteLLM proxy service itself. This integration surfaces high-level metrics about the service’s health including request volumes, error rates, latency distributions, and overall provider costs. These metrics enable platform teams to track performance trends, detect infrastructure issues, and ensure reliability at scale.
Together, these tools provide full-stack observability across your LLM workflows: from the initial application call, through LiteLLM, to the final response from your LLM provider. In this post, we’ll show you how the Datadog LiteLLM integration and SDK help engineering and AI teams gain actionable insights and accelerate troubleshooting across their LLM-powered applications.
Monitor, evaluate, and troubleshoot LiteLLM agents and applications faster with end-to-end tracing
LLM Observability SDKs instrument your applications, tracing every LLM request end-to-end and enriching those traces with metadata such as token usage, model and provider details, and prompt content. Getting started with Datadog’s LiteLLM SDK is simple and requires just a few steps. Users need to enable LLM Observability in their Datadog account, install or upgrade to dd-trace-py version 3.9.0 or later, and activate auto-instrumentation in their Python environment. Full setup instructions are available in the Datadog documentation.
Once enabled, the SDK allows you to easily track how your team or organization uses LLMs across different models, providers, and teams. Datadog automatically traces all LLM requests and enriches them with key metadata such as token counts, estimated cost, and the base URLs of the proxies that handled those requests. By doing so, Datadog allows organizations to analyze and understand which LLMs and providers are used most frequently by specific teams or applications. For instance, you can use contextual fields like user and team aliases to break down usage patterns and ensure fair allocation of resources.
Additionally, Datadog’s SDK with LiteLLM enables you to quickly pinpoint and resolve issues across your LLM stack using rich, end-to-end tracing.

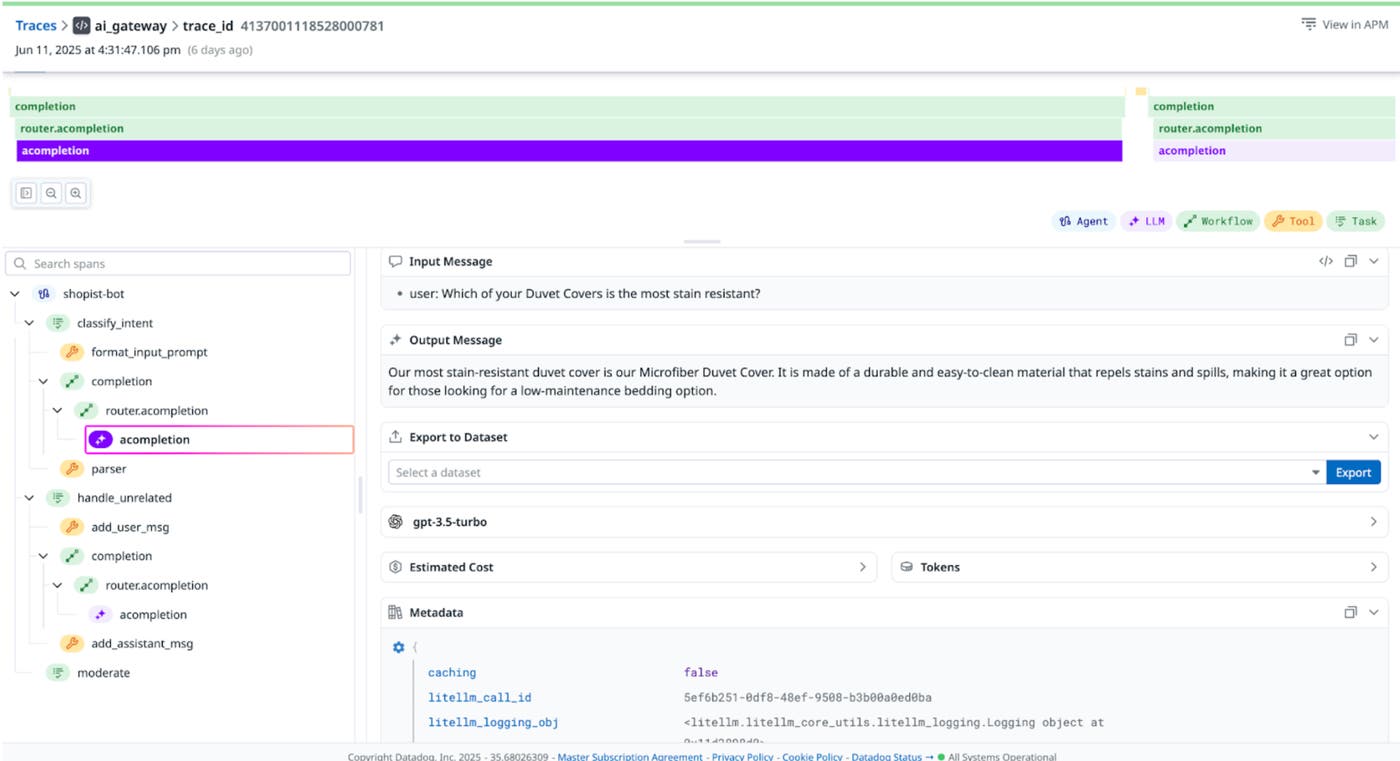
From initiation to response, each LiteLLM request is traced as a span that captures the full lifecycle of the interaction. These traces include metadata that enables performance monitoring so teams can identify latency spikes and bottlenecks, whether they stem from LiteLLM’s routing logic, delays from the underlying model provider, or issues with specific endpoints.
Datadog also surfaces errors, retries, and fallback events, making it easier to detect recurring failure patterns and investigate retry logic and timeouts. You can inspect the content and structure of each request and response—including the prompt, user roles, and any parameters—which helps debug issues like unexpected outputs, prompt formatting mistakes, or unusual model behavior. This telemetry data can be correlated across your stack using shared trace and call IDs, along with contextual fields like user or team aliases and cache status.
The traces collected by Datadog LLM observability empower teams to proactively monitor, troubleshoot, and optimize their LLM-powered applications with granularity and speed.
Monitor LiteLLM performance, usage, and cost in real time
Datadog Agent integrations (like the LiteLLM integration) connect directly to your infrastructure via the Datadog Agent and capture data about the performance of a service and its underlying components. Enabling the LiteLLM native integration is simple. First, ensure the Datadog Agent, with the latest version, is installed on the same host as the LiteLLM instance, and then configure the LiteLLM integration on the Agent.
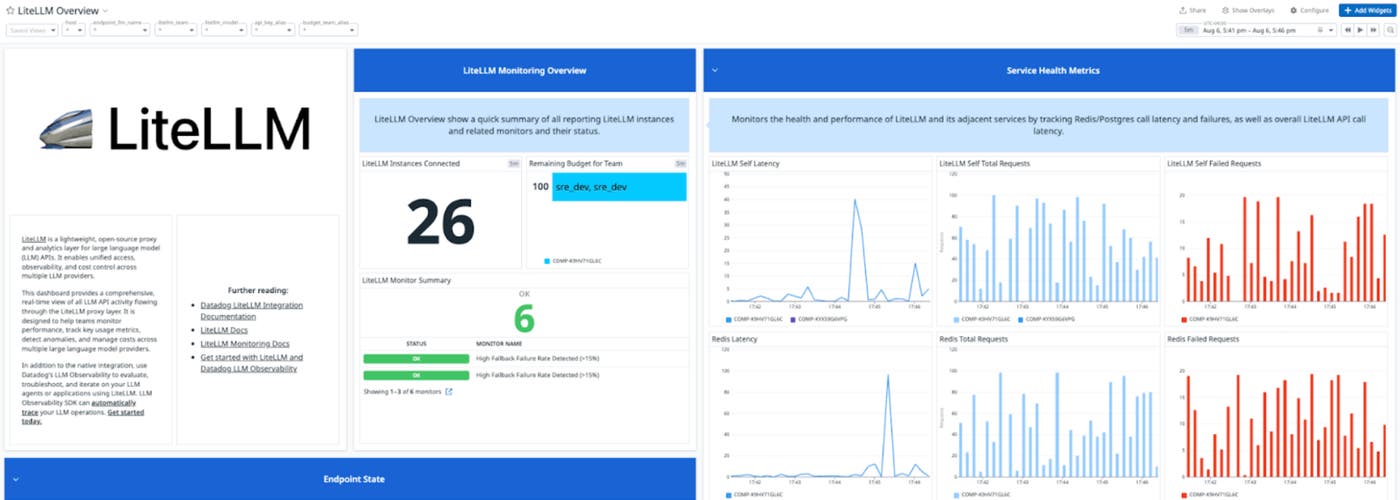
Once the integration is enabled, data about your LiteLLM instances starts to flow in, including request volume, latency percentiles, error and fallback rates, token usage, and estimated cost. No code changes are needed, the Datadog Agent starts capturing this data out of the box.
These metrics provide real-time visibility into how your LiteLLM instance is handling traffic. Request and response counts help track usage trends, while latency metrics like p95 surface performance issues early, such as slowdowns tied to specific providers or routes. Error and fallback rates highlight instability or misrouted requests, helping teams catch issues before they impact user experience. The integration also captures metrics from internal LiteLLM components, such as Redis and PostgreSQL, highlighting potential performance bottlenecks within the instance itself.
Additionally, you can track token usage and estimate costs for each request, supporting internal chargebacks and budgeting. For example, if your organization uses multiple providers like OpenAI and Anthropic, you can compare usage across teams or applications to ensure consistent cost management. You may discover that a specific service is disproportionately relying on high-cost models for low-priority tasks, an insight you can use to shift those requests to more cost-effective alternatives or enforce token limits.
All telemetry is tagged with key metadata, like team, model, and host, so teams can easily compare performance and cost across applications, environments, or use cases. Whether you’re troubleshooting latency or managing LLM spend, this integration gives you the data you need to operate LiteLLM with confidence. This granular visibility empowers you to make data-driven decisions about host sizing, model selection, provider usage, and resource allocation across your LLM-powered workflows.

End-to-end visibility of your LiteLLM Service
While the native LiteLLM integration gives you immediate visibility into how your proxy is performing, surfacing metrics like request volume, latency, token usage, and cost, the LiteLLM SDK extends that visibility deeper into your applications and agents. When used together, the SDK and integration provide full end-to-end observability of your LLM stack, from the initial application call all the way through the LiteLLM instance to the final model response.
This unified view allows teams to pinpoint exactly where latency or failures are introduced, whether they're due to prompt generation logic in the application, fallback behavior in LiteLLM, or delays from the underlying LLM provider. Metrics from the native integration show performance trends at the infrastructure level, while spans from the SDK reveal the functional flow of requests, including retries, cache usage, and provider selection decisions.
This level of correlation is especially powerful for debugging and optimization. For instance, when a monitor detects a spike in p95 latency on a specific route, you can pivot directly into traces that reveal which teams, user paths, or model configurations were involved. Similarly, if a certain prompt path starts incurring high token costs, you can trace it back to the originating service or user workflow and take action, whether that’s optimizing prompt length, adjusting routing logic, or changing models.
Together, the SDK and integration give you complete insight into both how LLM requests are handled and why they behave the way they do. This holistic observability empowers engineering and AI teams to move faster, troubleshoot smarter, and make data-driven decisions about performance, reliability, and cost.
Start observing LiteLLM-powered AI agents and applications today
As LLM-powered applications become more central to business operations, having unified, actionable observability is critical. With Datadog’s native LiteLLM integration and SDK, you can confidently monitor, troubleshoot, and optimize every LLM request no matter how complex your stack.
Configure the LiteLLM integration today to start tracking performance metrics for your LiteLLM instances, and instrument LiteLLM with Datadog with Datadog to unlock end-to-end visibility for your AI-driven applications. For more information, check out the dd-trace-py v3.9.0 release notes and our LLM Observability documentation.
If you are an existing Datadog customer, you can start monitoring your serverless application today. Otherwise, sign up for a 14-day free trial.

