Kiyoto Tamura
This is a guest post from Kiyoto Tamura, developer evangelist at Treasure Data.
Why you should build a unified logging layer
Every software engineer agrees that logs are valuable. Your logs give you insights into site performance, customer behavior, and gnarly bugs that you can’t reproduce on the staging servers.
What is not as obvious is that it pays huge dividends to collect and store your logs in a robust manner. By building a unified layer that connects your log sources and data backends, your logging infrastructure can keep up with your business’s growth; in fact, it can even help you accelerate growth by helping you learn more from your data faster.
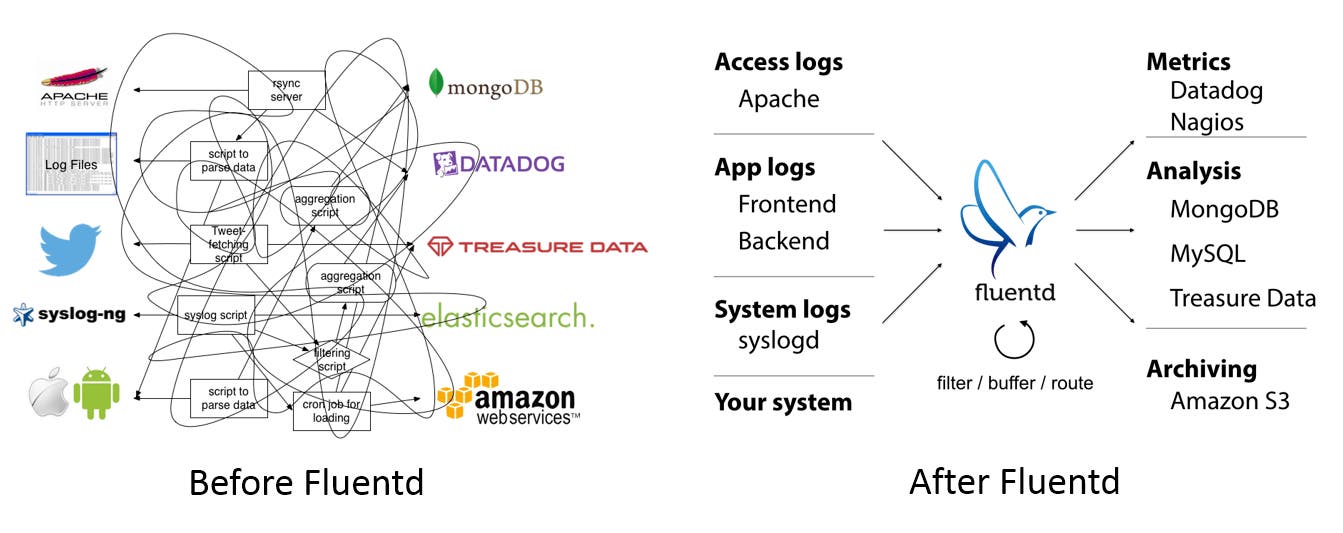
Fluentd is one solution to building such a unified logging layer. If you are more of a visual person, here is what Fluentd does:

What is Fluentd?
Fluentd is an open source data collector to unify logging infrastructure. Unlike traditional logging tools like syslogd, it has four key properties:
- Unified Logging with JSON: Fluentd tries to structure data as JSON as much as possible. This allows Fluentd to unify all facets of processing log data: collecting, filtering, buffering, and outputting logs across multiple sources and destinations. The downstream data processing is much easier with JSON, since it has enough structure to be accessible without forcing rigid schemas.
- Pluggable Architecture: Fluentd has a flexible plugin system that allows the community to extend its functionality. The 1,000+ community-contributed plugins connect dozens of data sources to dozens of data outputs, manipulating the data as needed. By using plugins, you can make better use of your logs right away.
- Minimal Resources Required: A data collector ought to be lightweight so that the user can run it comfortably on a busy machine. Fluentd is written in a combination of C and Ruby, and requires minimal system resources. The vanilla instance runs on 30-40MB of memory and can process 13,000 events/second/core.
- Built-in Reliability: Data loss should never happen. Fluentd supports memory- and file-based buffering to prevent inter-node data loss. Fluentd also supports robust failover and can be set up for high availability.
Datadog and Fluentd
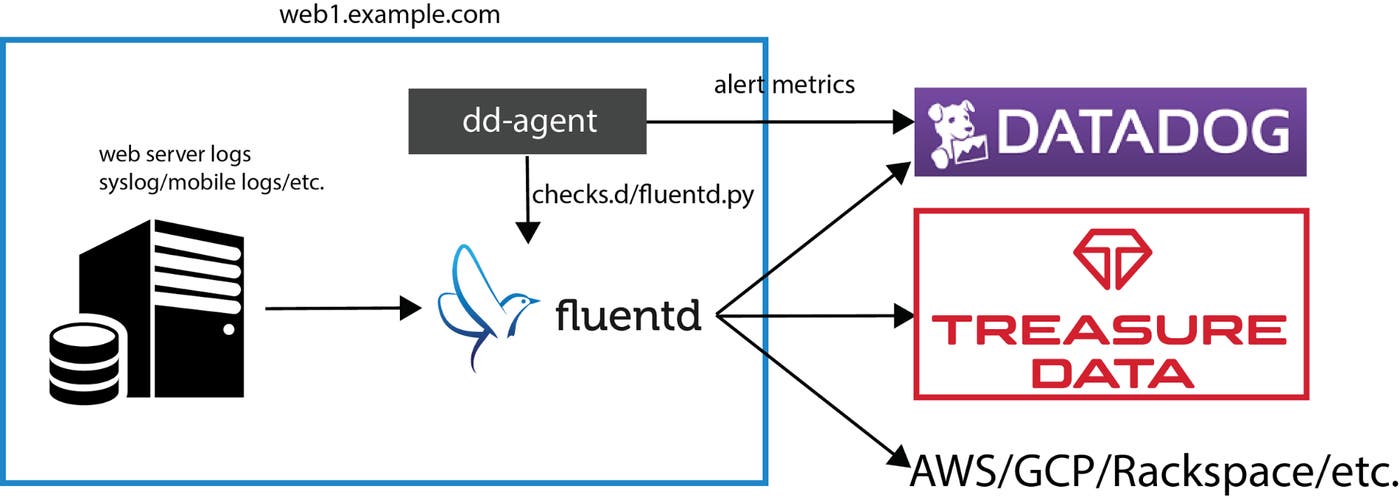
So, how does Fluentd integrate with Datadog? There are two ways in which Fluentd comes into play for the Datadog community.

- Datadog as a Fluentd output: Datadog’s REST API makes writing an output plugin for Fluentd very easy. Here is one contributed by the community as well as a reference implementation by Datadog’s CTO.
- Monitoring Fluentd with Datadog: Fluentd is designed to be robust and ships with its own supervisor daemon. That said, we all know better than letting any middleware go unmonitored. Many organizations use Fluentd as a critical component of their data pipeline, and should there be any issue, their engineers are notified right away.Luckily, Takumi Sakamoto, a joint user of Fluentd and Datadog, recently added native support in the Datadog Agent for Fluentd so that its performance can be monitored on a per-output basis. Read on for step-by-step instructions.
Setting up the Datadog Agent to monitor Fluentd
In this section, we will show you how to monitor Fluentd as it streams Apache access logs to Treasure Data. We assume that:
- You already have an account with Datadog (if not, sign up here)
- You are on Ubuntu Trusty (but Ubuntu Precise, RHEL/CentOS 6/7, OSX 10.8 and above are supported)
- You have dd-agent installed
- You have an account with Treasure Data (if not, sign up here) and have access to your API key
Keep in mind you can use a wide range of output destinations other than Treasure Data. See here and here for some examples.
The first step is installing td-agent, Fluentd’s package maintained by Treasure Data. Run the following command from the terminal to install it.
curl -L http://toolbelt.treasuredata.com/sh/install-ubuntu-trusty-td-agent2.sh | shThen, edit /etc/td-agent/td-agent.conf (which has some defaults) as follows (replace TD_API_KEY with your Treasure Data API key):
# This section tails an Apache2 log file located # at /var/log/apache2/access.log. # For other common data sources, please see # https://www.fluentd.org/datasources
type tail format apache2 path /var/log/apache2/access.log tag td.apache.access
# This is the main output for Treasure Data. # For other common data outputs, please see # http://www.fluentd.org/dataoutputs
type tdlog apikey TD_API_KEY auto_create_table buffer_type file buffer_path /var/log/td-agent/buffer/td id treasure_data
# This enable Fluentd's monitoring API, # which will be used by Datadog's Fluentd checker.
type monitor_agentOne key line is “id treasure_data”, which assigns a unique ID to the Treasure Data output plugin. This ID tells dd-agent’s Fluentd checker which output plugin to monitor.
With /etc/td-agent/td-agent.conf updated, td-agent should be restarted.
sudo service td-agent restartTo enable the Fluentd checker in the Datadog Agent, just move /etc/dd-agent/conf.d/fluentd.yaml.example to /etc/dd-agent/conf.d/fluentd.yaml and update it as follows:
init_config:instances: # For every instance, you have an `monitor_agent_url` # and (optionally) a list of tags. - monitor_agent_url: http://localhost:24220/api/plugins.json plugin_ids: - treasure_data # same id as in td-agent.confWith the updated config, restart dd-agent:
sudo service datadog-agent restartVisualize and monitor Fluentd
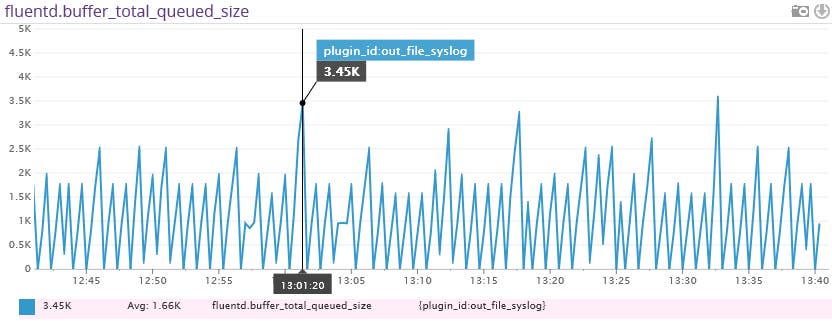
After a few minutes (td-agent buffers data locally and uploads them every five minutes by default), you start to see a graph like this under Datadog’s Metrics Explorer (graph fluentd.buffer_total_queued_size).

The above metric, fluentd.buffer_total_queued_size tracks how many bytes of data are buffered in Fluentd for a particular output. If you start to see a steadily increasing line, you should check if the network connection to your output (Amazon S3, etc.) is fast enough. Another way to check is looking at fluentd.retry_count, which tracks how many times Fluentd retried to flush the buffer for a particular output. Once you learn what the steady state looks like for each output, you can create a metric monitor in Datadog to be alerted when Fluentd’s throughput is critical.
Conclusion
Fluentd is a versatile tool to collect application and server logs for various purposes that you can use to send data to various backend systems. Datadog is the perfect monitoring platform to visualize and monitor Fluentd’s performance as well as over 100 other applications and components.
If you want to learn more about Fluentd, check out the website, docs and GitHub repo and ask questions on Twitter and our mailing list!
If you’re a current customer check out the Fluentd integration now available in the Datadog Agent 5.2. If you’re not a customer sign up for a 14-day free trial of Datadog.


