Bowen Chen

Steve Harrington
Datadog Product Manager
As enterprises build and scale business-critical applications on Azure, they need continuous visibility to understand the health and performance of their services. This can be a challenge, especially for enterprises with large-scale deployments that include an ever-increasing number of subscriptions, resources, and teams. We’re excited to announce a number of enhancements for Azure that will help enterprise customers ensure comprehensive observability and easily onboard new teams and applications to Datadog.
A foundational component of monitoring Azure environments in Datadog is our Azure integration. Once configured, this integration continuously collects metrics from all of your Azure services and enriches them with tags. This enables you to easily scope dashboards and monitors to the relevant resources, and seamlessly pivot across logs, metrics, and traces inside the Datadog platform. Our Azure integration also generates metrics that provide unique insights into your resource statuses, rate limits, quota usage, and more.
Whether you are a longtime Azure Monitor user or just starting to migrate to the cloud, we've enhanced our integration to make it easier and faster to start monitoring your enterprise-scale environment. Our streamlined onboarding processes enable visibility across your entire organization in just minutes—even if you’re managing hundreds or thousands of subscriptions.
In this post, we’ll cover the following updates:
Faster metric collection with the Azure Monitor Metrics Data plane API
Streamlined monitoring setup for multiple Azure subscriptions
Automatic custom metric collection from Application Insights
Recommended alerts for popular services with Azure recommended monitors
Faster metric collection with the Azure Monitor Metrics Data plane API
The Azure Monitor REST API provides telemetry that enables organizations to track the health and performance of their Azure resources. However, as environments scale, this API can become overloaded, resulting in throttling and excessive latency.
To address this challenge, Datadog partnered with Azure to develop and test the Azure Monitor Metrics Data plane API. This API supports increased querying limits and allows Datadog to ingest Azure metrics more efficiently. The result is that Datadog is able to ingest all Azure Monitor metrics with minimal latency, even for enterprise-scale environments. This highly efficient metric collection means that Datadog customers can track the health and performance of their Azure services in near-real time and get notified quickly when issues arise.
Set up monitoring for enterprise-scale environments in just a few clicks
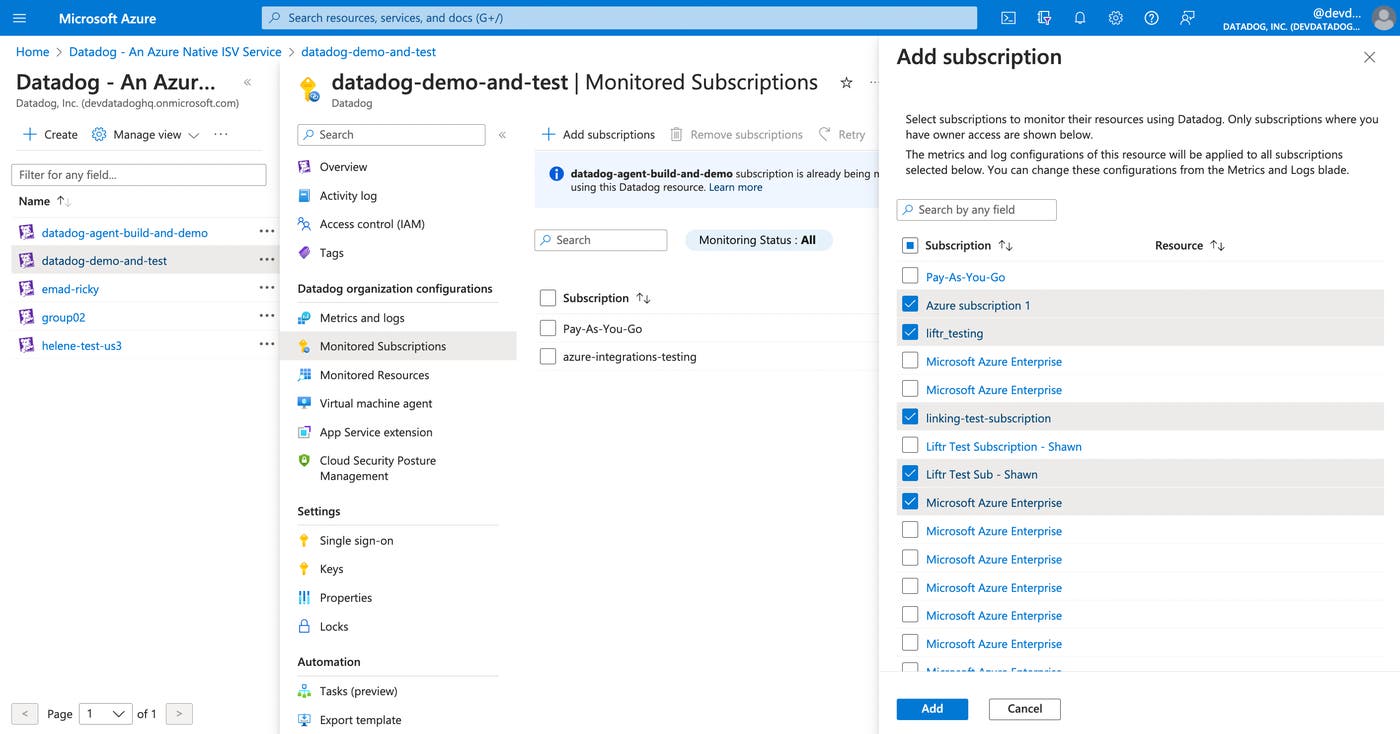
If you're overseeing hundreds or thousands of subscriptions, you need configuration options that scale accordingly. Our Azure Native integration (available for customers on Datadog’s US3 site) enables you to easily set up the Azure integration directly in the Azure portal. We've streamlined this process even further by making it possible to use just a single Datadog resource to configure monitoring for all of your subscriptions (as shown below). In just a few minutes, you can specify all the subscriptions you want to monitor with Datadog and configure the collection of Azure metrics and platform logs from across your entire environment, no matter how many subscriptions you are managing.

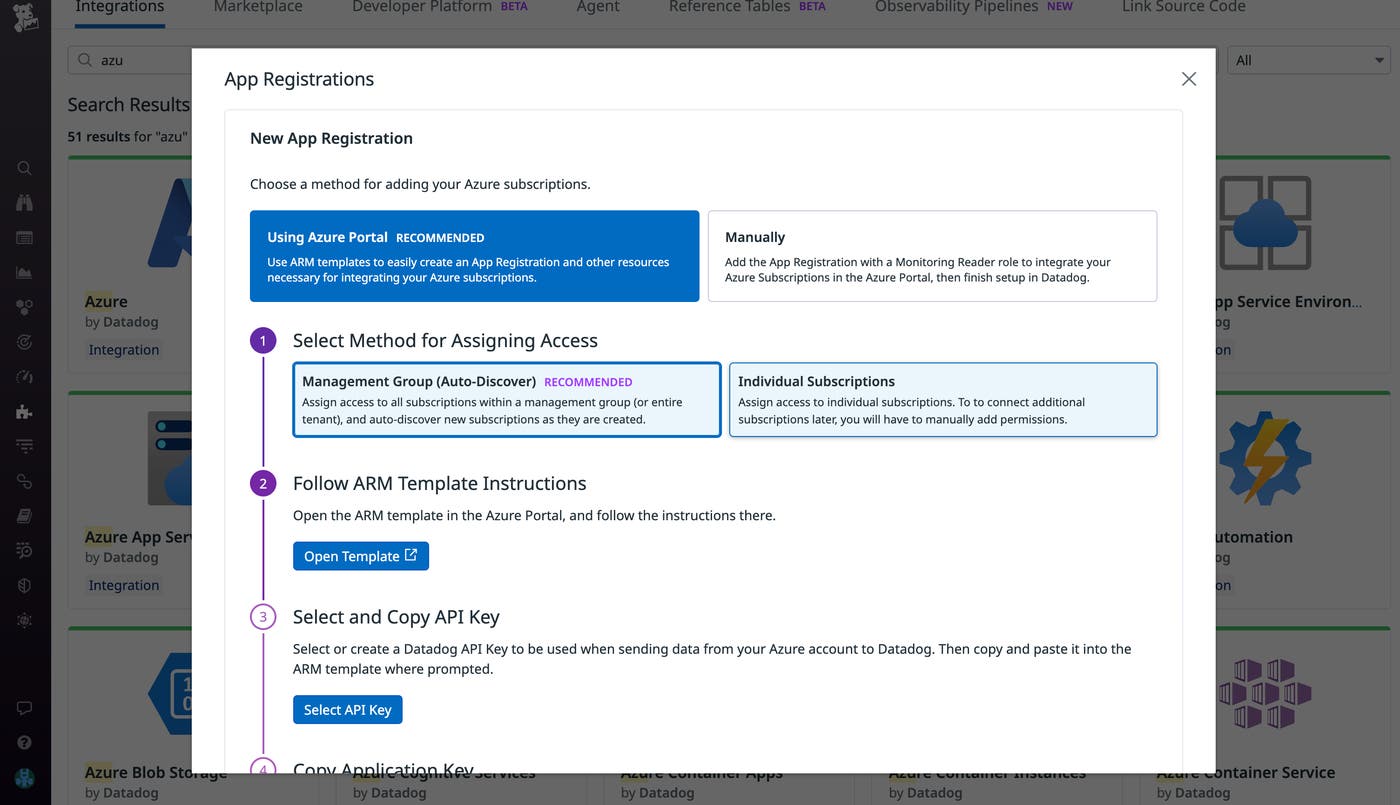
We’ve also added enhancements to the onboarding experience for our standard Azure integration (available on all Datadog sites). Using the new templates launched from the Azure tile in Datadog, you can set up the integration with a simple, click-through workflow. These templates also make it easier than ever to grant Datadog access at the management group or tenant level. When you configure our standard integration this way, Datadog will automatically discover and monitor new subscriptions as they are created, ensuring seamless monitoring coverage as your Azure environment scales.

Collect custom metrics directly from Azure Application Insights
Azure Application Insights enables you to collect custom metrics that provide unique insights into your application. In many cases, these contain some of the most business-critical information, such as revenue data or signals around how end users are interacting with your application.
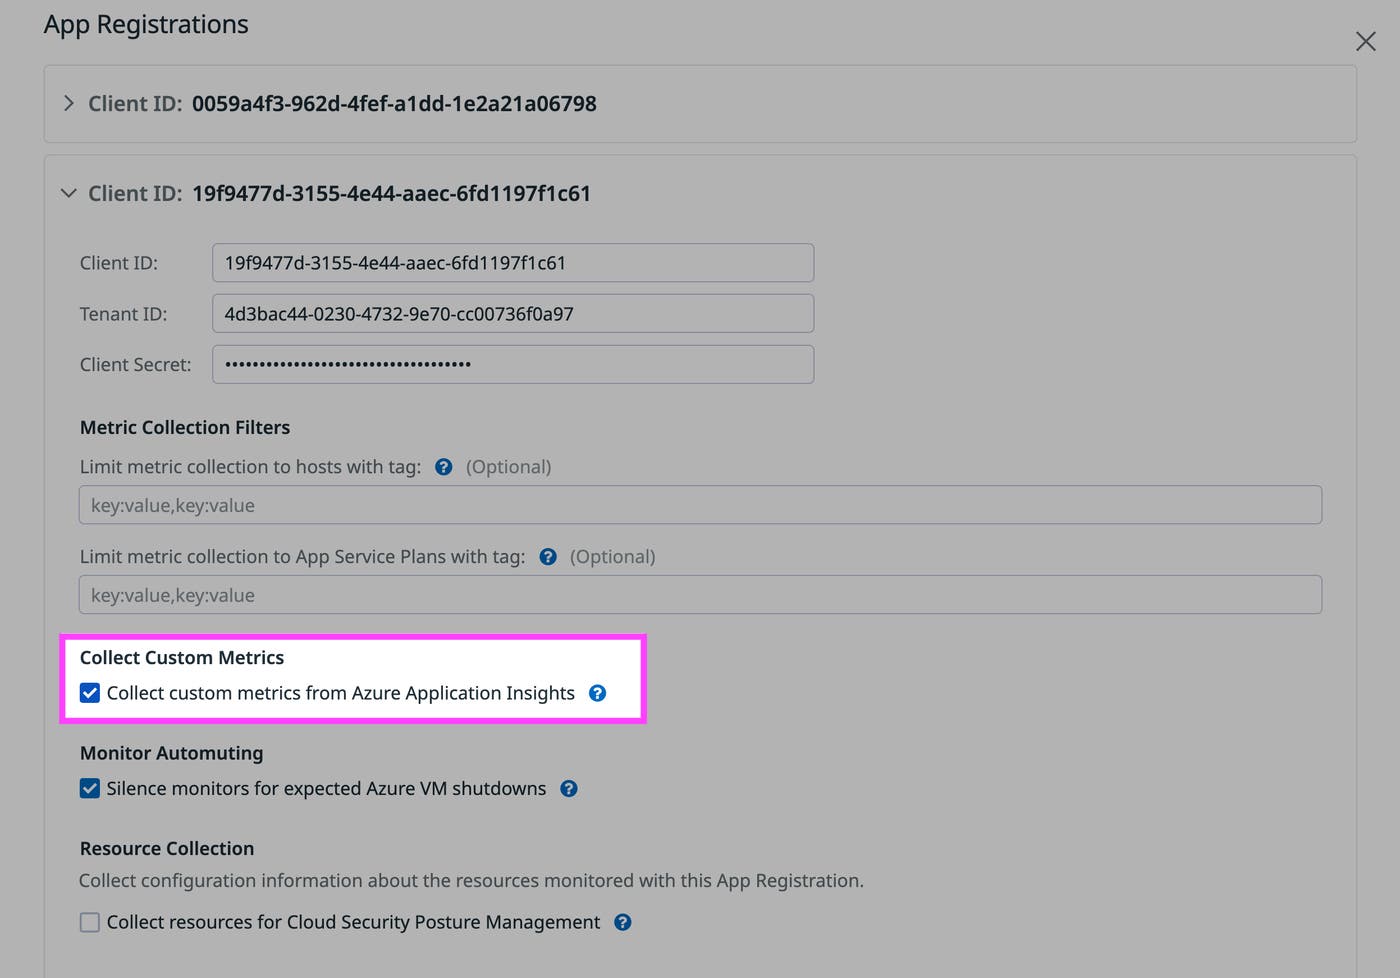
Datadog's Azure integration now enables the collection of your Application Insights custom metrics with a one-click setting. This is especially helpful if your organization is transitioning to Datadog from native Azure monitoring tools. We often see enterprises rely on centralized administrators to configure monitoring across many different workloads and applications owned by other teams. Since making changes to custom metrics requires code changes, getting these migrated over to Datadog can require a lot of coordination that becomes a real challenge as the number of teams grows. With the new option to enable Datadog to collect custom metrics directly from App Insights, admins can get all of their organization’s custom metrics populated in Datadog immediately.

Auto-detect potential issues with Azure recommended monitors
Automated monitors help ensure that your team will get notified about critical issues, but configuring these monitors can be time-consuming, particularly in a large-scale environment. Understanding which metrics are available, how potential issues may be signaled in these metrics, and establishing the right alerting thresholds can involve a significant amount of research.
Azure recommended monitors are available out of the box and can serve as a starting point to help you quickly get alerts in place for common issues. Whether you’re new to the cloud or a longtime Azure expert, recommended monitors can help your organization detect potential issues in:
Azure App Service
Azure App Gateway
Azure quotas and rate limits
Azure Service Health events
Azure SQL DB
Azure VM
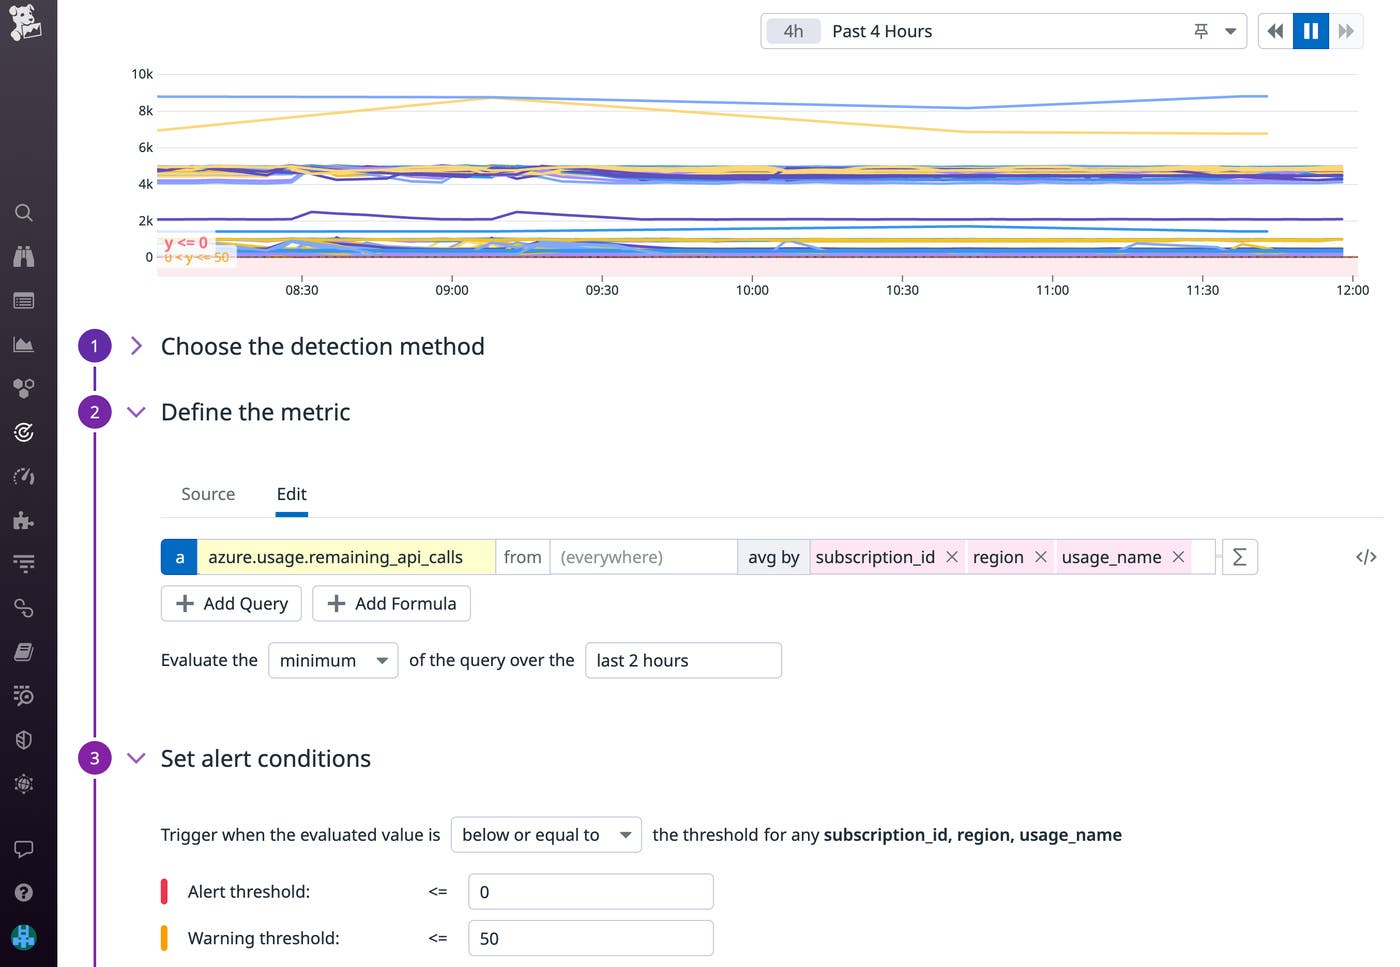
For example, the preconfigured Azure API rate limit monitor evaluates Datadog-generated usage metrics to notify you when you’re approaching global consumption limits. This enables you to take actions to remediate the issue, such as updating your retry logic to reset your connection after a certain number of attempts, before incidents occur.

You can explore all of the available Azure recommended monitors in the Datadog app by creating a "New Monitor" and selecting the “Recommended” tab.
Start monitoring your enterprise Azure environment with Datadog
Datadog’s simplified onboarding options enable even large-scale organizations to configure monitoring across their Azure environment in just minutes. And new Azure recommended monitors and App Insights custom metric collection make it faster and easier than ever for teams to leverage Datadog’s powerful observability platform for their Azure workloads. To get started, install the Azure integration.
If you don't already have a Datadog account, you can sign up for a free 14-day trial today.

