Jordan Obey
Senior Technical Content Writer
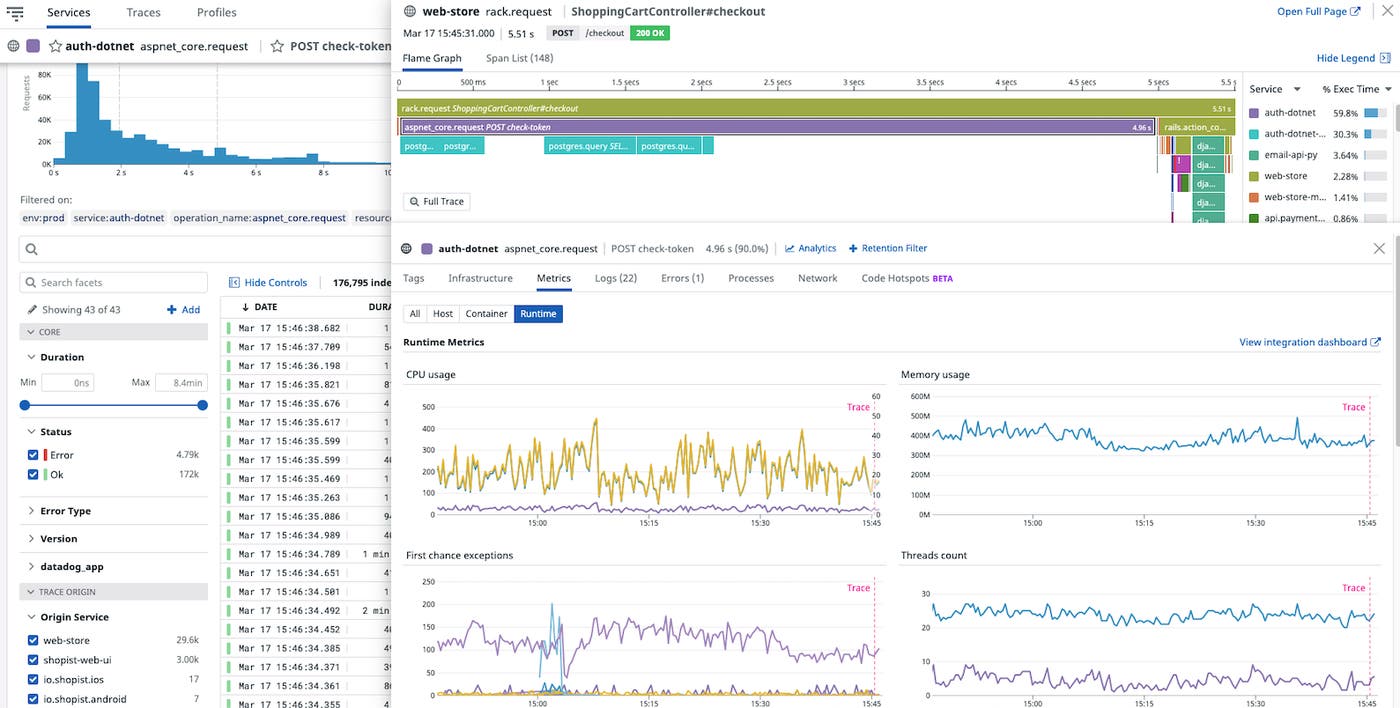
If you are a .NET developer, monitoring runtime metrics can help you troubleshoot bugs and detect resource inefficiencies in your applications. With Datadog, you can easily collect, visualize, and alert on key .NET runtime metrics, including exceptions, garbage collection statistics, thread count, and more. We have fully integrated .NET runtime metrics into Datadog APM so that you can easily view them alongside your distributed traces, logs, and other telemetry. Viewing .NET runtime metrics alongside other APM monitoring data gives you deep visibility into the health and performance of your .NET applications and more context when troubleshooting problems.

Monitor first-chance exceptions
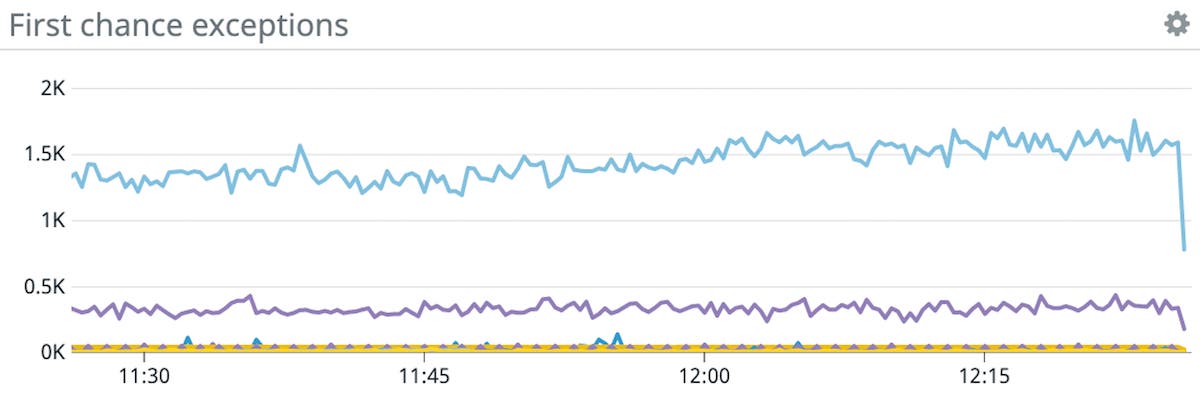
As applications grow in size and complexity, it increases the likelihood of running into exceptions. To prevent exceptions from degrading application performance, it's particularly important to monitor first-chance exceptions—notifications raised when an exception is first thrown, regardless of whether the exception is handled later (e.g., with a try/catch block). If a .NET application span shows high latency, Datadog can help determine if exceptions are a root cause by enabling you to quickly pivot to runtime metrics to view the count of first-chance exceptions (runtime.dotnet.exceptions.count).

Datadog collects the number of first-chance exceptions thrown by your .NET applications and automatically tags them by type (e.g., FileNotFoundException, InvalidOperationException, etc.), so that you have insight into both the volume and context of thrown exceptions. If there's a spike in the number of first-chance exceptions, it's an indication that your application is throwing unexpected exceptions which, if left unchecked, can stop your application from running.
Detect and avoid thread pool starvation to optimize performance
.NET supports multithreading and keeps idle threads available by returning them to thread pools after they've completed a task. Thread pools are useful because they enable applications to efficiently execute asynchronous tasks, but if your application runs thousands of tasks simultaneously, it may slow down while processes wait for idle threads.
This situation, where tasks are delayed because of busy threads, is called thread pool starvation, and it can lead to performance degradation. With Datadog, you can correlate potential signs of thread pool starvation, like a steady increase in thread count (runtime.dotnet.threads.count), to application performance to investigate an issue. For example, if you notice that specific parts of your application requests are showing high latency, you can check thread count to determine if it's because the request is waiting for a free thread.
Ensure .NET executes garbage collection efficiently
.NET includes a built-in garbage collector that automatically reclaims idle memory to ensure that there's memory available to execute future tasks. The garbage collector separates managed heap objects into three generations (0, 1, and 2) based on their age and size. Newly allocated objects are placed into generation 0. Longer-lived objects that survive garbage collection are promoted to the next generation, until they reach generation 2.
Garbage collection helps optimize application performance, so it's important to make sure that it's running efficiently. For example, frequent garbage collection can cause higher CPU usage. To determine if garbage collection is a cause of a spike in CPU usage, you can correlate .NET runtime CPU usage (runtime.dotnet.cpu.percent) with the number of executed garbage collections (runtime.dotnet.gc.count.<generation>). If you also notice that you have an unexpectedly high count of generation 2 garbage collections, it could be a sign, for example, that there's high memory pressure on your system, which you can check by viewing the percentage of total memory used by garbage collection (runtime.dotnet.gc.memory_load).

Get a complete view of your .NET applications
With Datadog, you can visualize and alert on .NET runtime metrics alongside distributed traces, logs, infrastructure metrics, code profiles, and more, so you can get a complete view of your .NET application in one place. To enable .NET runtime metrics collection, download the latest version of the .NET tracer and set the DD_RUNTIME_METRICS_ENABLED environment variable to true. Visit our documentation to learn more.
If you are not already using Datadog to monitor your application performance, get started today with a 14-day free trial.

