Jordan Obey
Azure App Service is a fully managed platform-as-a-service (PaaS) solution for deploying web applications, event-driven functions, RESTful APIs, and more. Azure App Service enables developers to quickly build and release services that scale dynamically—without worrying about provisioning and maintaining infrastructure. Last year, we released the Datadog extension for Azure App Service for deep visibility into your Windows .NET applications. But you may have web applications that are optimized for other runtimes, frameworks, and operating systems. To provide further visibility into Azure App Service, we’ve released Web App tracing and custom metrics for Azure App Service applications running in Linux-based environments with support for .NET, Node.js, Java, Python, and PHP runtimes.
In this post, we’ll look at how you can capture distributed traces across your Azure App Service Linux web applications, write and submit custom metrics, and tie it all together with the Azure Serverless view to gain quick insights and speed up troubleshooting.
Distributed request tracing for Linux apps
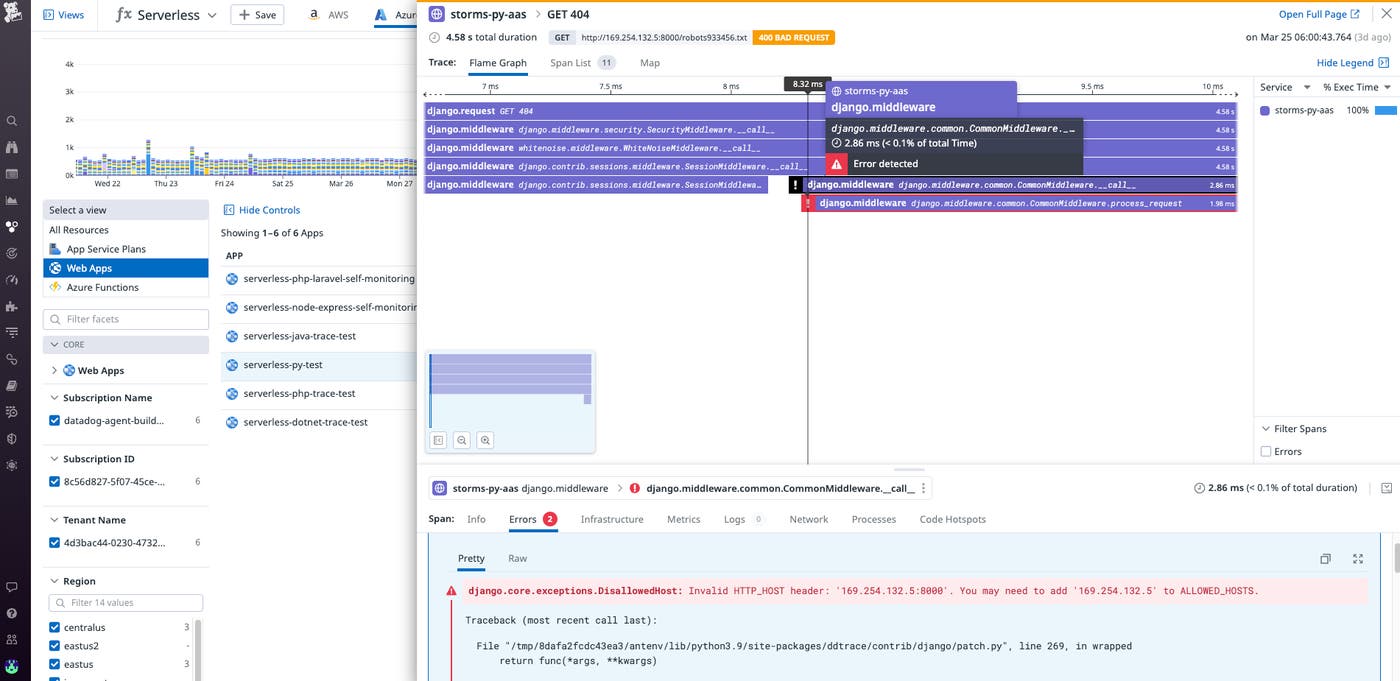
After you instrument your Azure App Service Linux web application, its request traces will be captured automatically. These traces are available through Datadog APM and are visualized as flame graph spans that represent the time it took for processes to execute in response to a request. Flame graphs trace the lifecycle of requests as they propagate across your stack, enabling you to see when your Linux web applications interact with any of your other cloud resources, such as an Azure SQL Database or Azure Function.
Datadog APM also automatically tags errorful spans to surface emergent issues. For instance, in the screenshot below we can see that a request to a Django Web App deployed in an Azure App Service Linux environment is throwing a DisallowedHost exception. This may indicate misconfigured settings or, more urgently, a legitimate security breach attempt.
Write and submit custom metrics
Sending custom metrics to Datadog is critical for monitoring key performance indicators (KPIs) that are important to your specific business and applications. If you are operating an ecommerce site running in a Linux environment, for example, you can create custom metrics for KPIs such as the number of visitors, average shopping cart size, average weekly revenue, and more. These metrics expand your monitoring capabilities by providing the flexibility to visualize telemetry tailored to your needs.
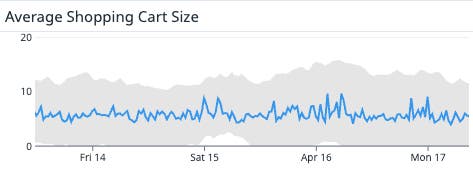
To start monitoring the KPIs of your choice and keep track of your applications’ performance, simply enable custom metrics in your Azure application settings and install the DogStatsD client for your runtime.
Pivot between Linux Web App telemetry in the Serverless view
Datadog’s Serverless view provides you with a birds-eye view of your entire Azure App Service architecture, enabling you to monitor your Linux web applications in context. And because Datadog automatically tags your instrumented Azure App Service resources, you can easily narrow your view down to the subset of resources you care most about. In the screenshot below, we’ve narrowed our view to only show the regions where Linux web applications are deployed.
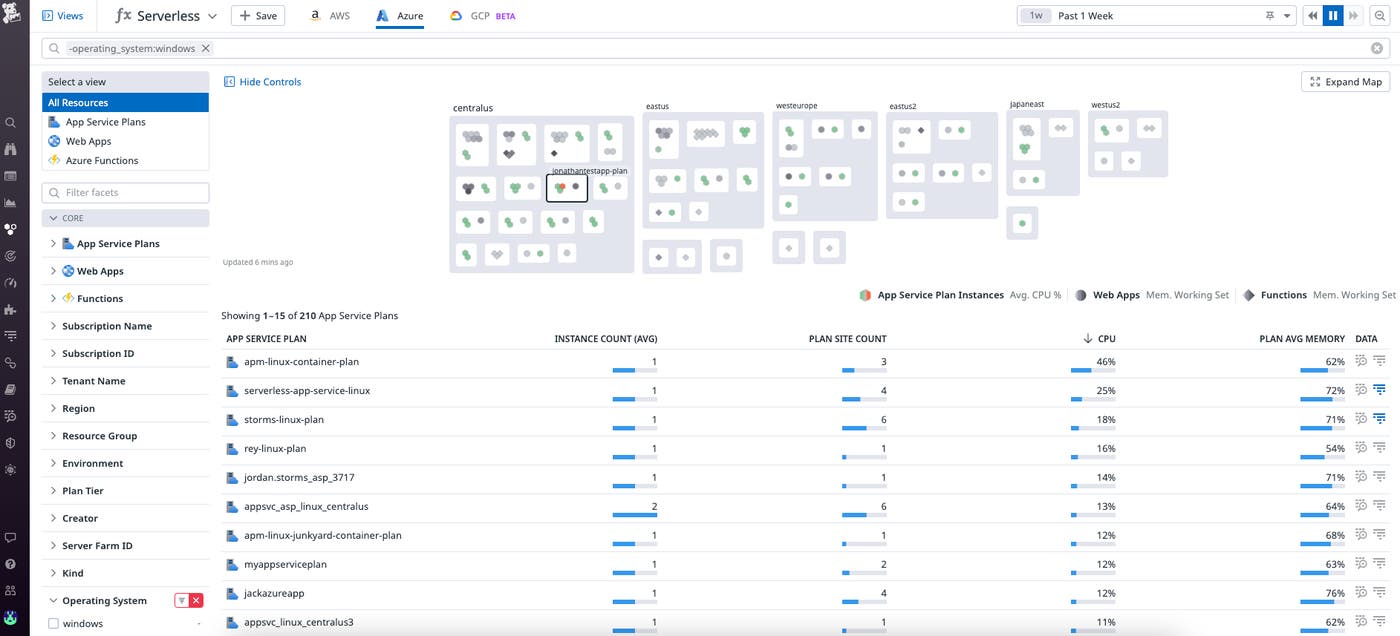
You can then filter your view down further to uncover slow or resource-intensive Web Apps for troubleshooting. Let’s say that you see a Web App named linux-example-aas-app with an unusually high response. From the Serverless view, you can click on that Web App and immediately pivot to its associated metrics and traces to surface root causes behind the issue that need addressing such as 4xx or 5xx errors.
Get started today
Distributed tracing and custom metrics are now currently available for Azure App Service Linux Web Apps with support for .NET, Node.js, Java, Python, and PHP runtimes. To learn more about how Datadog provides visibility into your Azure App Service web applications, check out our documentation here.
If you aren’t already using Datadog, sign up today for a 14-day free trial.


