


Barry Eom

Jordan Obey
AI agents are autonomous or semi-autonomous tools that use large language models (LLMs) to perform tasks and make decisions to achieve specific goals. From customer support to workflow automation, agents can carry out specific responsibilities like generating personalized campaign emails and responding to support questions.
Multi-agentic systems take this a step further by enabling AI agents to collaborate autonomously on complex tasks. Rather than following a fixed sequence, these agents use tools, interpret context, delegate or hand off tasks to other agents, and make decisions based on intermediate outcomes. For example, an AI software assistant might use a planning agent to interpret a GitHub issue, a coding agent to implement it, a testing agent to validate the result, and a PR agent to submit the change. At runtime, agents may run in parallel, retry failed steps, or reason over earlier actions before proceeding, which forms a dynamic decision graph rather than a static workflow.
These systems unlock powerful new capabilities by automating complex, adaptive workflows, but they also introduce new challenges. As agents plan, reason, and hand off—often in parallel, branching out to multiple agents and then merging results—it becomes hard to trace how outcomes are reached. Frameworks like OpenAI’s Agent SDK, LangGraph, and CrewAI simplify development but often abstract away control flow, represent agents differently, and require manual instrumentation to surface meaningful insights.
In this post, we’ll look at the challenges of monitoring agentic systems and how Datadog LLM Observability addresses these challenges with a new visualization approach alongside providing key health and performance telemetry. Specifically, we’ll look at:
- The challenges of monitoring agentic systems
- Visualizing your agentic system’s execution flow
- Measuring and improving the quality and performance of agentic systems
Challenges of monitoring agentic systems
Modern agentic systems are powerful, but understanding what they’re doing under the hood can be deceptively hard. Two core challenges make monitoring these systems especially tricky: instrumentation overhead and the limitations of traditional visualization tools.
Framework diversity and instrumentation overhead
Teams are building agentic systems using a wide variety of frameworks with different abstractions, control patterns, and terminology. Frameworks like OpenAI’s Agent SDK, LangGraph, and CrewAI offer useful building blocks for building agentic systems—delegating tasks, using tools, enforcing guardrails, or retrying failed actions.
While many agents share common primitives—like receiving inputs, invoking tools, making decisions, or returning outputs—the way they’re orchestrated varies widely. One framework may structure execution as a directed graph, while another may follow a role/task hierarchy or planning loop. These differences make it difficult to apply a unified data model across frameworks, even when the underlying behavior is conceptually similar.
The inconsistency of agent behavior across different sessions leads to real challenges for observability. An agent might delegate a task, invoke a tool, or retry a step through internal callbacks that never appear in logs or traces. In addition, agents often maintain internal memory—such as CrewAI’s short-term and long-term memory or LangGraph’s state—which influences their decisions but may not be exposed in standard logs or spans. Without a consistent way to capture these actions across frameworks, teams are left patching visibility together themselves.
To reconstruct what happened, many developers resort to manual instrumentation: wrapping agent logic, injecting trace metadata, or logging internal transitions by hand. It’s tedious, error-prone, and easy to miss key behaviors like fallback chains or tool usage, especially as workflows grow more dynamic.
Visualization gaps in traditional tools
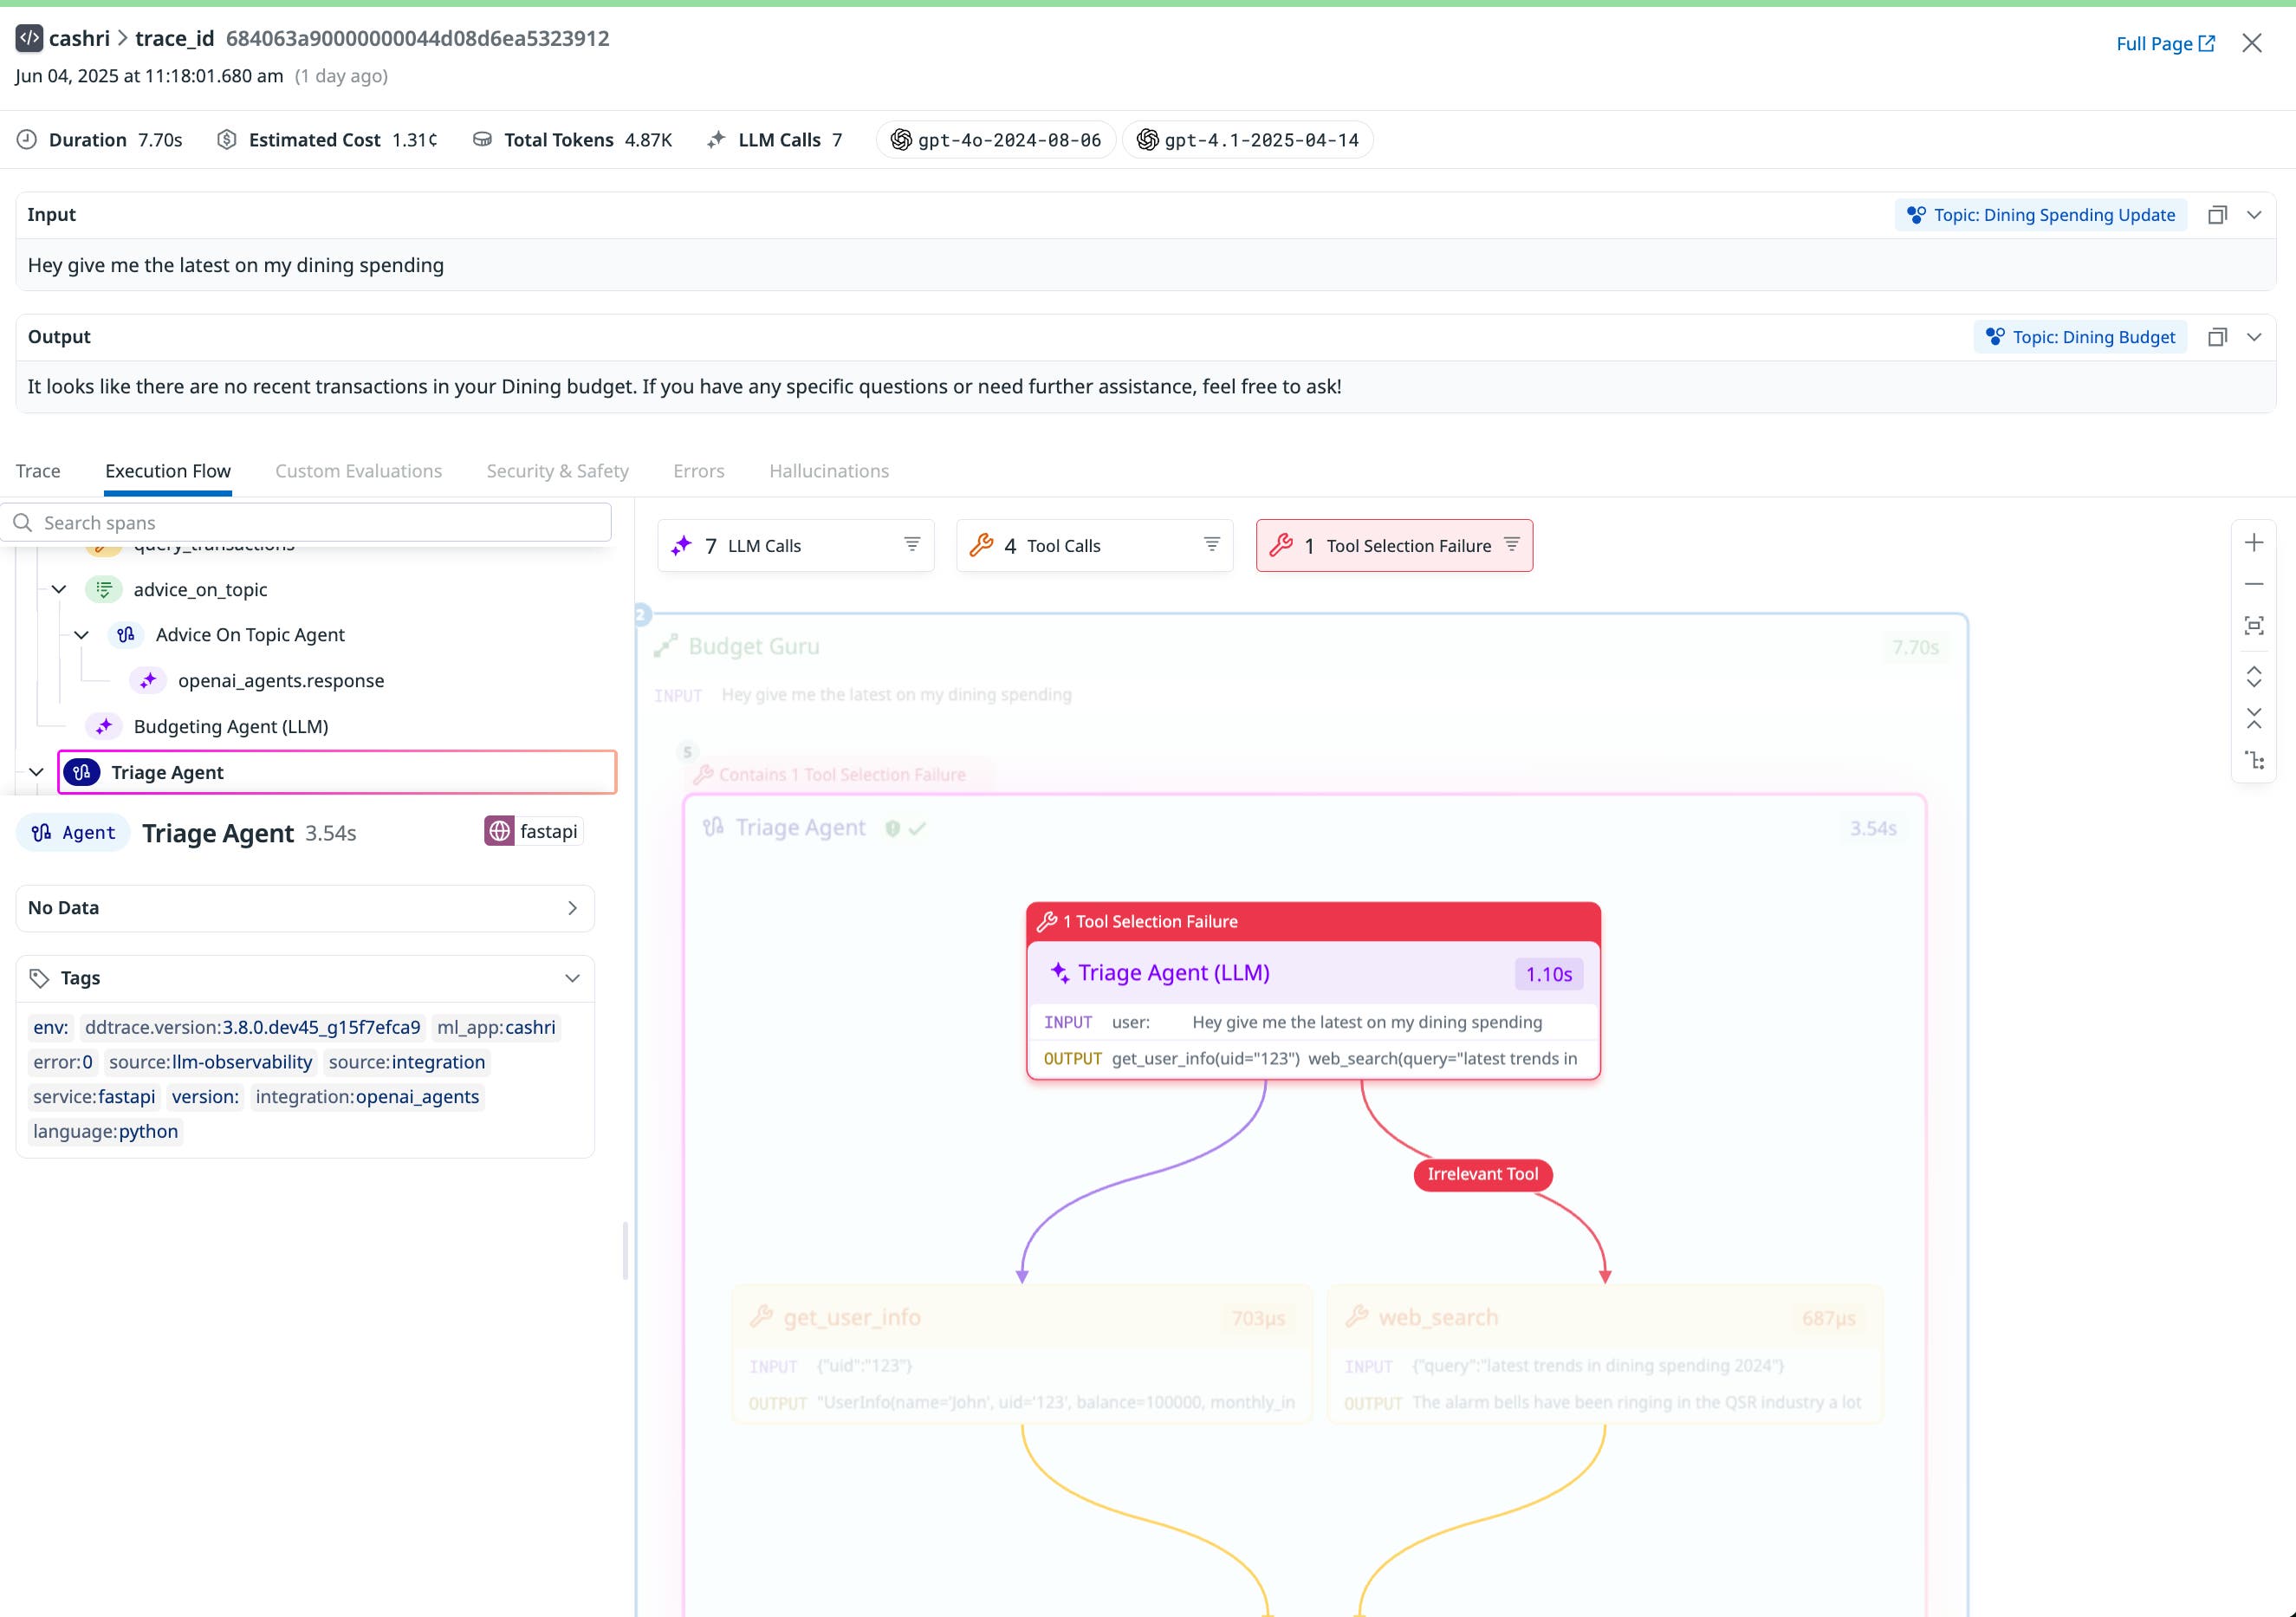
Even when agent behavior is fully instrumented, traditional observability tools often fall short in making that behavior understandable, because many agentic systems are fundamentally nonlinear. Agentic systems often involve orchestrator agents delegating tasks to specialized sub-agents, running agents in parallel, making non-deterministic decisions, and following complex fan-in/fan-out patterns that traditional visualizations struggle to represent. As such, a suboptimal, inaccurate, or erroneous step (e.g., selecting a wrong tool) may compound and cascade, resulting in a wrong output or failure of the entire system.
Without a visualization that matches this execution model, teams are left piecing together what happened from disconnected spans, making it hard to spot where the system went wrong or why an agent made a particular decision. Flame graphs work well for analyzing performance in linear, synchronous systems; they show function calls stacked over time, making it easy to spot latency bottlenecks. But they assume a single call stack, so they can’t easily represent the branching logic, retries, or concurrent agent activity typical of agentic workflows. Span lists offer more structure and detail, but in complex systems with planning steps, parallel agents, and tool calls, they quickly become difficult to navigate due to deep nesting and ambiguous execution paths.
Many agentic systems are fundamentally nonlinear: they involve parallel agent activity, non-deterministic decision making, and complex fan-in/fan-out patterns that traditional visualizations can’t capture. As such, an inaccurate or erroneous step can cascade and cause failures of the entire system. Without a visualization that matches this execution model, teams are left piecing together what happened from disconnected spans, making it hard to spot where the system went wrong or why an agent chose or went down a particular path.
Visualize your agentic system’s execution flow
Datadog LLM Observability gives you a clear, end-to-end view of how agents interact to fulfill a request. LLM Observability captures agentic operations and displays each step in a multi-agent workflow, including which tools agents used, handoffs between agents, retries, and errors, so you can quickly understand how outcomes were produced.
The LLM Observability SDK automatically captures intra- and inter-agent operations including tool usage, LLM calls, memory interactions, and handoffs across supported frameworks. LLM Observability maps LangGraph’s DAG-based flows, CrewAI’s role/task chains, and OpenAI’s planning abstractions to a unified data model, which ensures consistent, interpretable traces no matter how your agentic system is orchestrated. This includes visibility into agent memory states such as CrewAI’s short-term and long-term memory or LangGraph’s state, which can be crucial for understanding decision-making processes.
LLM Observability lets you see exactly how each request moves through your agentic system—from the initial intent all the way to the final response. With a graph-based view of the entire process, you can easily understand what actions the agents take, which tools they use, and how decisions and handoffs are made along the way.
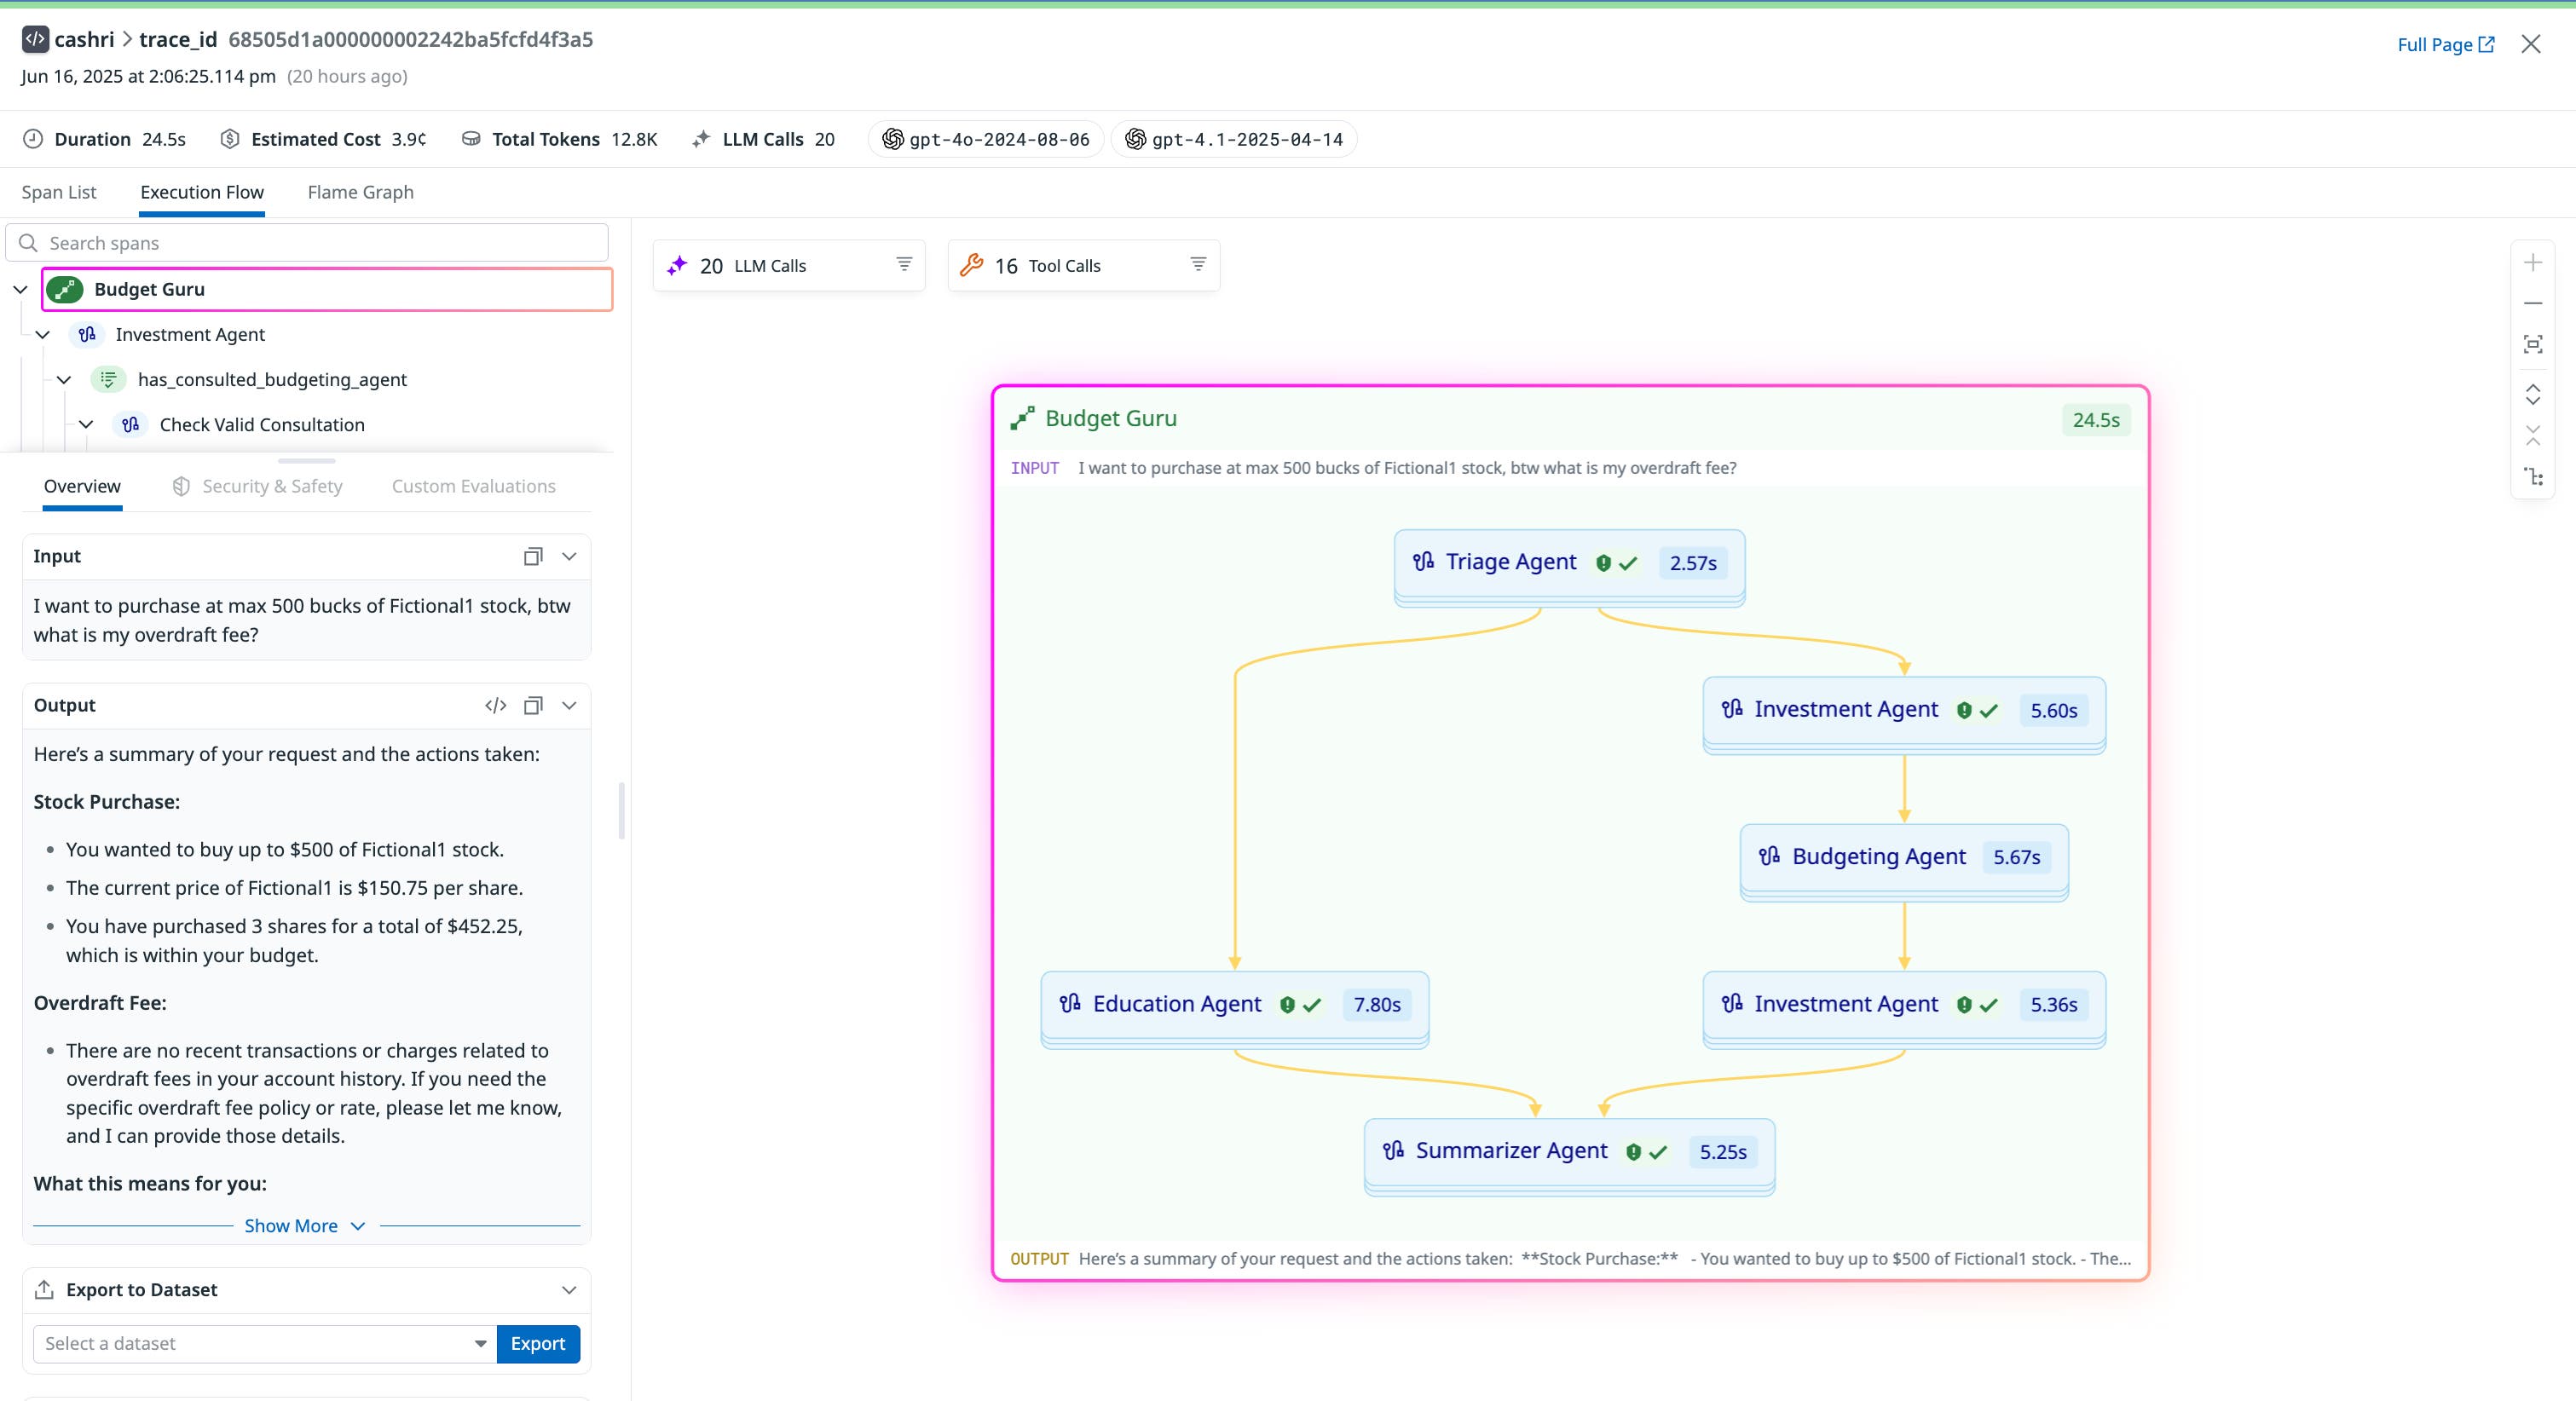
Let’s say your team operates a multi-agent financial assistant called Budget Guru, composed of a triage agent, an education agent, a budgeting agent, an investment agent, and a summarizer agent. When a user submits a query, Datadog LLM Observability captures the full trace of how that query was handled—from initial classification to strategy formulation to investment recommendations. You can inspect the exact decision path taken, which agents were involved, and what actions they performed along the way.
If a trace includes a low-quality output or error, the execution flow lets you immediately answer questions like:
- What did the overall agent flow look like?
- What decisions did each agent make? More specifically, what tools did each agent select and call? Which agent or agents did a given agent hand off a task to?
- Why did the agent make the decision it made at each step? And what information did it have in each of those steps?
- Where did an error occur, and which upstream step might this error have cascaded from?
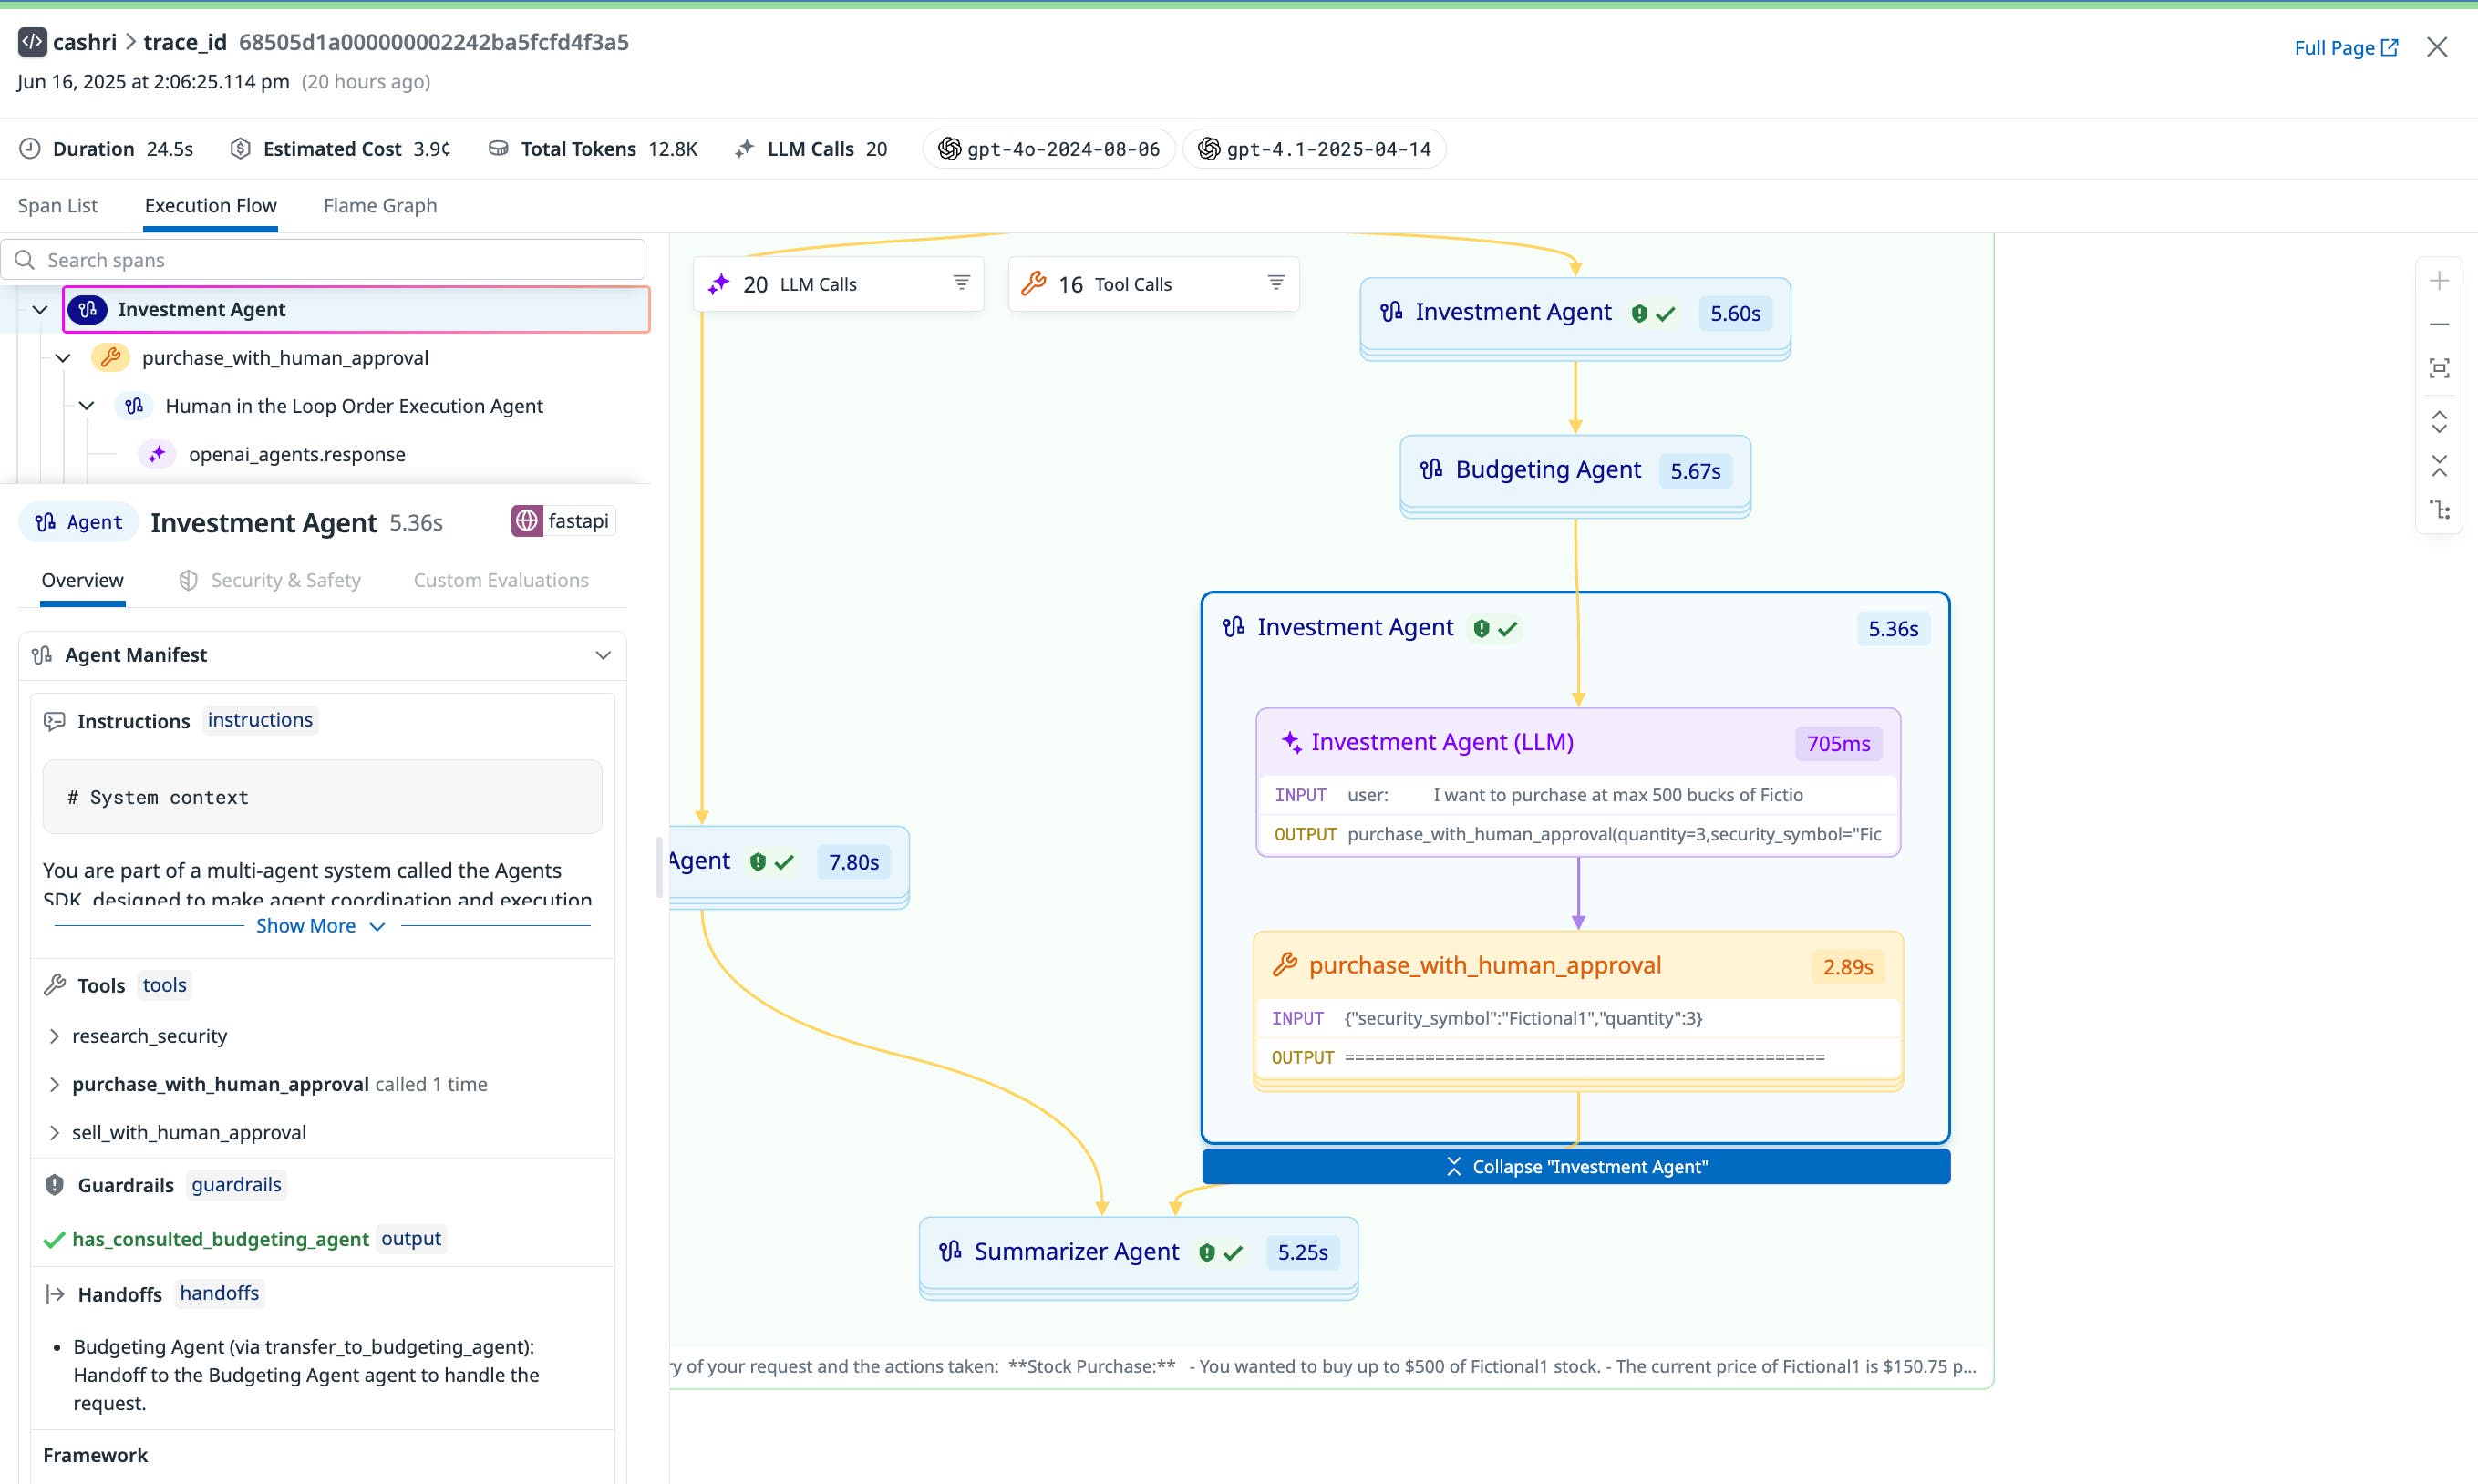
Drilling into each agent reveals insights such as which tools an agent used, execution time, and any errors or retries. For example, clicking into the first Investment Agent shows the first LLM call kicks off three security symbols in parallel. Once those complete, their results are merged and passed into another LLM call, which generates the investment plan.
This interactive UI makes it easy to debug complex behaviors, trace unexpected results, and validate that your agentic system is working as intended without digging through disconnected spans or custom logs.
Measure and improve the quality and performance of agentic systems
Agentic systems don’t always fail in obvious ways. They may produce responses without error but still behave incorrectly by selecting the wrong tool or returning an irrelevant answer. Teams need to track functional correctness, cost, latency, and the behavior of safety mechanisms to ensure quality and efficiency.
Datadog LLM Observability provides deep visibility into how agentic systems perform and behave. You can monitor both hard failures such as exceptions that are thrown when a tool is called, and incorrect behaviors that happen without any error. If your team runs custom evaluations, those can be submitted at the level of individual agent steps or LLM calls. These evaluation results are then visualized directly within each trace, so you can understand how quality varies across decisions and workflows.
Operational metrics are tracked at each step as well. You can measure latency for every agent operation and tool invocation, and pinpoint where where time is being spent. Token usage is broken down across LLM and embedding requests, giving you clear visibility into where costs accumulate. At the system level, LLM Observability groups similar inputs/output by meaning, helping you detect regressions, uncover behavior drift, and spot opportunities for prompt or logic refinement.
By bringing together functional evaluation and operational telemetry, Datadog helps you continuously monitor and improve agentic systems, ensuring they behave reliably, return accurate results, and scale with confidence.
Gain full visibility into your agentic systems
As agentic systems become more sophisticated, visibility into how agents interact, where failures occur, or how workflows evolve over time is crucial. Datadog LLM Observability provides the visibility teams need to confidently build, debug, and scale agentic applications. From easily tracing agentic operations to troubleshooting the execution flow of agentic systems, Datadog helps teams ensure that their agentic systems are healthy and effective.
To start using Datadog LLM Observability to gain visibility into your AI agent workflows, you can sign up for a 14-day free trial to get visibility into your agents built on LangGraph, OpenAI Agents SDK, or CrewAI—or sign up for a preview to visualize the execution flow of your agents today.


