Anshum Garg

Mallory Mooney
Okta is a cloud-based identity management service that provides authentication and authorization tools for your organizations’ employees and users. You can use Okta to incorporate single sign-on, multi-factor authentication, and user management services right into your applications. Okta streamlines your IT workflows with user-friendly dashboards that provide access to all of your organization’s critical applications, and seamlessly integrates with your existing active directory (AD) systems.
Through our latest integration with Okta, you can now collect and monitor your Okta logs, giving you greater visibility into access and lifecycle events from all of your applications and users. With Okta and Datadog, you can proactively detect threats to your applications, track user activity, debug authentication and authorization issues, and create an audit trail for regulatory compliance.
Once you’ve enabled the Okta integration in your Datadog account, you’ll be able to easily search, filter, and alert on all Okta events in Datadog.
Dig into your Okta logs
Okta’s system logs provide critical insights into user activity, categorized by Okta event type. Each of these events represents a specific type of system activity (e.g., login attempt, creating a new user) so you can always be aware of what is occurring in your applications.
You can search on event types and correlate activity with other Okta log attributes such as the event outcome (e.g., SUCCESS or FAILURE), IP address, user name, browser type, and geographic location. Datadog automatically processes and parses your Okta logs, providing you with out-of-the-box facets that you can immediately start using to uncover interesting trends and unusual activity.
In the next few sections, we’ll walk through how you can use Okta log attributes to monitor activity across your applications, such as:
- Administrative access to Okta (i.e., who is provisioning new users or applications)
- User activity (e.g., your top users, user profile changes, and account lockouts)
- Suspicious or unusual activity, including authentication attempts
Monitor administrative access to Okta
Monitoring administrative activity through Okta logs gives you a high-level view of user and application lifecycle events. This enables you to easily see who created, provisioned, or deleted an application or a user, in addition to when it happened. Several Okta event types can help you monitor administrative activity, including:
- When a user accesses Okta’s admin application
- When an administrator updates an application
- When an administrator creates a new user account
For example, you can search for all failed attempts to access Okta’s admin application with the following search:
source:okta @evt.outcome:FAILURE @evt.name:user.session.access_admin_appThis will help you pinpoint who is having trouble accessing Okta’s admin application—or if any unauthorized users are trying to gain access. You can also incorporate wildcards in your searches if you need to find a specific group of administrative events, such as all application or user lifecycle events (e.g., create, delete):
source:okta @evt.name:user.lifecycle.*If you need a high-level view of activity across all of your applications, you can graph all Okta events and group by event outcome.
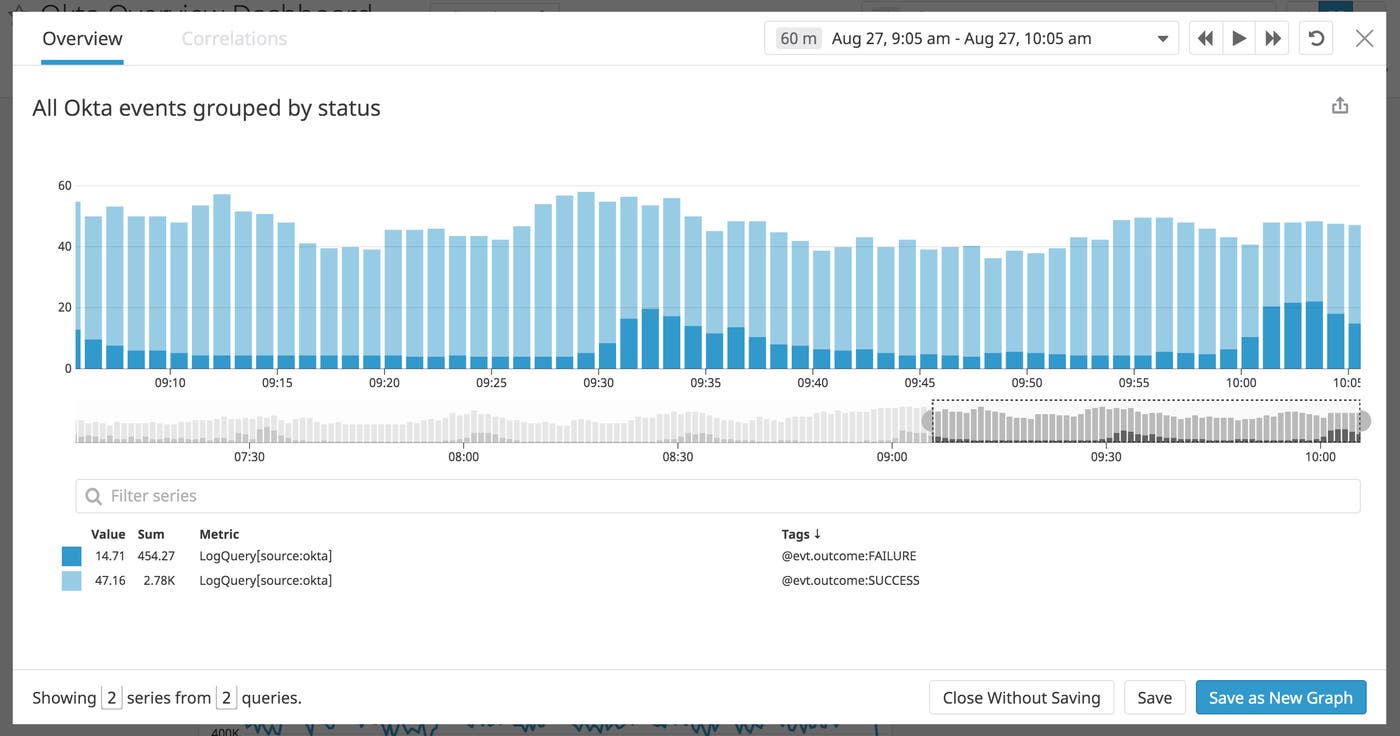
This can help you quickly identify abnormal spikes in failed outcomes for any event. If you want to investigate further, you can click on a datapoint in the graph to pivot to a detailed log view.
Track user activity across your applications
Okta logs also provide details about your users’ activity, enabling you to quickly detect suspicious activity and troubleshoot issues with user accounts. Some key event types you can use to monitor user activity include:
- User authentication attempts
- When a user resets an account password
- When a user gets locked out of an account
- When a client’s request is blocked due to a rule
As with admin events, you can use the event name to quickly search for logs related to a specific user event. For example, if you need to look at data for user logins, you can use the following query:
source:okta @evt.name:user.session.startThese logs also provide critical insights about your users such as their names, IP addresses, and the geographic locations of login attempts. For example, you can search for all activity related to a specific user:
source:okta @usr.name:"Maddie Shepherd"You can also create a top list of IP addresses of your most active users or the most popular browsers used to access Okta. This can help you track and diagnose unusual activity in your applications.
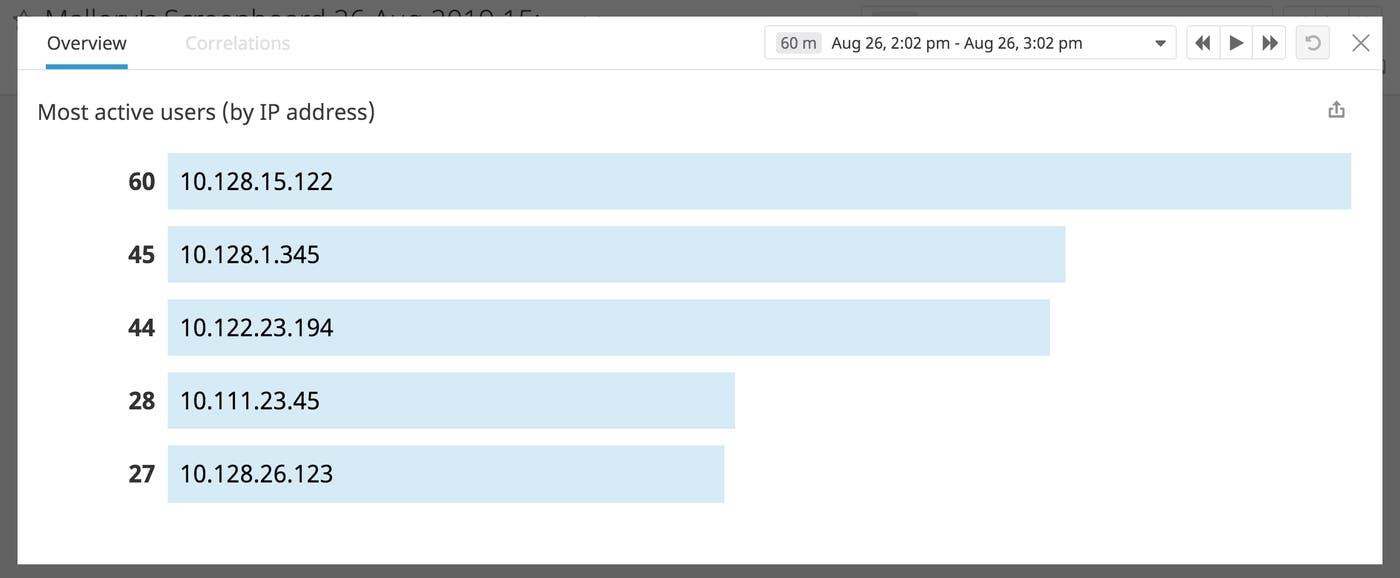
If you notice a spike in login activity for a single IP address, you can quickly search for that specific IP address in your logs to troubleshoot the issue. If the IP address or its geographic location is one that you don’t recognize, you can enhance your system’s security by creating a network zone to exclude that IP address or location, if needed.
Diagnose authentication issues and detect unusual activity
Monitoring your Okta logs with Datadog can also help you gauge the overall health and security of your systems. You can track all authentication attempts and calculate authentication failure rates using Okta’s authentication event types, which include:
- When a user signs into an application with single sign-on
- When a user logs in with multi-factor authentication
Because Okta provides several methods for logging into provisioned applications, you need to ensure that you monitor all of them. For a high-level overview, you can search for all failed authentication attempts:
source:okta @evt.name:user.authentication.* @evt.outcome:FAILUREIn addition to sifting through and analyzing logs, you can generate metrics from Okta log attributes, and use anomaly detection to identify unusual trends. For example, you can generate a metric that tracks failed authentication attempts and create a graph that will show you any anomalies (e.g., unusual spikes) for that metric.

If you use the same metric to create an anomaly alert, Datadog will automatically notify you if it detects an abnormal change, so you can diagnose the issue.
Create an audit trail for regulatory compliance
Not only can you analyze and alert on Okta logs, but you can also archive them for long-term storage and easily create an audit trail for system access. Archiving your Okta logs is crucial for compliance and security audits, since it ensures that you will always be able to access a record of user activity, application access, and permission levels—all of the data you need to comply with industry regulations. If you need to conduct a business, technical, or security audit, you can retrieve a subset of logs from an archive on demand.
Proactively monitor your Okta events with Datadog
With Datadog’s Okta log integration and log analytics, you can derive valuable insights from your Okta events. Enable the integration today to start monitoring Okta logs alongside the rest of your infrastructure. If you don’t already have a Datadog account, you can sign up for a free trial.
