Lily Chen

Sam Brenner

Barry Eom

Will Potts
As teams adopt the Model Context Protocol (MCP) to connect AI agents to external tools and data, understanding how MCP clients behave becomes critical for operating these systems in production. MCP clients, such as agents, gateways, and integrated development environments (IDEs), are responsible for discovering registries, initializing sessions, and invoking tools. These clients are also often where failures or latency surface first. Issues like sessions that never initialize, registries that grow too large to parse, and tool calls that time out or return errors typically originate or become visible at the client layer, even when the MCP server is hosted or managed elsewhere.
To help you observe and understand these client-side behaviors, Datadog LLM Observability now provides complete tracing and monitoring for MCP clients. Automatic instrumentation of the MCP Python client library captures every step—from session initialization to tool listing and invocation—as a span linked to the LLM trace that performed tool selection. With this visibility, your teams can trace client-side registry discovery, tool invocation behavior, and their contribution to overall latency and token usage.
In this post, we’ll show how you can use LLM Observability to:
- Trace the MCP life cycle and pinpoint failures
- Measure how efficiently your MCP clients and agents use MCP servers
- Debug tool invocation errors and latency hotspots of your agents that use MCP servers
Trace the MCP life cycle and pinpoint failures
LLM Observability provides visibility into the full MCP workflow from session setup and registry discovery to tool invocation. You can enable this tracing through the Datadog SDK’s automatic instrumentation, or you can instrument your MCP client manually if you need finer control over what is traced. Each phase is instrumented as an MCP span enriched with metadata such as server name and version, tool parameters, response payloads, and error codes. These spans are automatically linked to the parent LLM span that initiated the tool request, giving you a single trace that reflects the entire agent workflow.
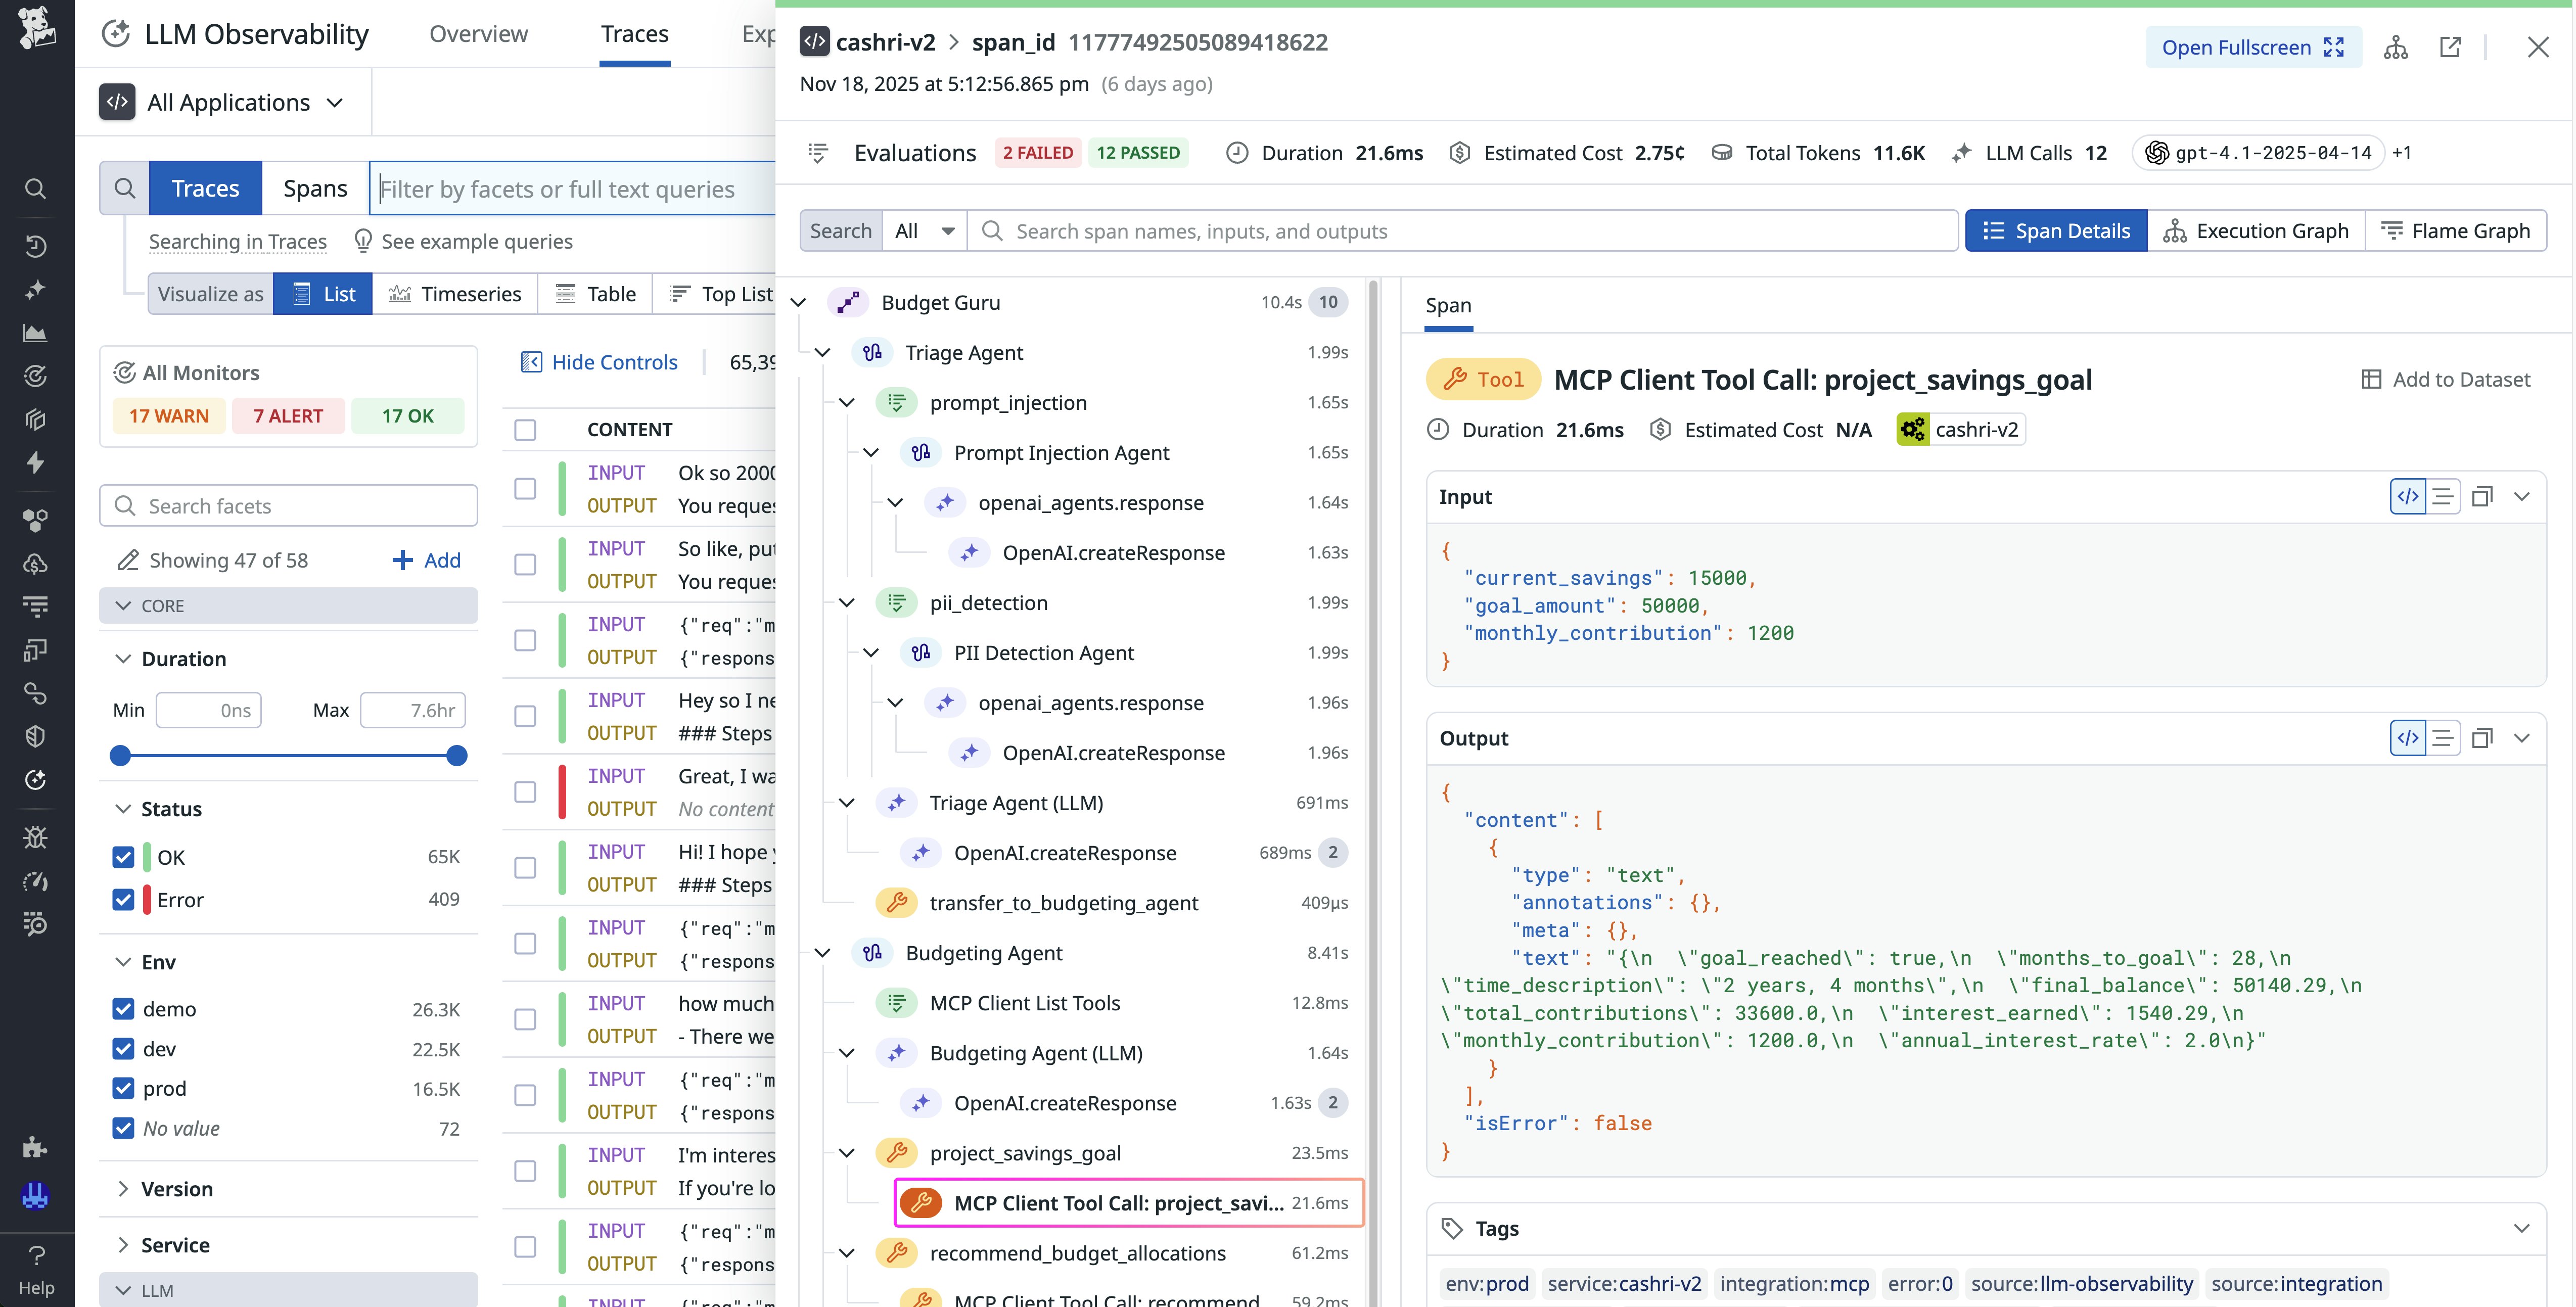
You can view each MCP interaction in sequence:
- Session setup: Includes the
initializecall and capability negotiation to confirm that the client can begin sending requests - Registry discovery: Uses the
tools/listmethod to retrieve a catalog of available tools from the MCP server - Tool invocation: Initiates the
call_toolmethod to use a specific tool for the parameters provided by the agent
If a request fails because of an issue such as a transport timeout, a malformed JSON-RPC call, or an authentication error, the trace highlights the failing span so that you can inspect the request and response payloads and the associated error messages. This level of detail makes it easy to distinguish between network-level issues and logic errors in tool schemas and registry definitions.
With this view of the full life cycle, you can quickly identify slow or unreliable MCP servers, track connection latency across environments, and correlate failures with specific tools or model prompts.
Measure how efficiently MCP clients and agents use MCP servers
Large registries can cause increased latency as LLMs parse tool descriptions during selection. LLM Observability now shows latency for MCP-related operations to help you assess the performance cost of registry bloat and inefficient selection logic.
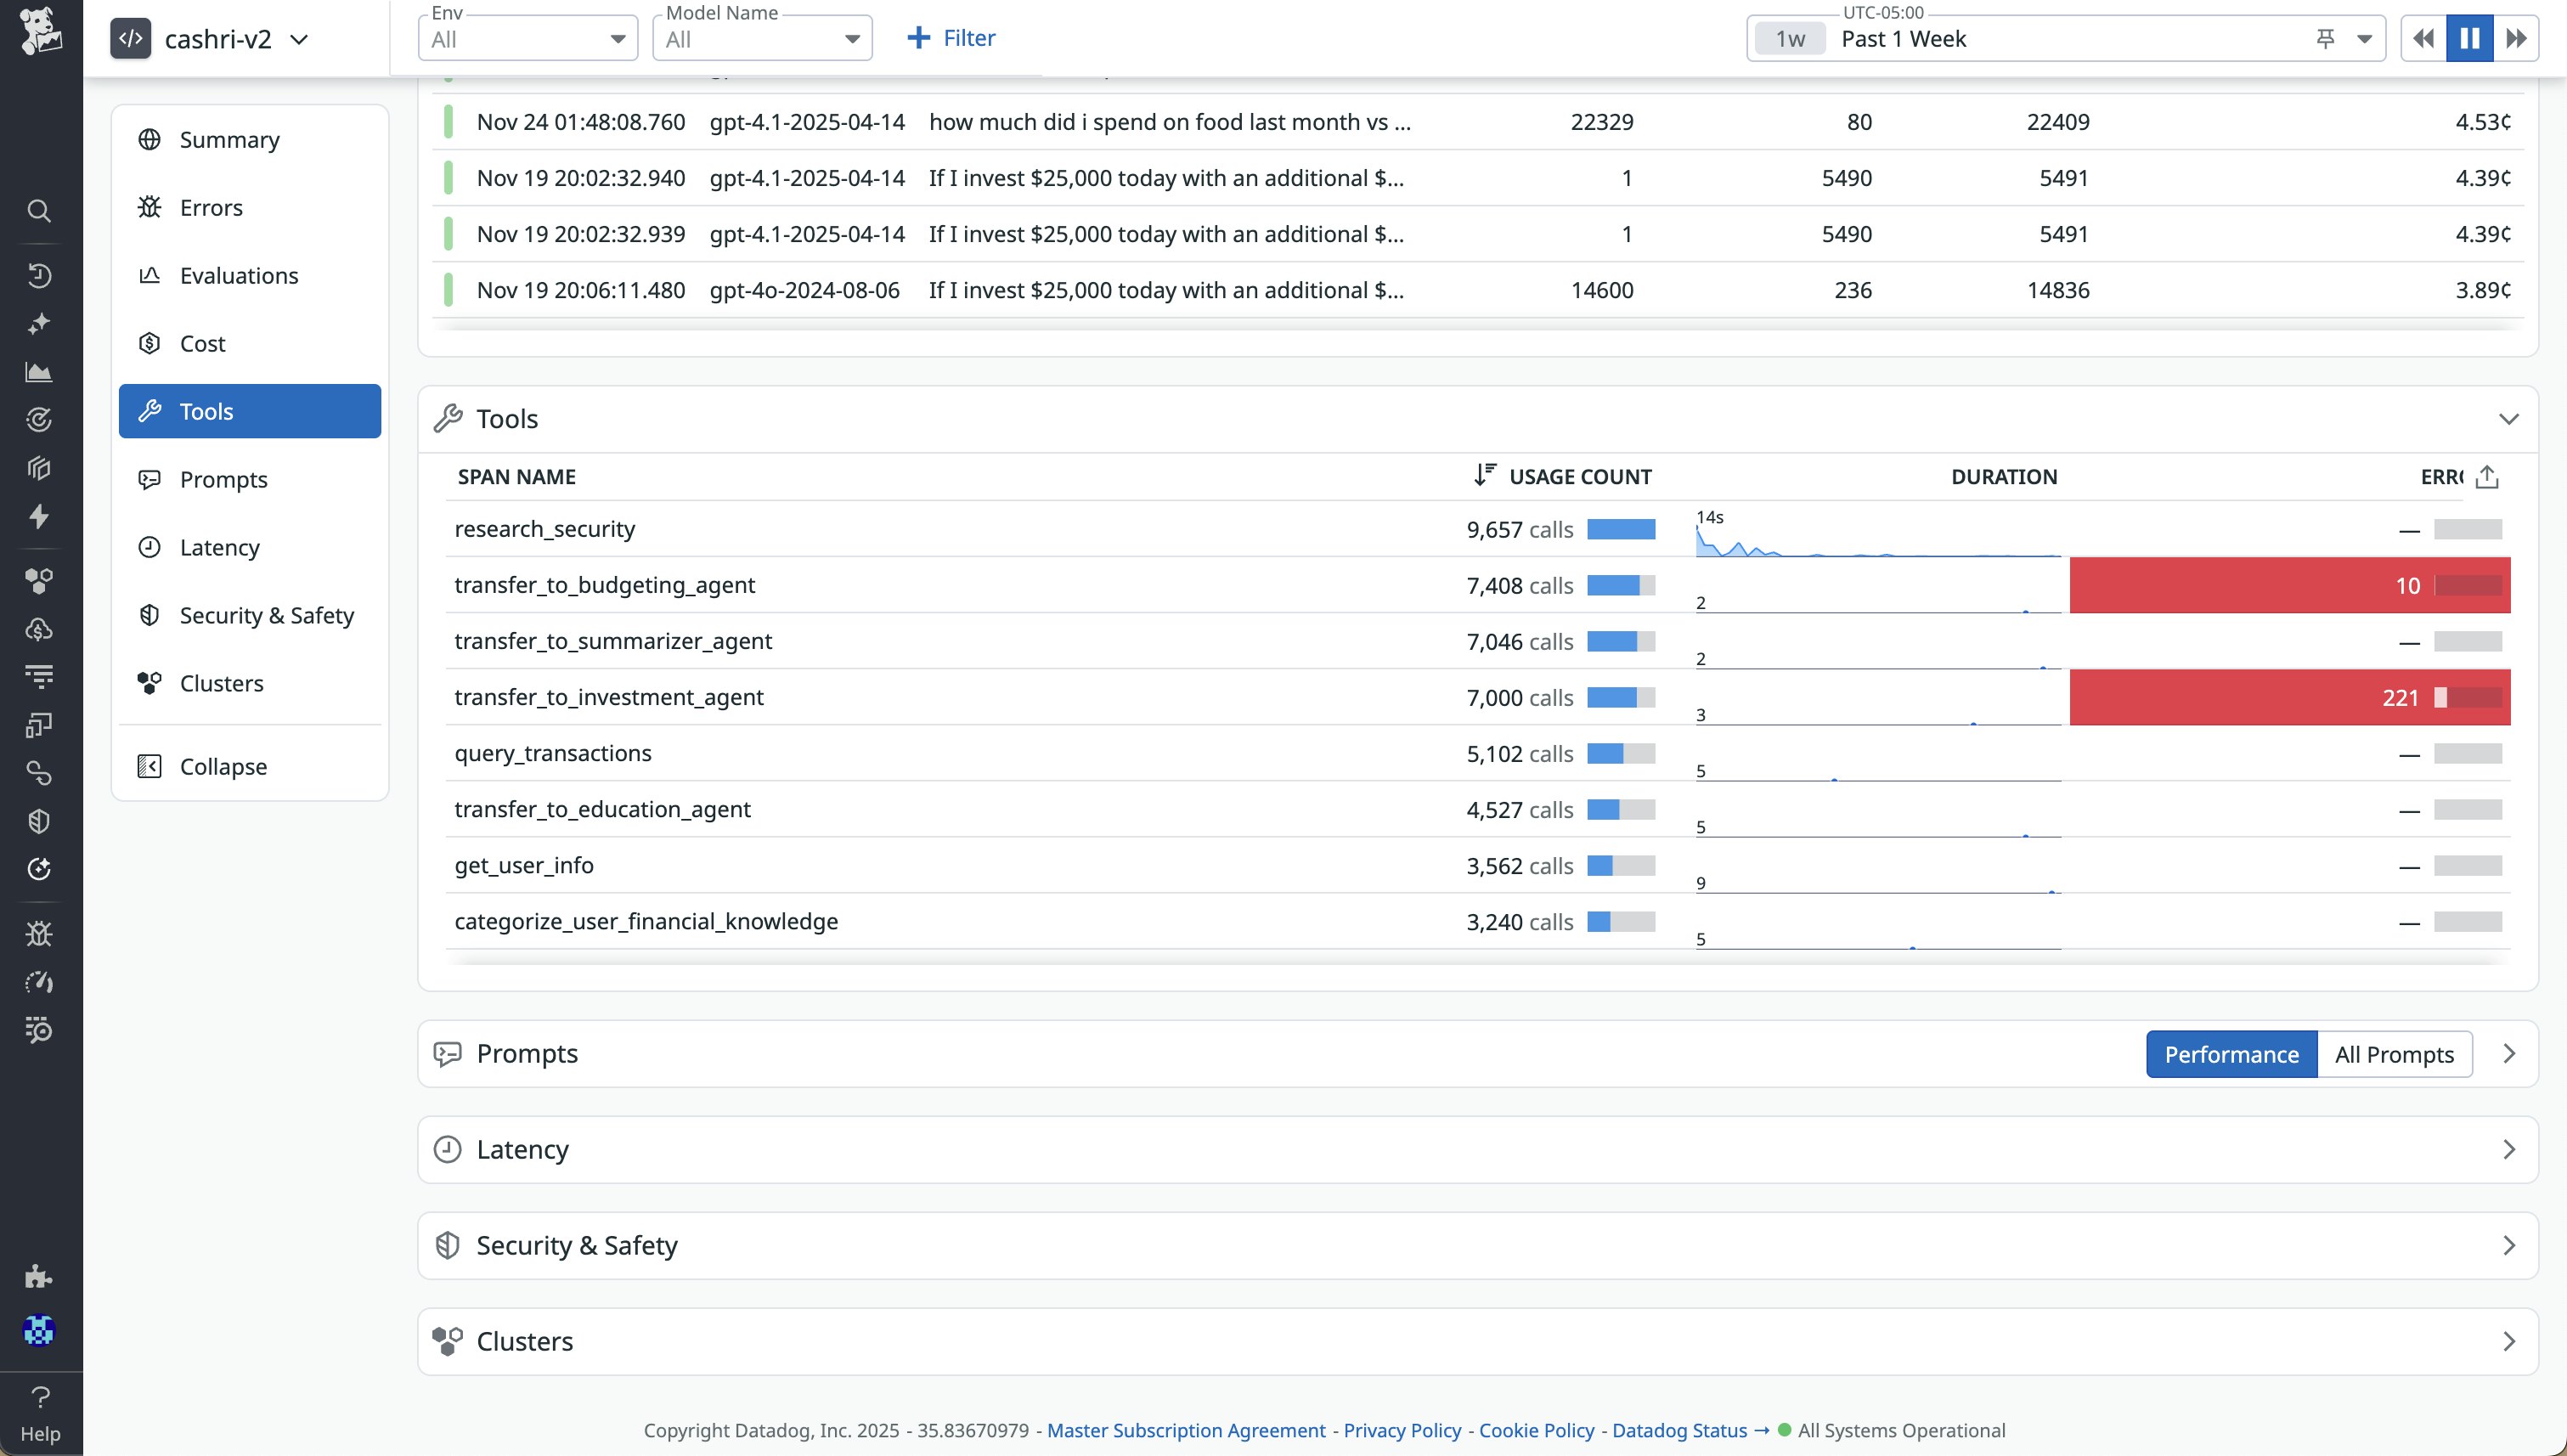
LLM Observability aggregates MCP span data to provide metrics such as:
- Average and p95 latency for
tools/listandcall_toolcalls - Error rates and retries per tool and MCP server
- Tool count and selection duration across applications and agents
These insights enable engineers to compare the efficiency of MCP clients, identify tools that contribute to higher latency, and tune registry configurations.
Your teams can filter traces by MCP server name to visualize usage trends and correlate registry changes with LLM prompt performance. These views bring MCP activity into the same observability workflows that you already use, so you can analyze performance data in context rather than switching between separate tools.
Debug tool invocation errors and latency hotspots of agents that use MCP servers
When a tool call fails or runs slowly, Datadog traces expose the details that help you understand why. Each call_tool span includes structured metadata about the invoked tool, its parameters, and its response, along with the LLM context that triggered it.
The trace captures each operation of the MCP client and server life cycle: the initial model invocation, the LLM’s decision to call a tool, the client forwarding the JSON-RPC tool call to the server, the server executing the callable (or resource fetch) tools to return the result, and the LLM processing that result. Full visibility into this sequence helps you identify issues like registry-driven token usage, latency buildup, and errors. You can inspect JSON-RPC error codes, response payloads, and server logs directly within the span view.
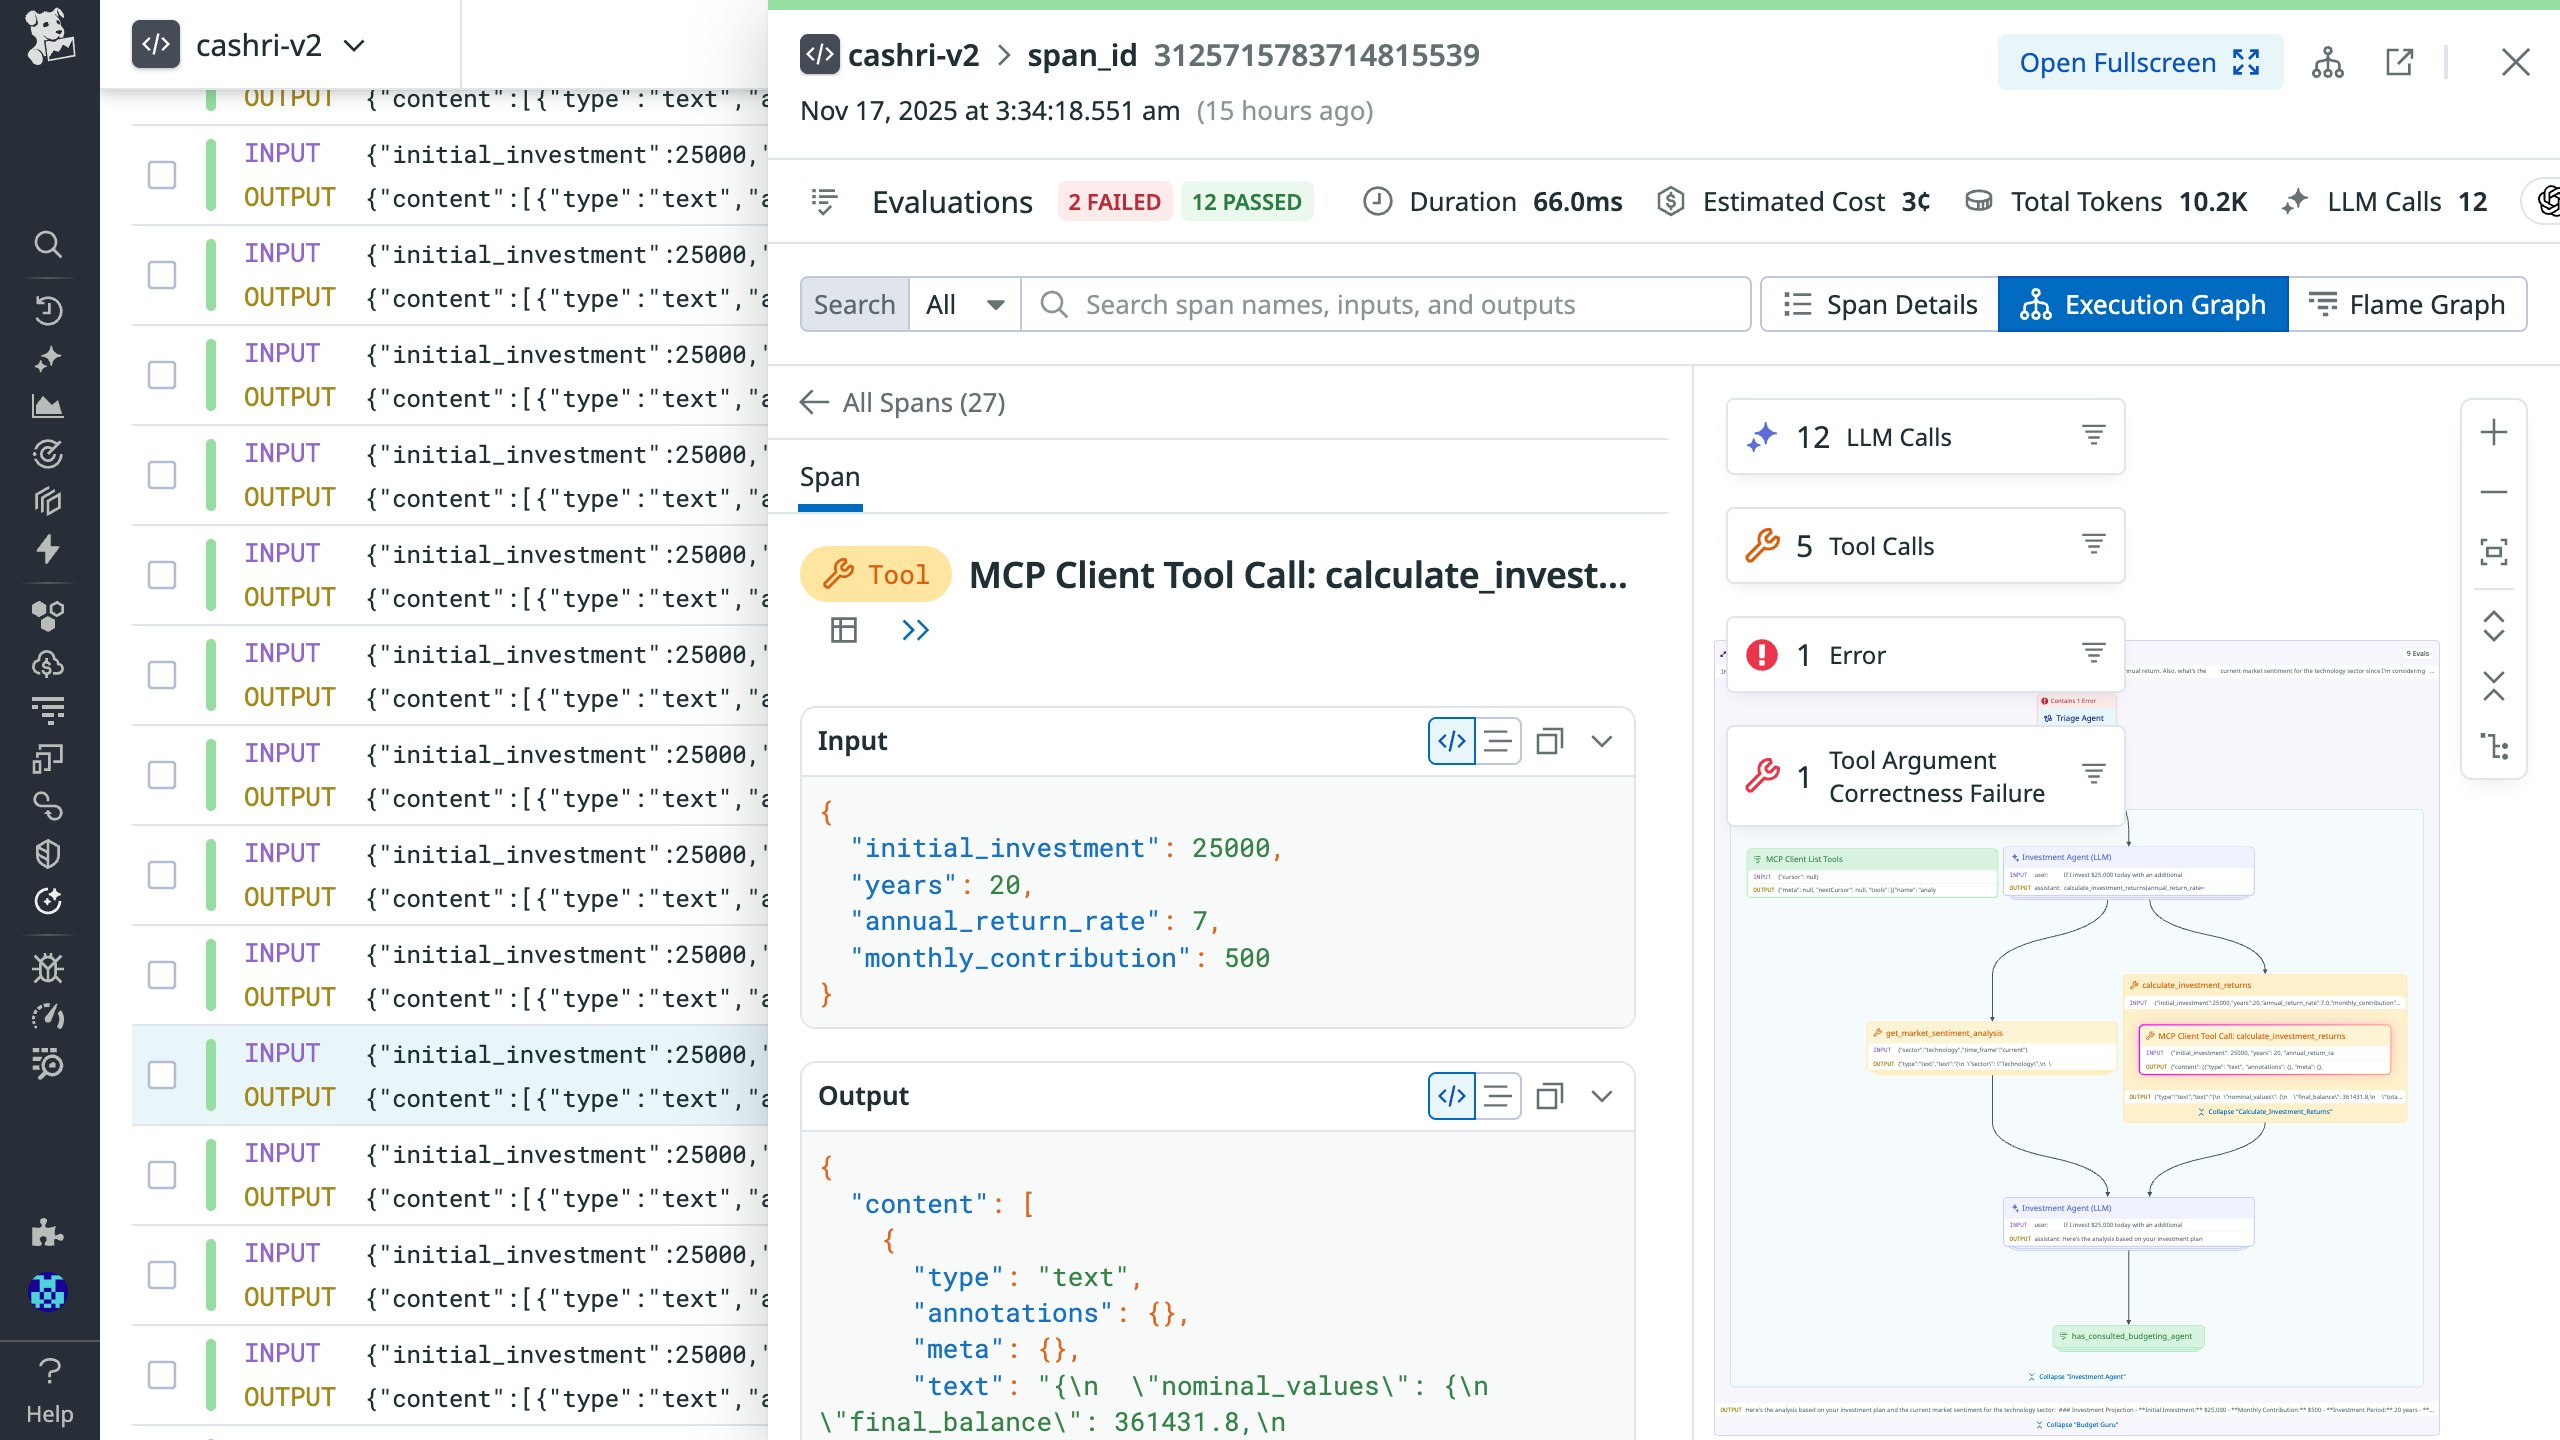
LLM Observability automatically aggregates invocations and latency metrics by tool, so you can spot recurring failures or identify the slowest endpoints. You can also integrate this data into your existing Datadog dashboards and monitors to visualize MCP-specific reliability key performance indicators, such as tool error rates, p95 invocation latency, and timeout trends across environments.
Improve agent performance with MCP-aware observability
By tracing every MCP client interaction alongside LLM spans, LLM Observability provides comprehensive visibility into the reliability, cost contributors, and efficiency of AI agent workflows. Engineers can quantify how registry size, tool behavior, and server performance affect latency and token usage, and they can use this insight to refine registry configurations and optimize prompt logic. This understanding of the MCP client life cycle helps you resolve issues faster, reduce unnecessary tool invocations, and scale production workloads that rely on MCP integrations.
To learn more, check out the LLM Observability documentation for MCP client monitoring. If you don’t already have a Datadog account, you can sign up for a 14-day free trial.
