Mallory Mooney
In a previous post, we walked through how you can configure logging for Rails applications, create custom logs, and use Lograge to convert the standard Rails log output into a more digestible JSON format. In this post, we will show how you can forward these application logs to Datadog and keep track of application behavior with faceted log search and analytics, custom processing pipelines, and log-based alerting.
Set up Datadog to collect application logs
In order to collect logs from your Rails application, you will need to install the Datadog Agent on your host. The installation step requires an API key that can be found in your Datadog account. If you don’t yet have a Datadog account, you can start a free trial.
Run the following script to install the Agent:
DD_API_KEY=<API_KEY> DD_AGENT_MAJOR_VERSION=7 bash -c "$(curl -L https://raw.githubusercontent.com/DataDog/datadog-agent/master/cmd/agent/install_script.sh)"Next, create a new directory and YAML file in the Agent’s conf.d directory to store the configuration necessary to set up Rails log collection:
cd /etc/datadog-agent/conf.d/mkdir ruby.dtouch ruby.d/conf.yamlIn the ruby.d/conf.yaml file, add the following snippet, providing the path to the Rails log file you want to tail:
# Log Informationlogs: - type: file path: /path/to/app/log/development.log source: ruby service: rails-appWe recommend setting the source parameter to ruby for your Rails logs and the service parameter to the name of your application. The source parameter instructs Datadog to install the built-in Ruby pipeline and integration facets so you can easily search for and customize all of your application logs. The service parameter links your logs to correlated data from the same service in Datadog, such as request traces and application performance metrics in Datadog APM.
Restart the Agent and check on its status with the following commands:
sudo service datadog-agent restartsudo datadog-agent statusThe status command will show the following output if the Agent is able to tail your application logs successfully:
==========Logs Agent==========ruby ---- Type: file Path: /path/to/app/log/development.log Status: OK Inputs: /path/to/app/log/development.logExplore your logs
You should see logs from your Rails application appear in the Log Explorer as they are generated. Datadog reserves some attributes, like date and status, and turns them into facets. With facets, you can easily search and explore logs in the Log Explorer. You can even create new facets from other attributes in your logs. This enables you to search and filter by any attribute you care about, drilling down to the logs you need in seconds. To create a new facet, click on an attribute from an individual log and choose Create facet. The example below shows creating a facet for an application controller:
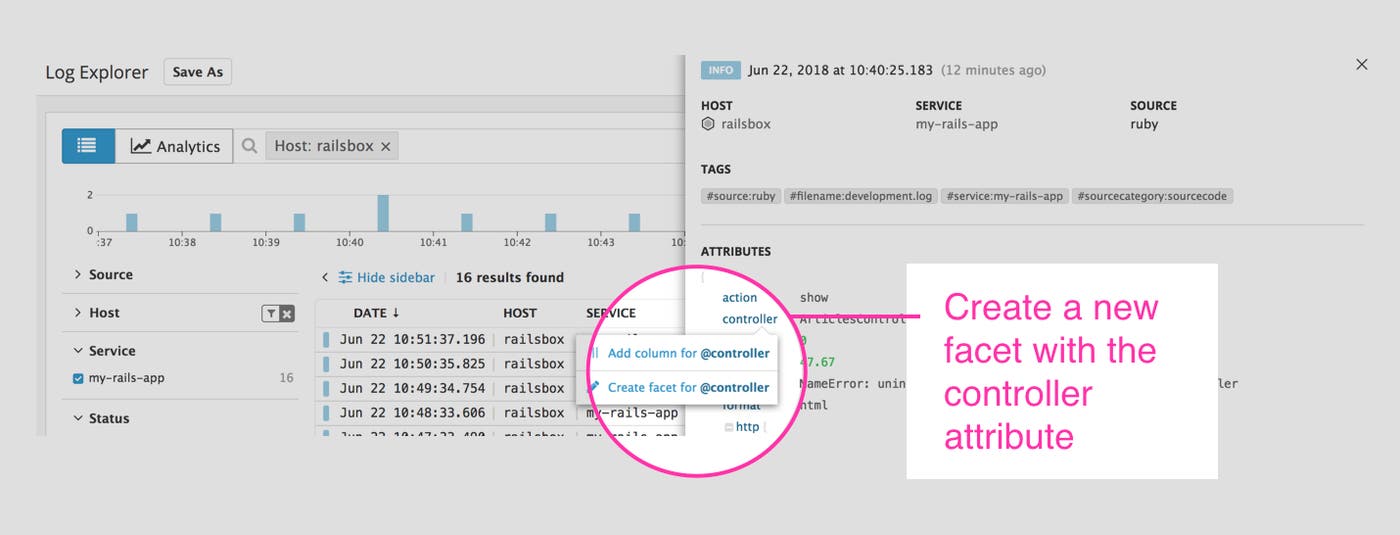
To perform a search based on that new facet, simply use @controller: controller_name in the search bar and Datadog will retrieve all logs with the controller name you specify.

Facets enable you to search and filter your logs using structured data, making it easier to pinpoint issues from a specific area of your application. You can also create measures from numerical data points in your logs. Measures are log metrics you can graph and aggregate with Log Analytics.
Log processing pipelines
When you configure the Agent to collect logs, Datadog automatically installs and enables an integration pipeline based on your specified log source. The Ruby pipeline is designed to capture and parse standard Ruby logs as well as to enhance logs in JSON format.
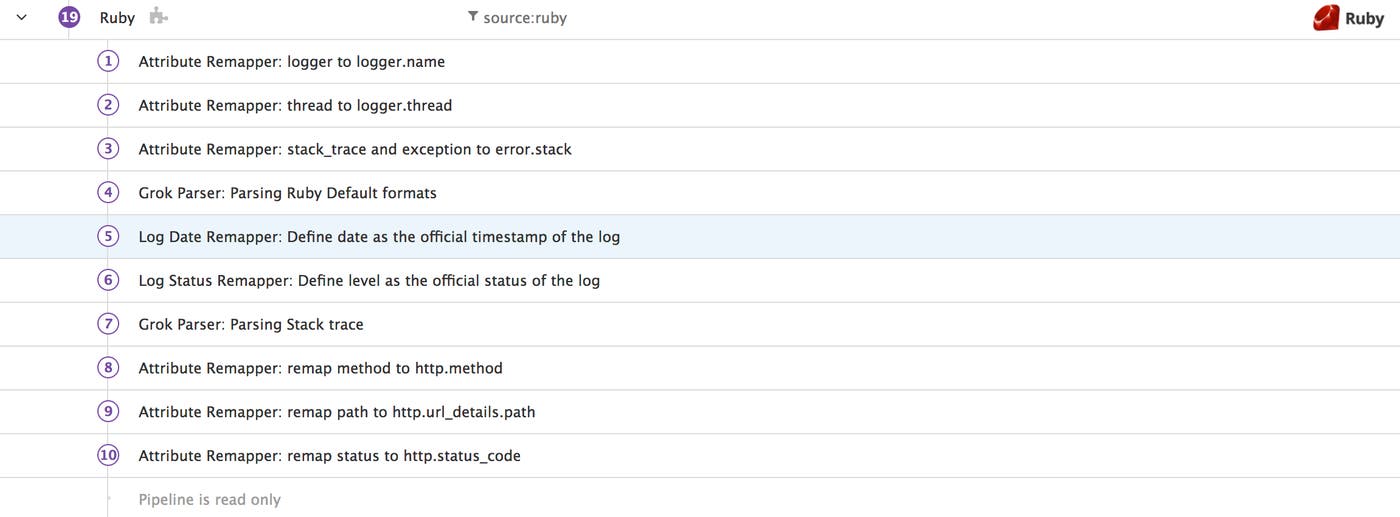
This pipeline captures the status attribute in your JSON logs and remaps it to http.status_code. It also includes a Log Status Remapper that sets the status of a log (e.g., Info, Warn, Error) based on a level attribute. If you customized your Lograge logs to include that attribute, as detailed in the previous post, Datadog will automatically set the appropriate level for the log, making it easier to determine the severity of events being logged in your application.

With integration pipelines, you can begin parsing your logs with minimal setup. Check out our list of integrations to see all available log sources. If an integration is not yet available, or you need to modify a standard pipeline, you can create new processing pipelines to customize how Datadog parses your logs.
Enhance logs with a custom pipeline
Custom processing pipelines allow you to create your own processing rules or edit those created for existing integrations. For example, the out-of-the-box Ruby pipeline includes an Attribute Remapper for capturing application errors and stack traces. This creates an Error Stack section in your processed logs that includes stack traces or exceptions generated by your application. By default, the pipeline is configured to look for an exception or stack_trace attribute. However, a Rails application may not use those attributes for capturing errors if one of its libraries creates its own attribute for logging. Lograge, for example, uses the error attribute by default:
{ "method":"GET", "path":"/articles/11", "format":"html", "controller":"ArticlesController", "action":"show", "status":500, "error":"NameError: uninitialized constant ArticlesController::Article", "duration":34.72, "view":0.0, "db":0.0, "params":{ "controller":"articles", "action":"show", "id":"11" }, "level":"ERROR"}You can modify the Ruby log pipeline in Datadog to include the value of that error attribute with the appropriate attribute remapper. In order to edit a processor, you will need to clone the Ruby pipeline, since pipelines installed by the Agent are read-only. Navigate to your pipeline list and click on the “Clone” button for the Ruby pipeline.

This will disable the out-of-the-box Ruby pipeline automatically. Enable your new pipeline and edit the processor that remaps exceptions and stack traces to include the error attribute.
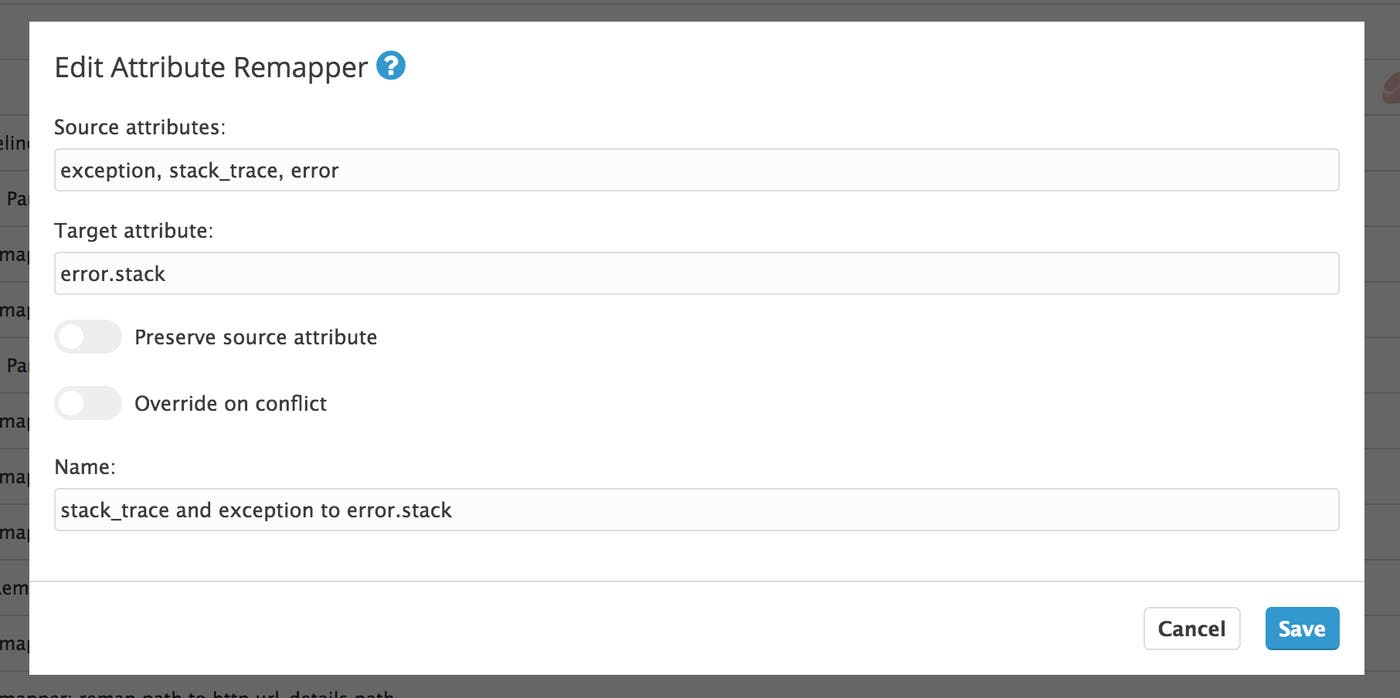
After you save the processor, Datadog will automatically apply this rule to new logs. Now when the application generates an error log, you will see the log’s error message in the Error Stack message column.
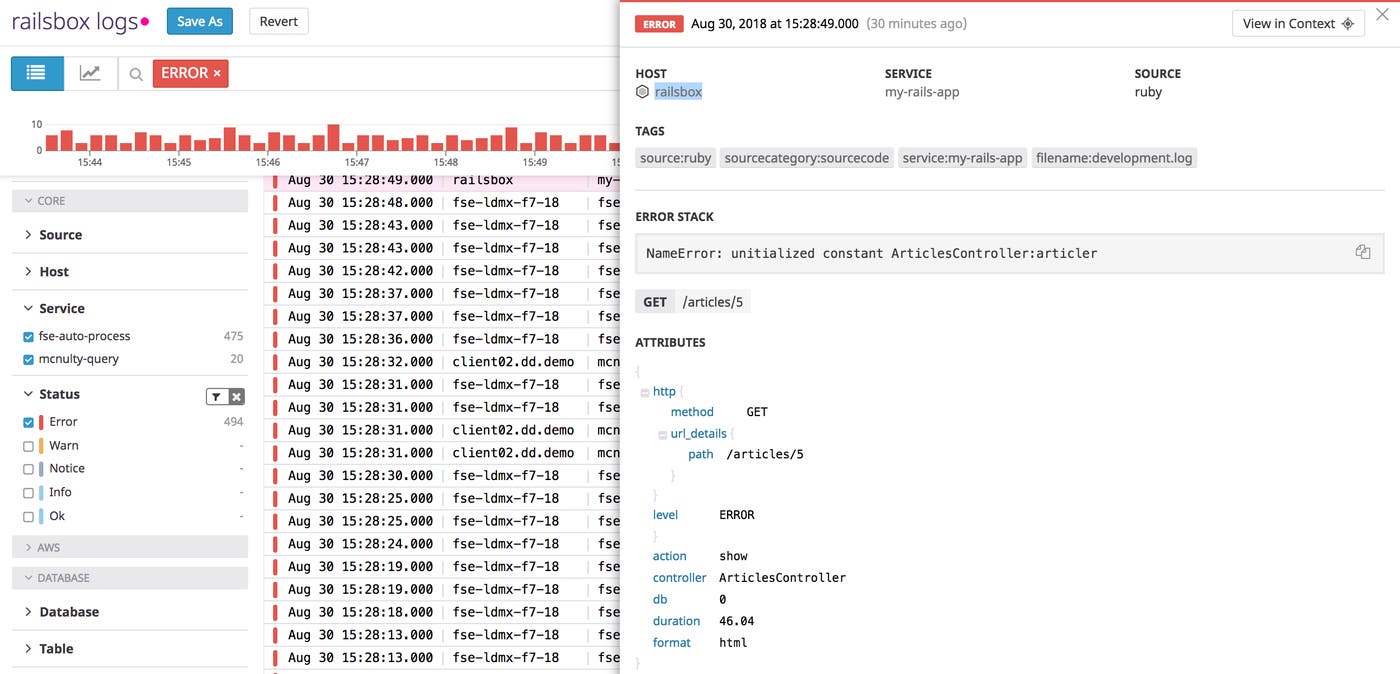
This is a simple example of modifying a pipeline processor, but pipelines give you more control over log customization by including several parsing options (e.g., Grok Parser and URL Parser) and remappers for log dates, severity, and attributes. You can learn more about modifying processing pipelines in our documentation.
Set up alerting for your logs
If you need to know when specific events occur within your application, such as when the number of error logs reach a certain threshold, you can create a new alert based on attributes from your processed logs. For example, you can get alerted when your application generates and logs a certain number of 500 errors, or when a server’s response time surpasses a certain threshold.
To create a new alert, navigate to the monitor page. The first section includes a search bar where you can query the type of log you want to monitor. For error logs generated by your Rails application, you can search by your host (e.g.,host:railsbox) and status:error. You will see the search results update as you build your query so you can confirm you are selecting the logs you want to monitor.
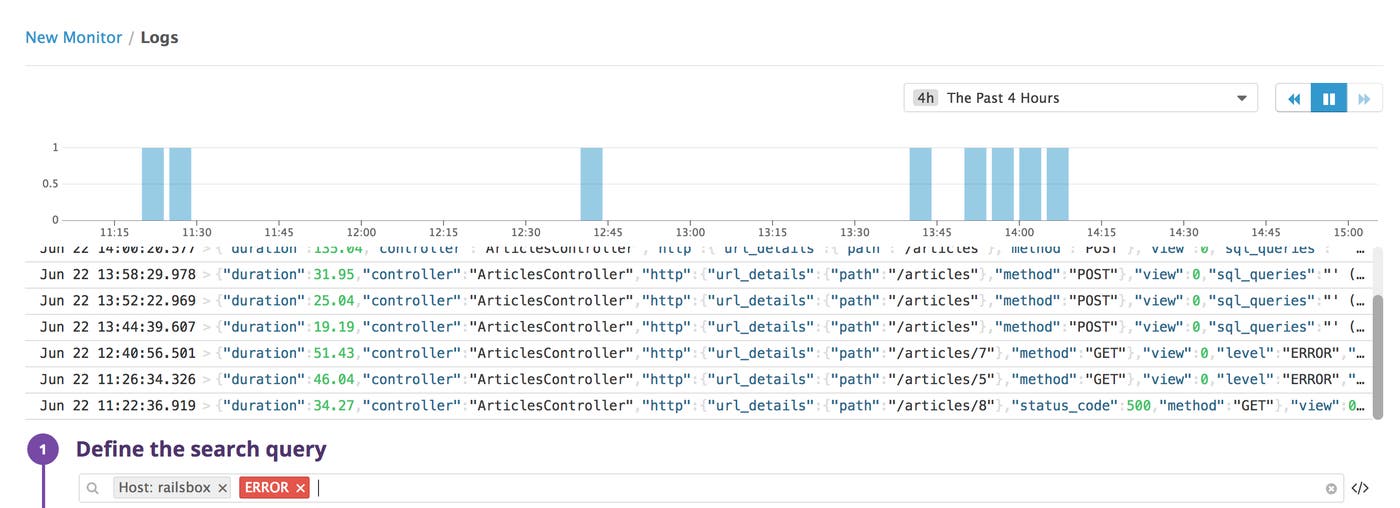
In the following two sections, you can set conditions for triggering the alert and create a message for notifying team members. The condition section includes fields for setting both alert and warning thresholds, so you can create appropriate notifications depending on the severity of the issue.
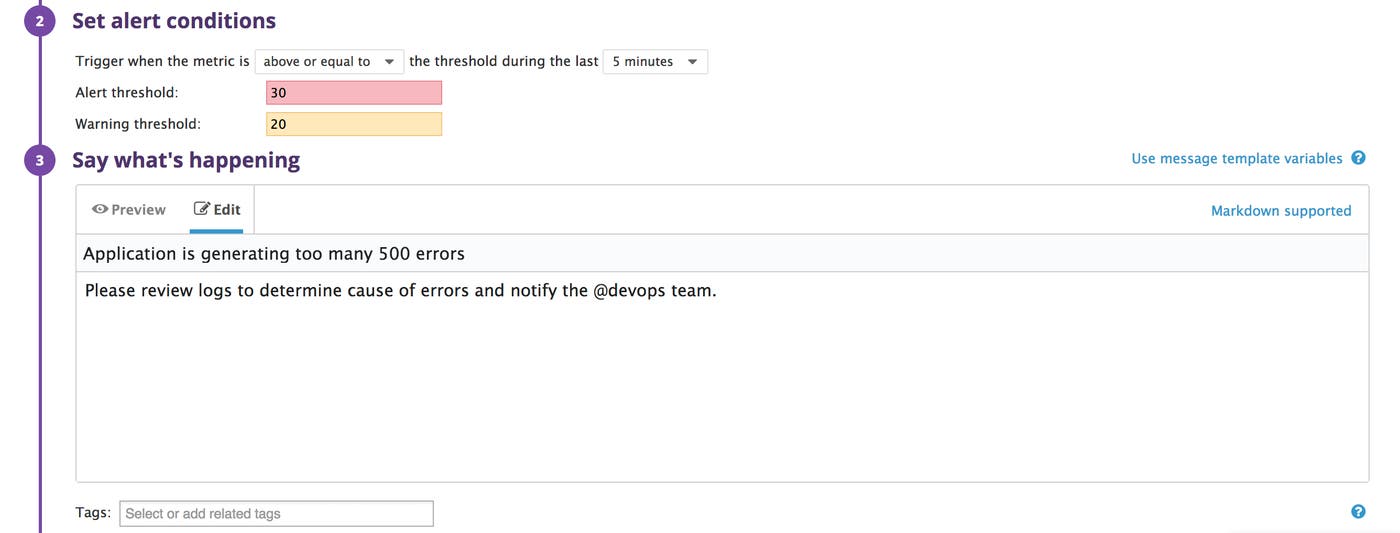
The notification you create should include any relevant information needed to resolve the issue. This could be troubleshooting steps or specific commands to run on a server. Read our docs for more information on customizing your alert notifications. The last section of the creation process lets you specify any individual, team, or communication channel that should receive alert notifications.
Get started monitoring your Rails application
You can collect, manage, and monitor your Rails application logs in one place with Datadog’s log management tools and built-in Ruby integration. Datadog also supports 1,000+ other integrations so you can correlate data from your Rails apps with logs and metrics from every part of your infrastructure. Moreover, for a more complete picture of your Rails environment, you can monitor infrastructure metrics from your hosts, databases, and web servers, along with the logs and request traces from the Rails application itself. Read our guide to Rails monitoring with Datadog to learn more.
To start collecting, monitoring, and analyzing your Rails application logs, sign up for a free Datadog trial. If you’re already using Datadog, see our documentation for more information about Datadog log management.

