Thomas Sobolik

Pranay Kamat
Modern, high-scale applications can generate hundreds of millions of logs per day. Each log provides point-in-time insights into the state of the services and systems that emitted it. But logs are not created in isolation. Each log event represents a small, sequential step in a larger story, such as a user request, database restart process, or CI/CD pipeline. As applications become more complex, effective root cause analysis depends on the ability to view your logs within the larger context of an intricate, distributed system.
In practice, grouping your logs to form broader insights often requires a lot of contextual knowledge about the complicated mesh of services that make up your application. Manually piecing together relevant logs from each of these services is difficult and time-consuming. To solve this, we’ve developed Transaction Queries, which simplifies the process of aggregating logs according to shared attributes to expose the context and calculate key metrics for particular processes or user journeys.
Create end-to-end context from your logs
Transaction Queries offer a unique method of log aggregation that provides valuable insight for a variety of use cases, such as e-commerce data, web user activity, financial transactions, authentication sessions, and CI/CD pipelines. Using a Transaction Query, you can group together log events from across your stack according to shared attributes to form a “transaction.” For example, using payment ID or order ID as a common attribute, you could aggregate logs from an e-commerce app into transactions and quickly answer key questions, such as:
- How many orders were successfully initiated during the previous 12 hours?
- How many transactions threw errors, and where in the process?
- How many transactions took the user more than 10 minutes to complete?
Transaction Queries also allow you to define custom boundaries for your transactions by setting start and end conditions based on queries of log messages. This enables you to produce precise log groupings that are more meaningful and easier for stakeholders to understand. For example, let’s say you’re investigating potential issues in your app’s payment service. You can group logs by customer ID to form transactions that detail each customer’s transaction history, and then add a start condition of the payment service being invoked and an end condition of an error in that service. This surfaces failed transactions across all customer sessions so you can easily investigate them.
Harness Transaction Queries for efficient troubleshooting
Transaction Queries are formed using a primary identifier and, optionally, a set of boundary conditions. Datadog creates transactions by grouping together all the logs that share the same primary identifier value. Because transactions are generated at query time, Datadog automatically calculates performance indicators like duration and max severity then as well. Any operators that you add to the query will surface more detail about the transactions report, such as the count of logs that contain unique values for a particular facet (users, for example) or the p95 of a useful metric (such as page load time).
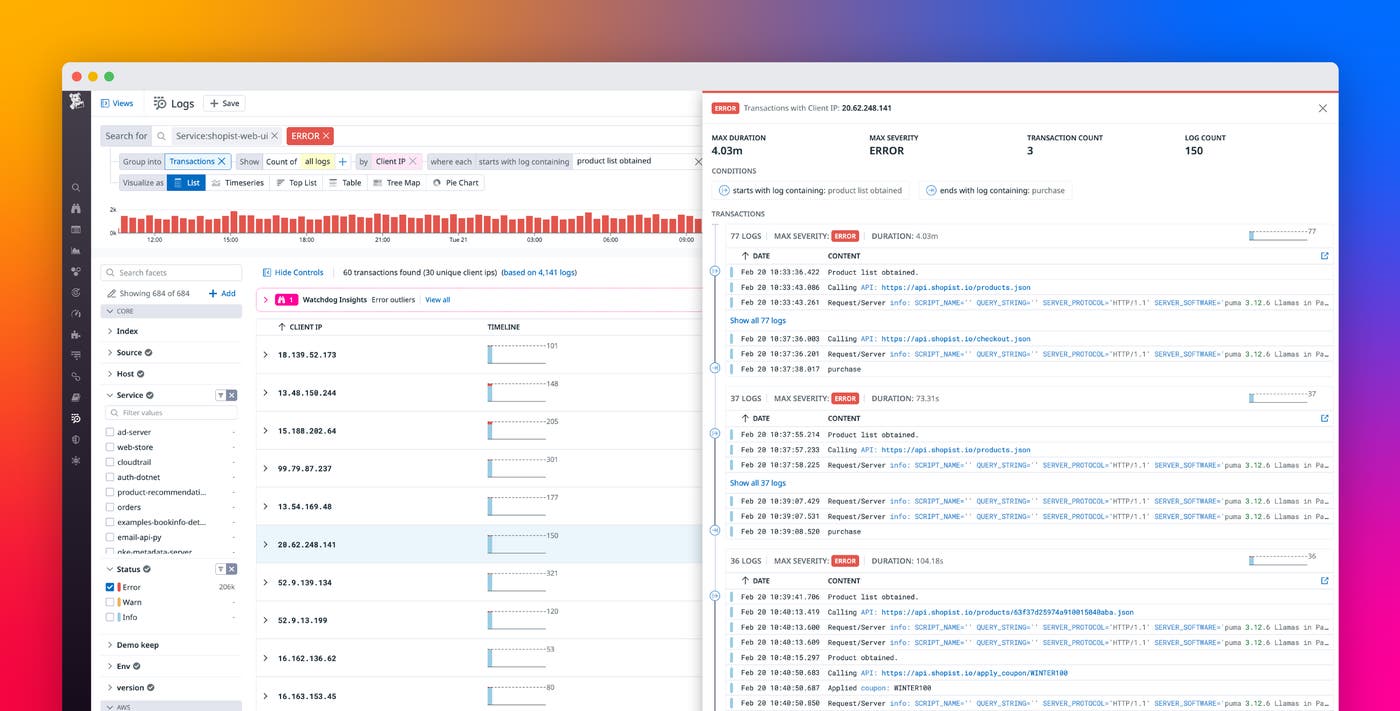
The resulting table provides the queried values for each transaction grouping, as well as out-of-the-box calculations of the count of log events, duration of the full transaction (the time elapsed between the earliest and latest log events), and the max severity, which indicates whether transactions contain errors. These metrics help you quickly spot transactions where problems such as high-severity errors or latency are occurring.
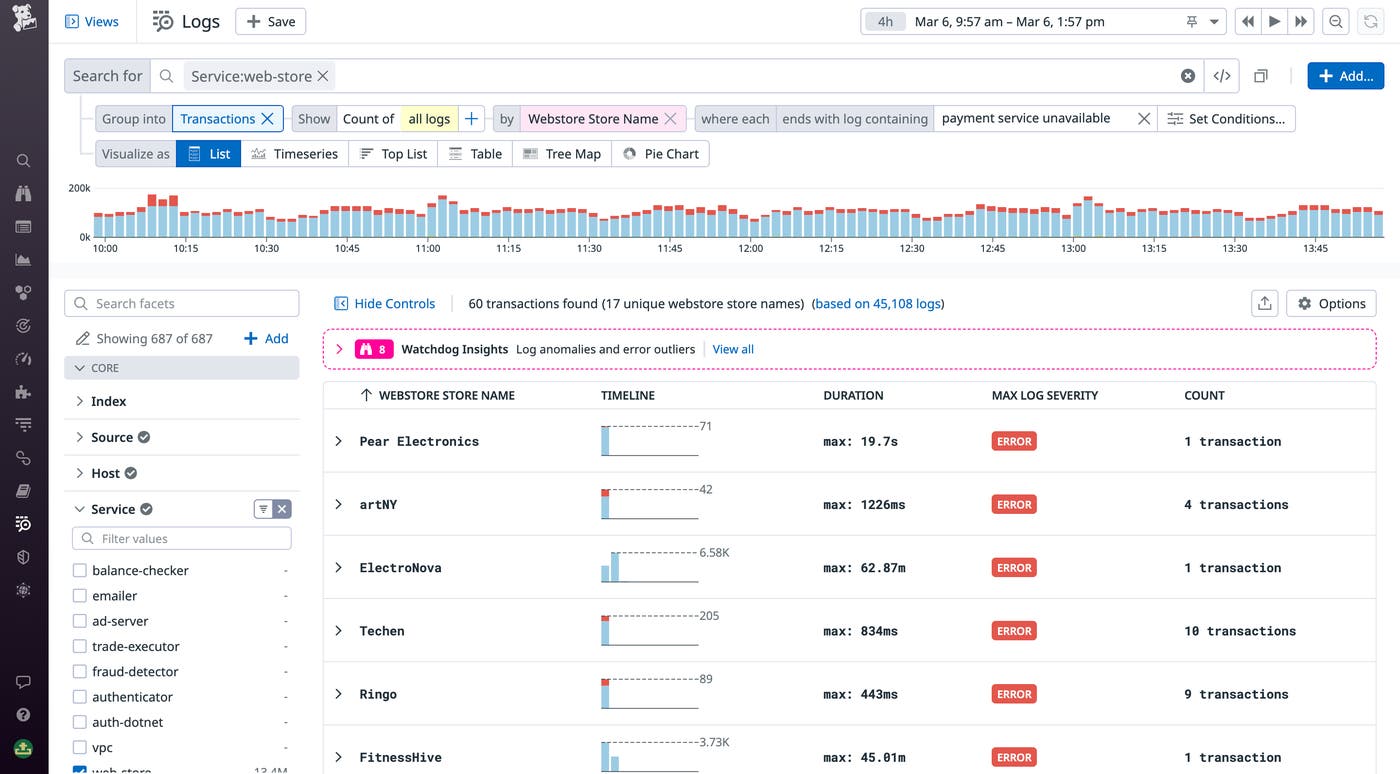
The preceding example shows a query that groups logs from an e-commerce application by merchant. By defining “payment service unavailable” as an end condition, we’ve refined our query to surface merchants that are experiencing outages in our payment service. This helps us understand the scope of the issue with this service—including which merchants and customers are affected, as well as how many times they experienced the error within the query’s defined timeframe.
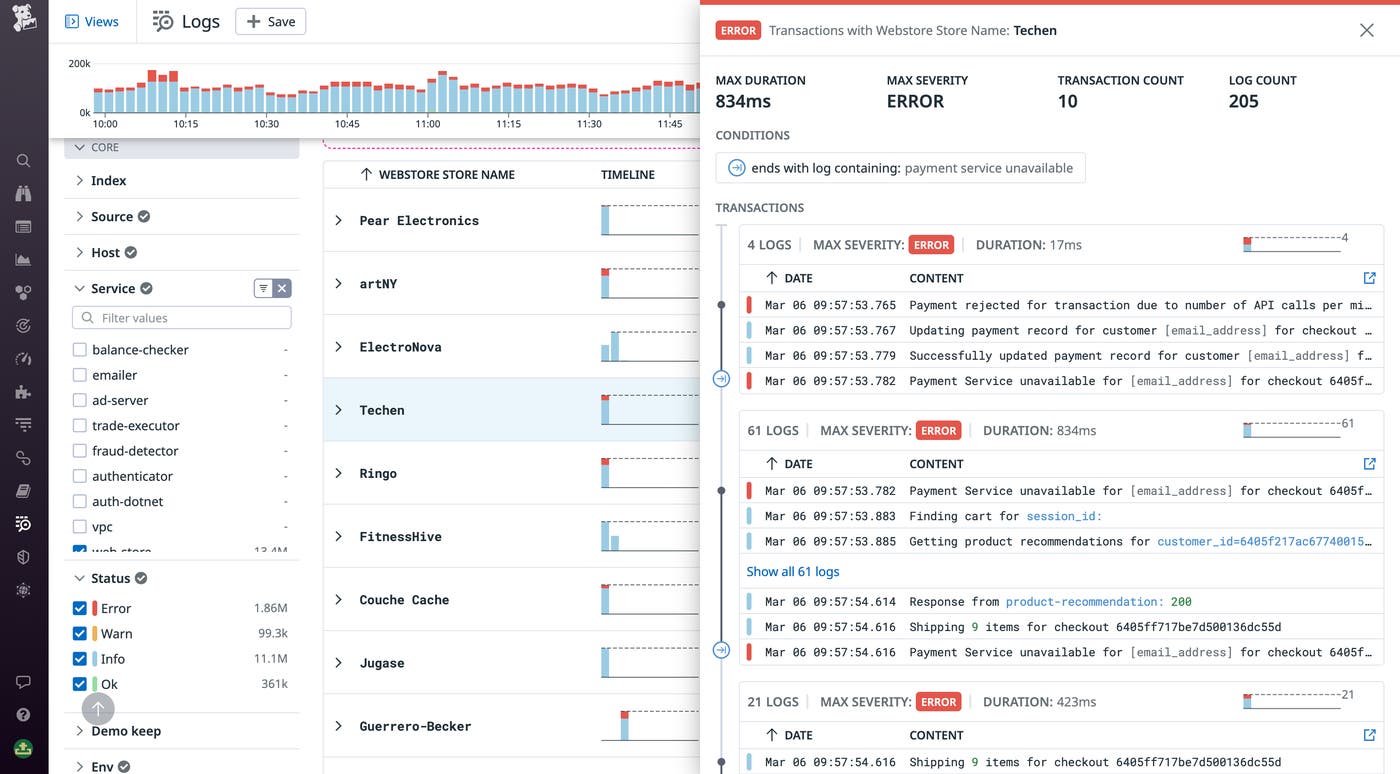
The transaction group above shows the sequence of events leading up to the payment service unavailability experienced by a particular merchant. Clicking on an individual transaction shows the full timeline of logs emitted during the transaction, and lets you inspect each one to view its data and associated tags. Each transaction’s graph visualizes the volume of associated log events over time, helping you spot moments of unusual activity, such as a high volume of errors. In the example above, we can see a registry of activity on a merchant for the specified time span. We can then investigate individual logs and pivot to related metrics and traces to diagnose the source(s) of the payment service unavailability. By inspecting the associated trace for one of the “payment service unavailable” events that formed the end condition of our transaction query, we can search for underlying errors with its dependencies, such as APIs or other microservices. This helps us get closer to the root cause of the issue.
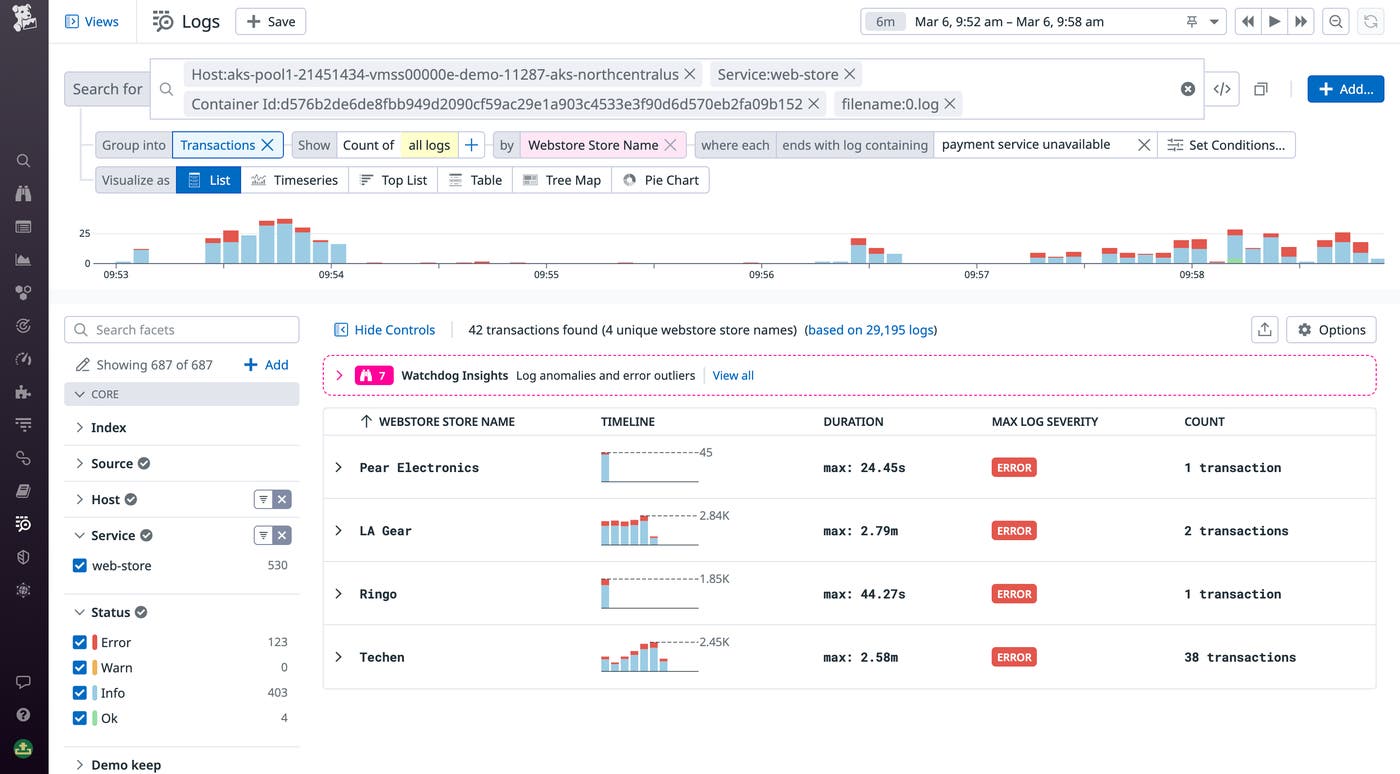
To spot any infrastructure-level issues, we can click the “View in Context” button, which is available in the side panel for each log. The button scopes the query to logs emitted from the same host or container as the error log we are investigating. Grouping these logs into transactions then enables us to compare transactions for other merchants running on the same host and see if the issue we initially observed is showing up for them as well. The example below shows 12 transactions running on the same host that we discovered in our investigation—all of which experienced the same “payment service unavailable” issue.
Get started with Log Transactions Queries
Logs provide invaluable visibility into your applications and context around problems. Datadog’s Log Transaction Queries feature helps you cut through the noise of your environment’s logs by pulling together relevant logs from sources across your stack to give you deep insights into the health and performance of individual requests and processes. Get started using transactions in Datadog’s Log Explorer today. Or, if you’re brand new to Datadog, sign up for a 14-day free trial.
