Jacob Simpher

Yahya Mouman

Barry Eom

Will Potts
LLM agents and LLM applications depend on continuous experimentation to refine their performance and accuracy. But many teams lack a systematic way to manage and observe these changes. Prompts are often hardcoded within applications and tracked through ad hoc methods, creating a disconnect between prompt iterations and key observability data. As a result, it’s difficult for you to know whether a change to your prompt improved your application or caused regressions in latency, cost, or other evals.
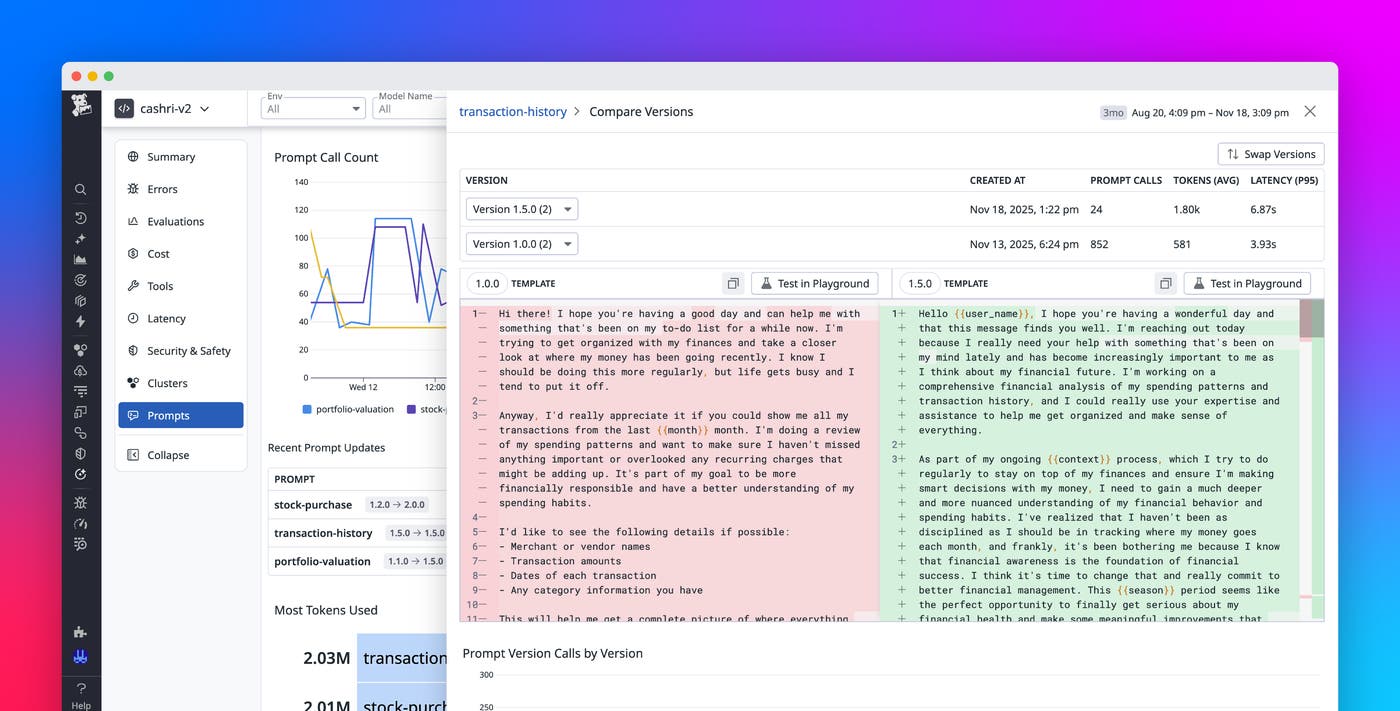
Prompt Tracking, a new feature that is generally available in Datadog LLM Observability, helps fill this visibility gap. Prompts are defined, versioned, and monitored as first-class artifacts, so you can manage and evaluate them with the same rigor that you apply to application code and models. You can correlate performance regressions or improvements directly with specific prompt changes; measure error rate, token usage, and latency; and make confident rollout decisions based on real data.
In this post, we’ll show how Prompt Tracking helps you:
- Define and observe changes in prompts
- Correlate prompt changes with performance
- Analyze all prompt versions and trends in one view
Define and observe changes in prompts
Prompt Tracking introduces versioned, observable prompts within LLM Observability. Each prompt is defined with structured metadata, such as its name, version, template roles (for example, system, user, and assistant), and dynamic variables (for example, ${user_name} and ${ticket_id}). If your application uses the LangChain framework, prompt IDs and versions are automatically instrumented through the LLM Observability SDK.
You can manage prompt definitions directly through the LLM Observability SDK and API. Python support is available now, with Node.js and Java support coming soon. Prompts are stored and versioned across environments, giving you a clear record of which version is deployed in dev, staging, and production.
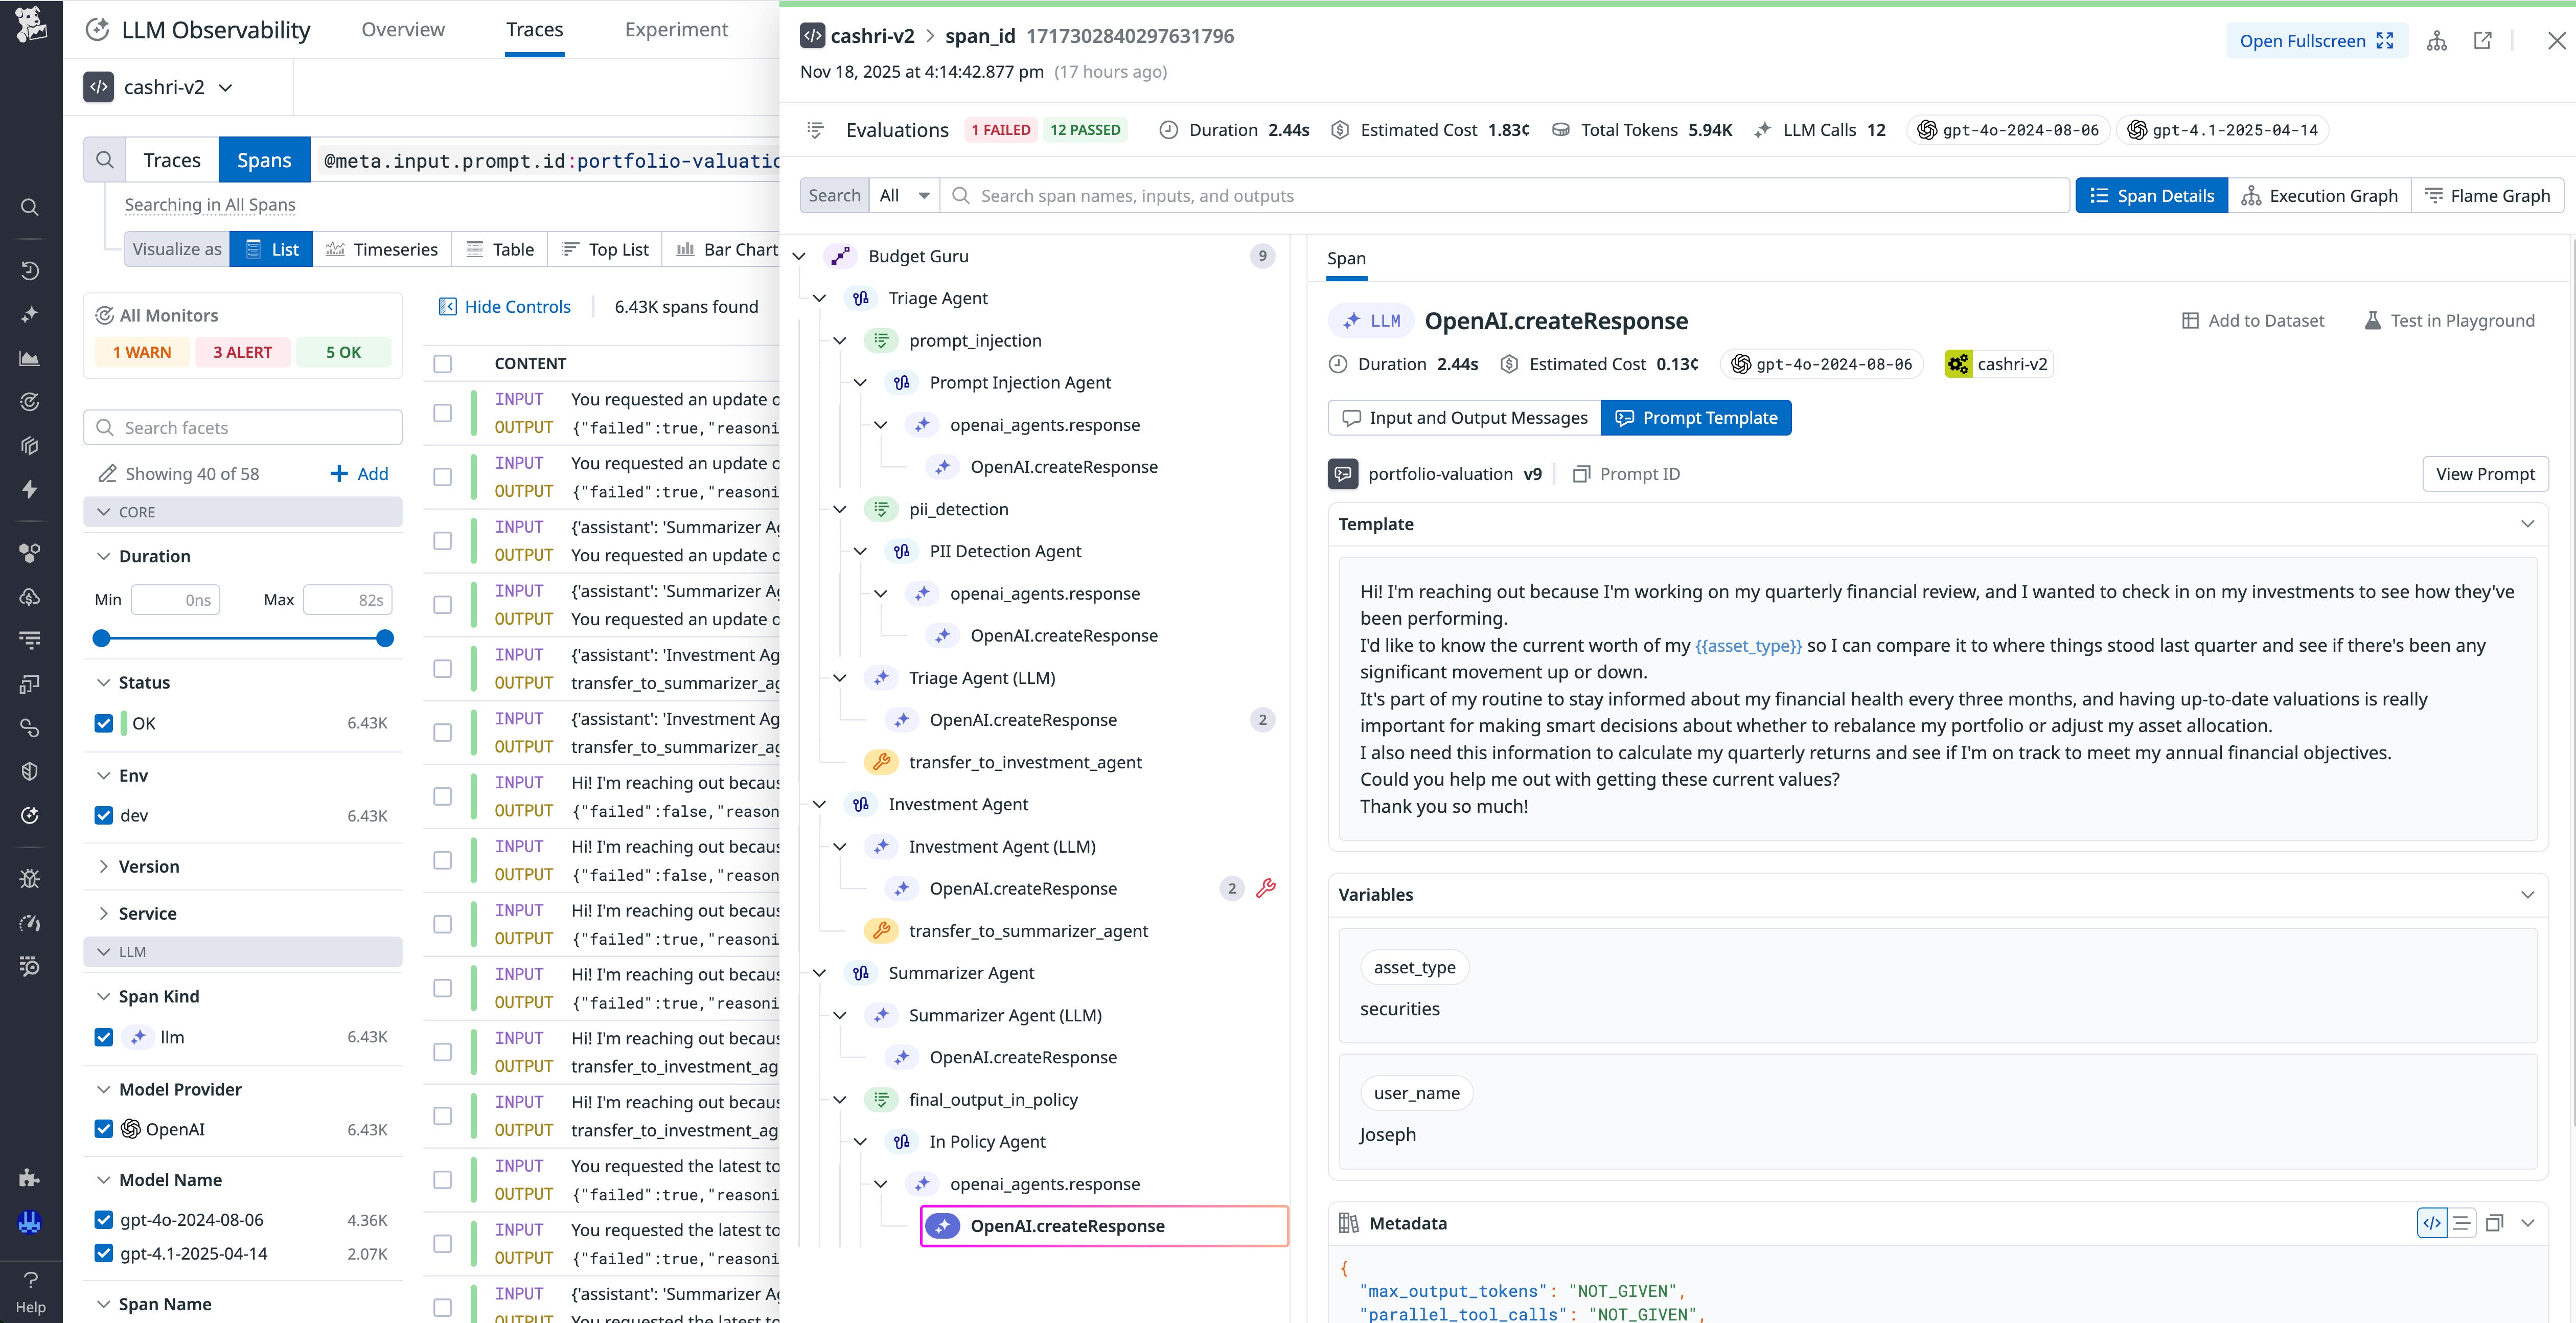
When a tracked prompt is called, LLM Observability automatically attaches the corresponding version metadata to your LLM spans and traces. This metadata association gives you an immediate, auditable link between each prompt change, its deployment, and the observed performance. As a result, you can see how every iteration affects application outcomes. This versioned approach brings prompt development closer to established software practices, giving your engineers a feedback loop as tight as a CI/CD pipeline for traditional code.
Correlate prompt changes with performance
When prompts are versioned and instrumented, LLM Observability provides correlation between prompt evolution and LLM performance metrics. In the Traces view, you can filter by prompt name and version to see how different iterations behave across requests. Each trace displays the full prompt template, the prompt variables, and associated telemetry data, including latency, token count, and evaluation metrics.
For example, if your team releases a refinement prompt (v2.0) to shorten responses, you can track how that change affects latency, errors, and token usage compared to the previous version (v1.2). If costs decrease but error rate increases significantly, you’ll know why. At that point, you can decide whether to refine the prompt or roll back to a previous version.
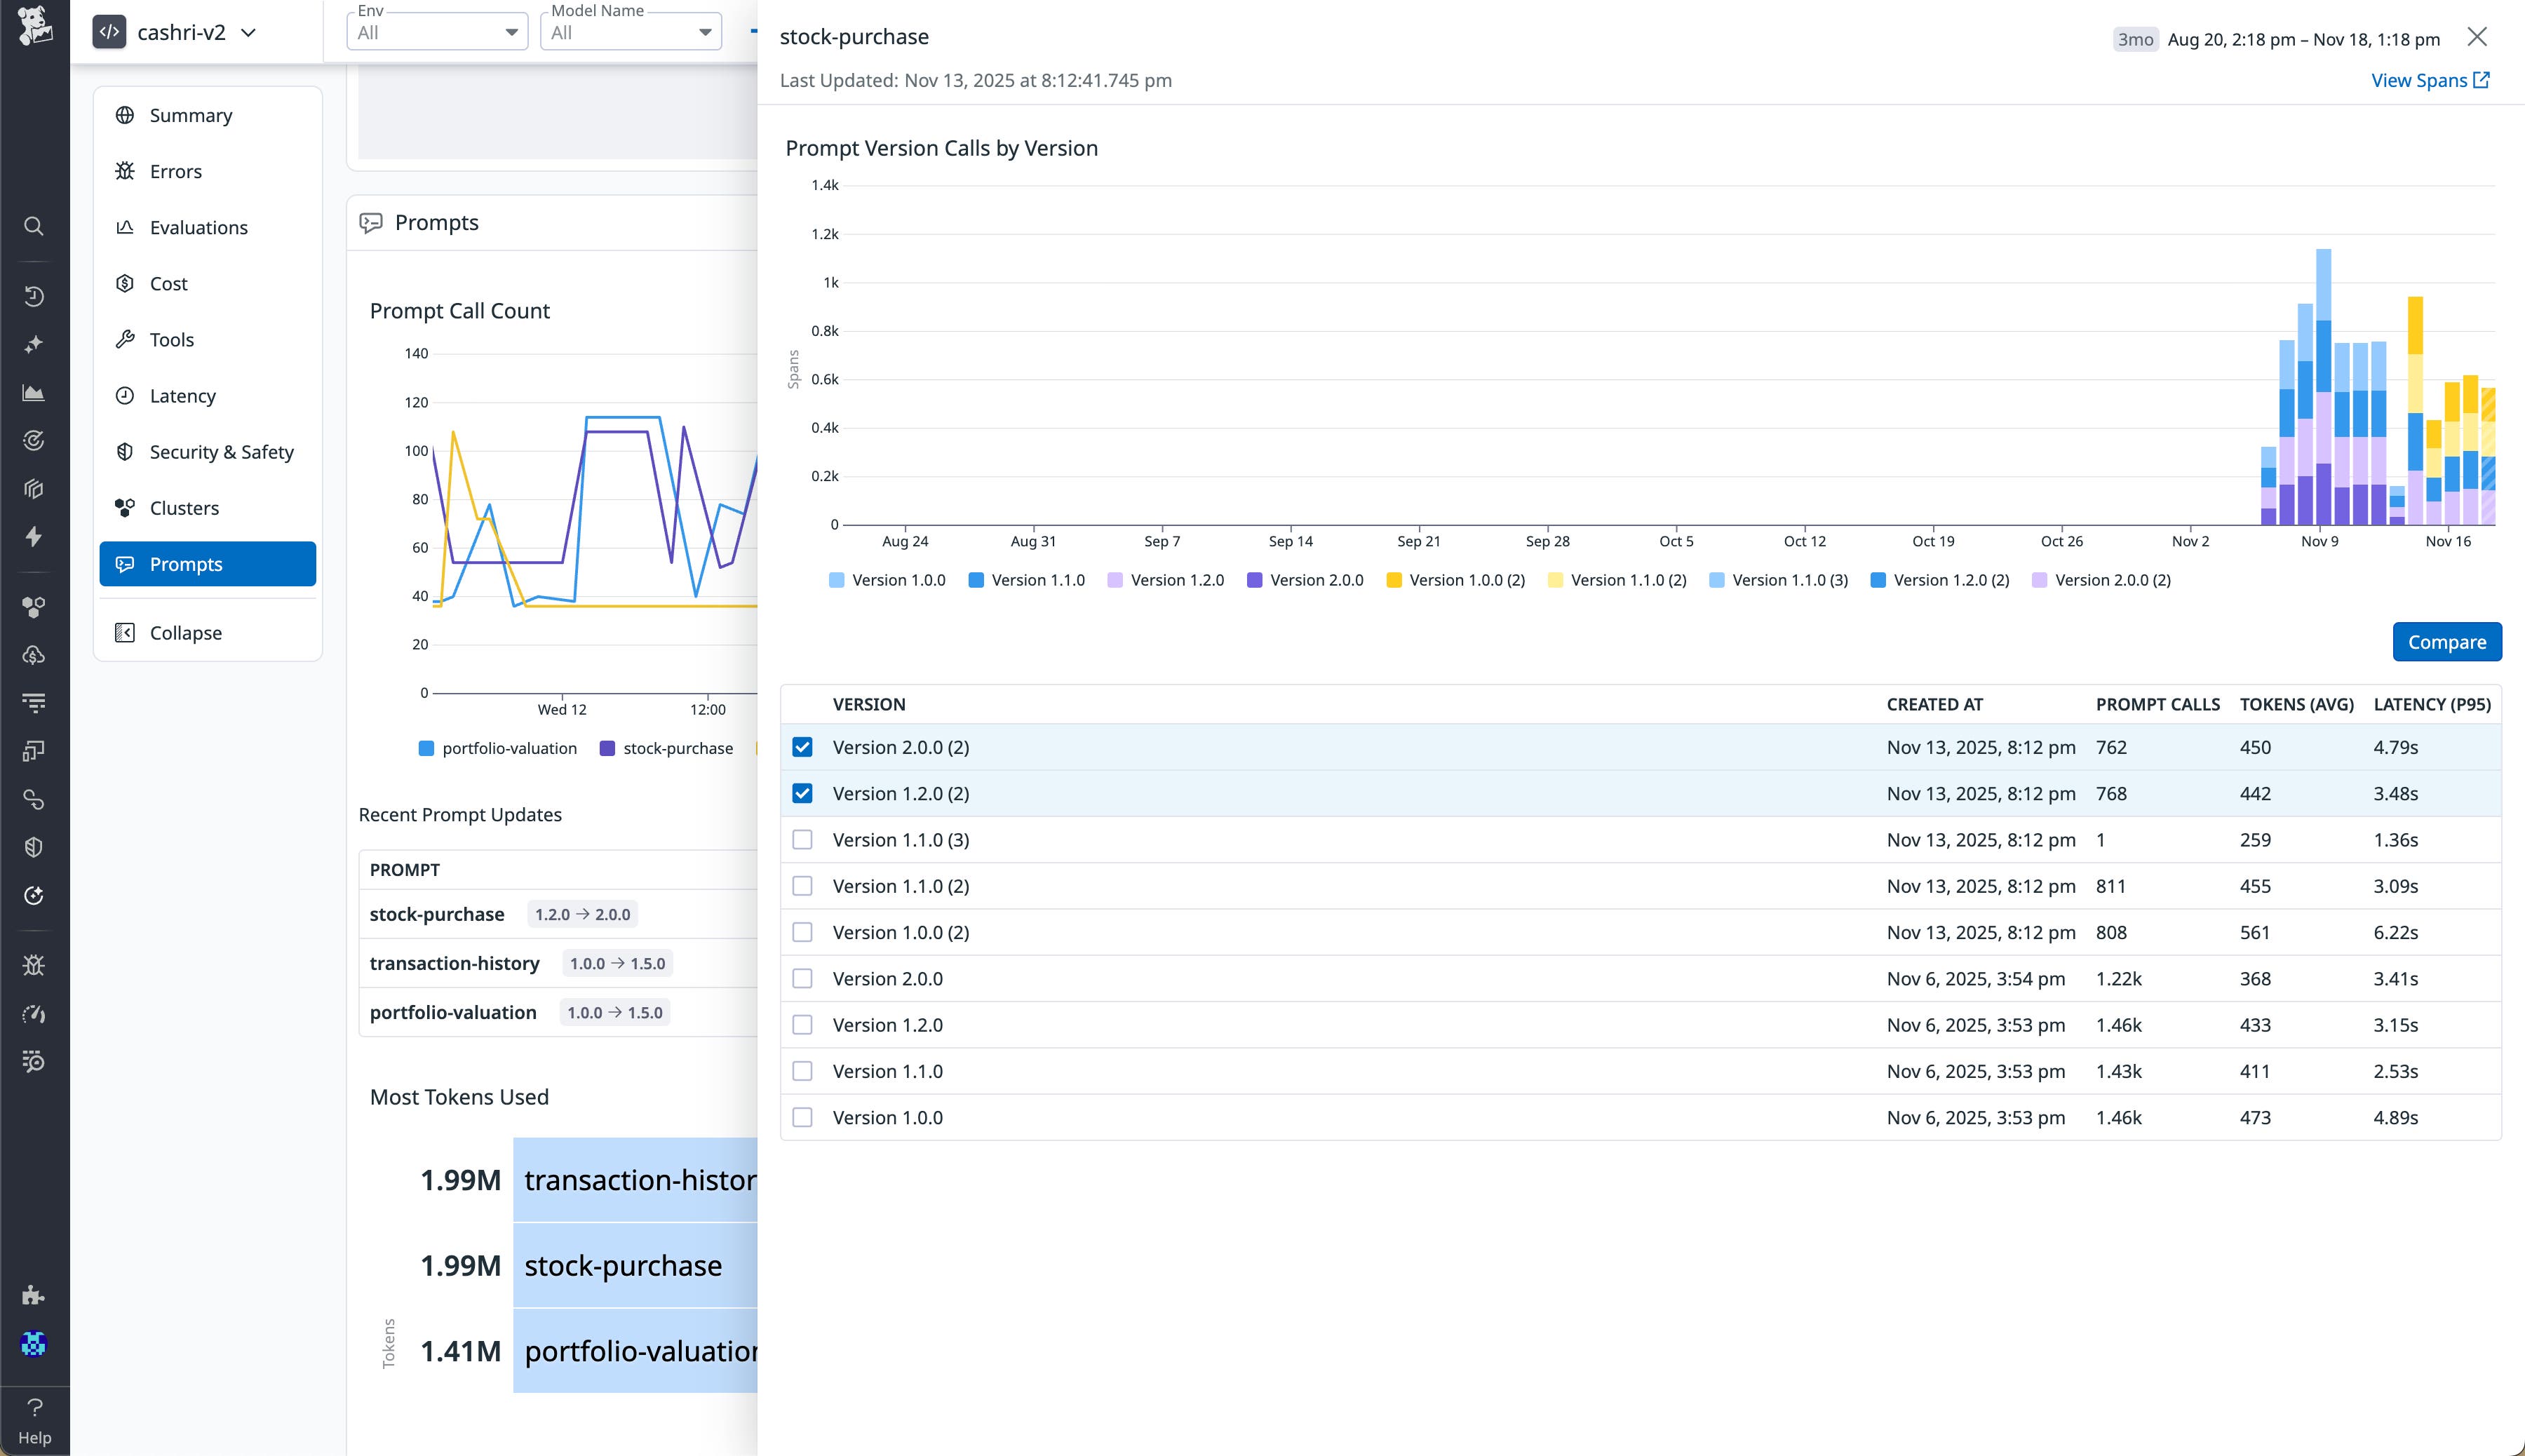
You can also replay a version of a prompt in the Prompt Playground to validate changes before production rollout. This environment offers quick, side-by-side testing of prompt behavior and model responses, shortening the iteration cycle between design and deployment of prompts.
Analyze all prompt versions and trends in one view
The Prompts section of the Overview tab consolidates all of your tracked prompts into a single analytics-driven dashboard. Each entry shows a prompt’s versions, usage trends, and key performance indicators such as latency, token cost, and evaluation results. You can view timeseries trends by environment, model, or LLM provider to understand how prompts are performing across real workloads.
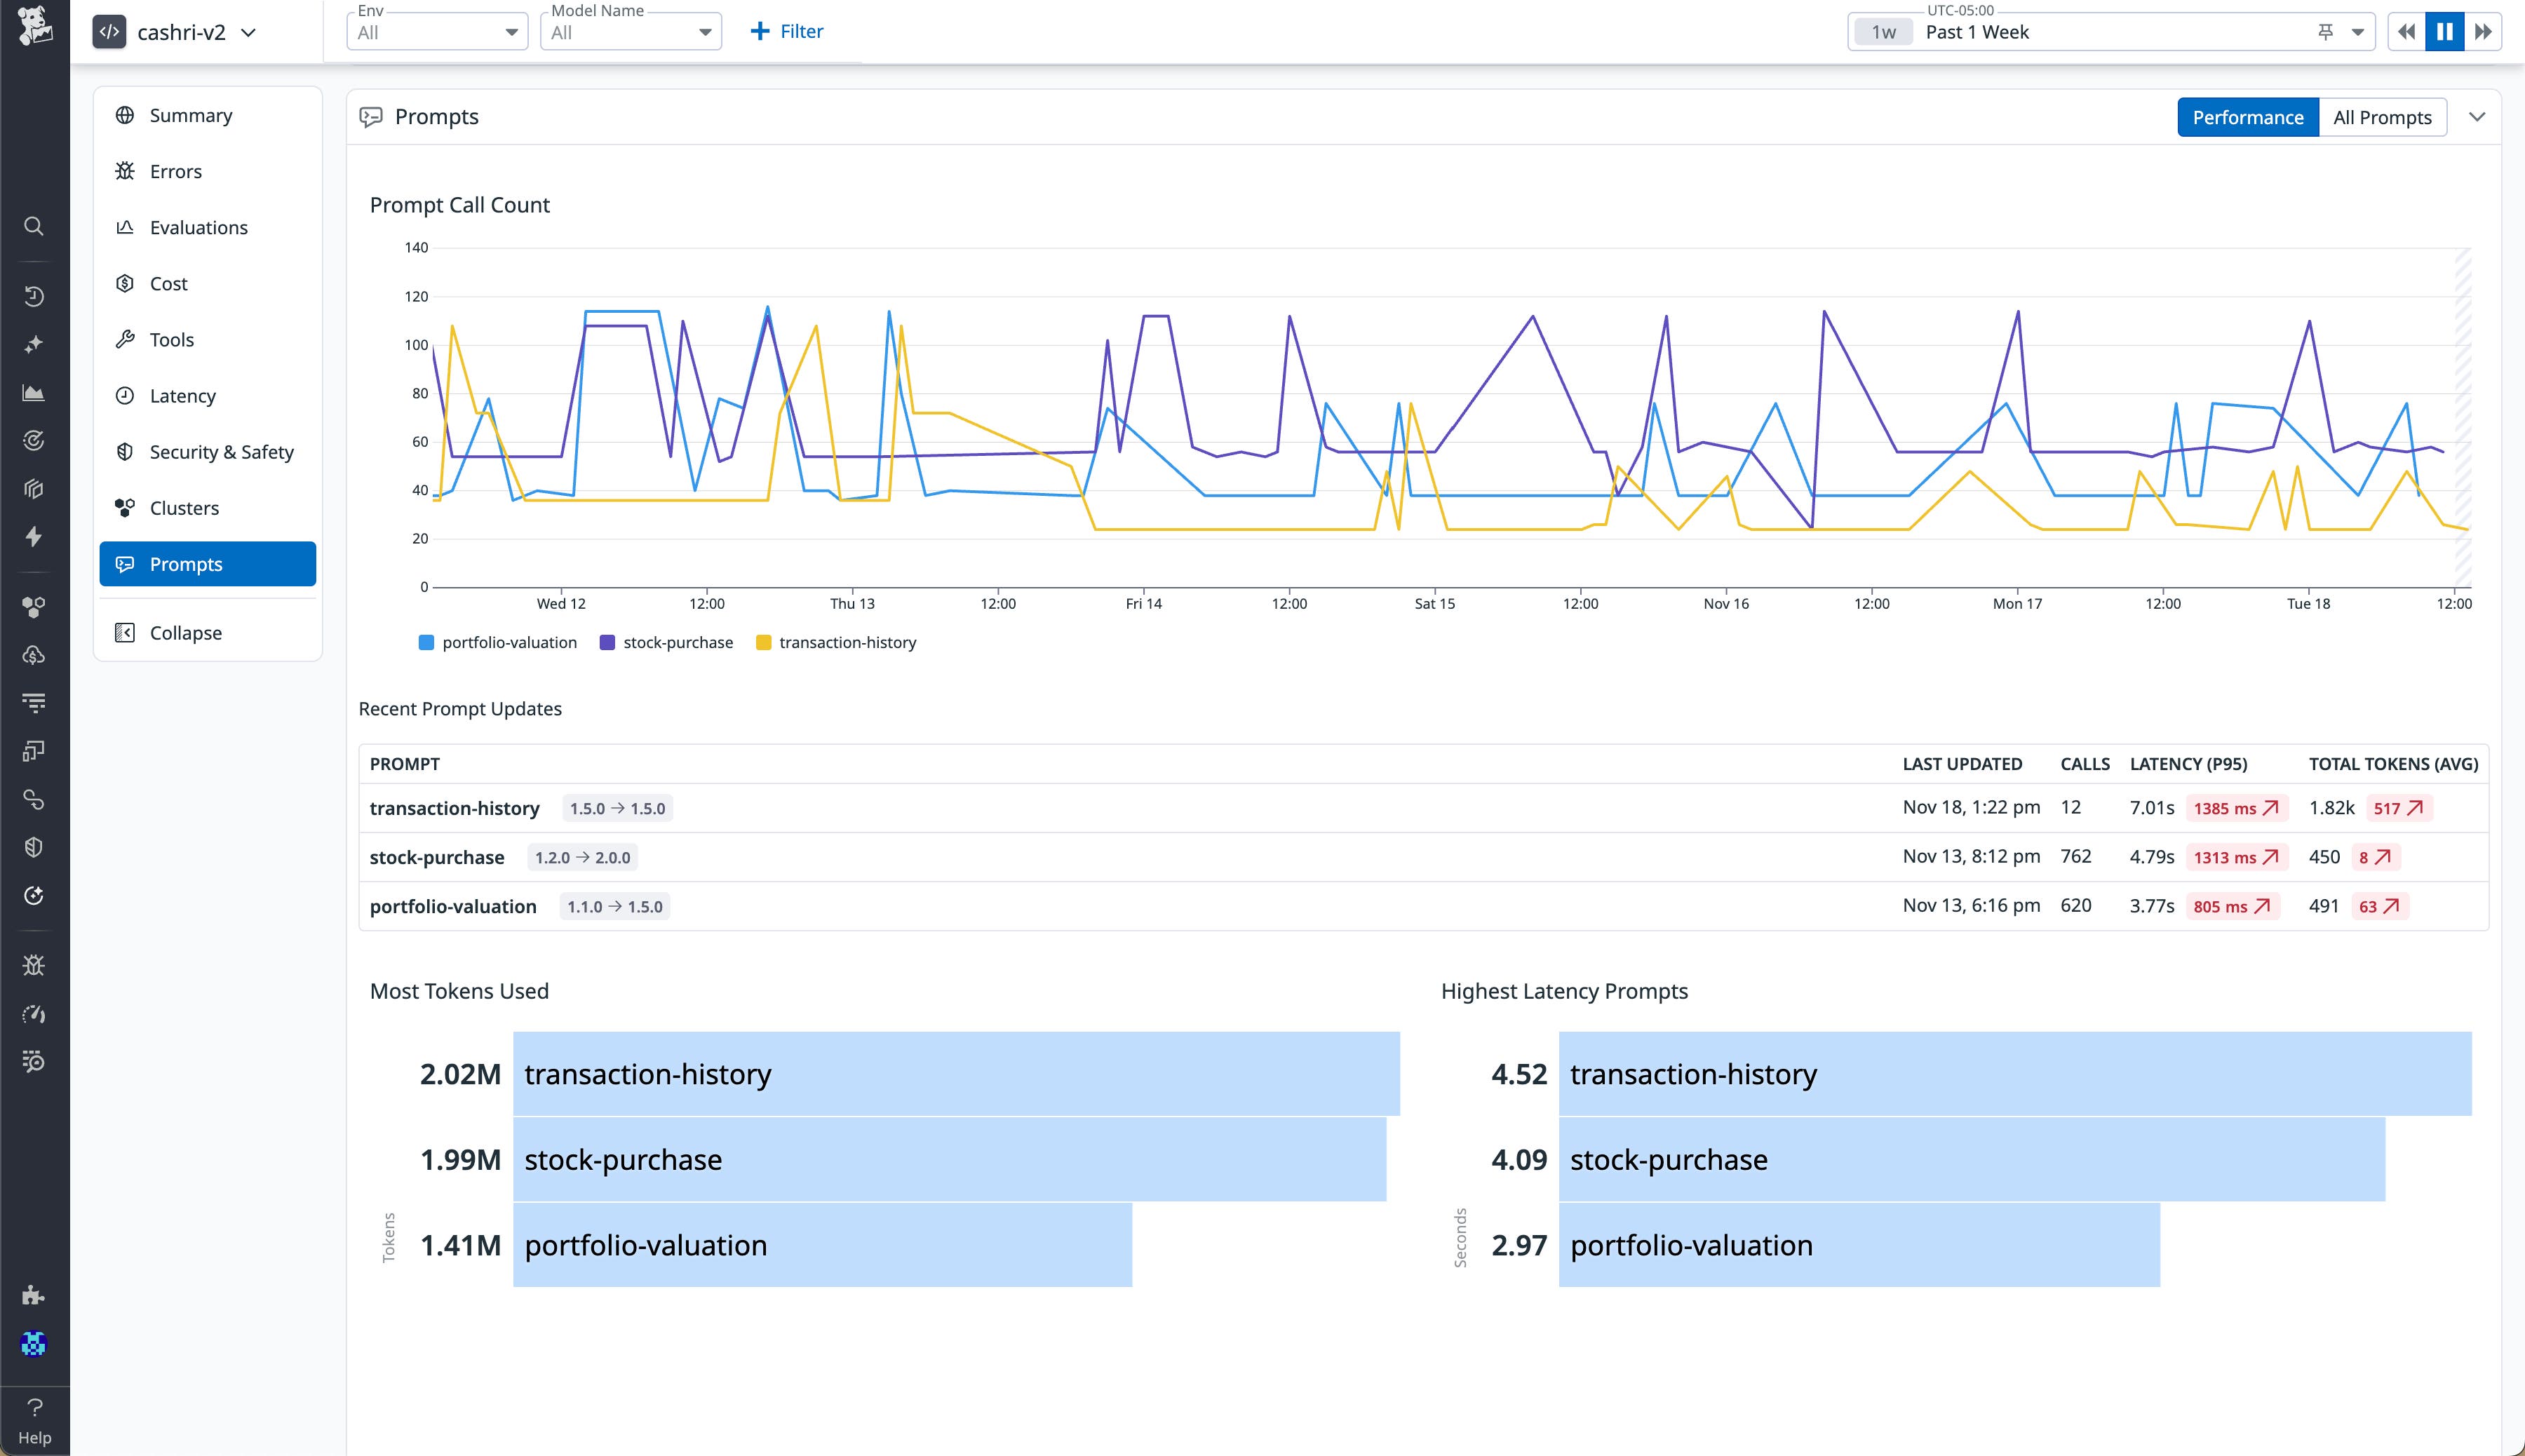
From this view, your platform and AI engineering teams can identify underperforming prompts, detect regressions before they reach users, and prioritize optimization work. For example, a surge in latency for one version might indicate inefficient template changes, whereas higher token counts could signal prompt bloat. Because Prompt Tracking is integrated with Datadog’s unified telemetry data (metrics, logs, traces, and evaluations), you can investigate performance regressions for prompts in context with infrastructure health or external API behavior.
Start tracking and optimizing your LLM prompts today
LLM Observability offers your teams full visibility into how changes in prompts influence the performance, reliability, and cost of their LLM applications. With clear versioning, unified observability, and performance correlation, Prompt Tracking enables data-driven iteration, eliminates guesswork, and reduces the risk of regressions. To learn more, check out the Prompt Tracking documentation.
If you don’t already have a Datadog account, you can sign up for a 14-day free trial to get started.
