Candace Shamieh

Sumedha Mehta

Colten Woo

Jason Mimick
Serverless computing has simplified how teams build and scale modern applications. By abstracting away infrastructure management, developers can focus purely on code. AWS Lambda, Amazon’s serverless compute service, automatically runs your code in response to events and scales appropriately, effectively removing your need to provision and manage servers. With a pay-per-use pricing model, AWS Lambda is ideal for workloads with unpredictable or intermittent traffic. Developers can simply upload their functions, while AWS Lambda handles the infrastructure, capacity planning, and scaling.
Despite AWS Lambda’s simplicity, many teams running large AI or data processing jobs have opted to use Amazon EC2 instead. For steady-state or compute-intensive workloads, they prefer Amazon EC2’s predictable performance and hardware flexibility. To help these customers minimize their operational overhead, AWS now offers Lambda Managed Instances, which enable you to run Lambda functions on any EC2 instance type, including GPUs and Graviton4. Lambda Managed Instances lets you choose the hardware that best fits your workloads while AWS manages the instance lifecycle, scaling, and patching.
As a Day-0 launch partner for AWS, Datadog provides you with full visibility into the metrics, logs, and traces emitted by your Lambda Managed Instances. With Datadog, you can monitor Lambda Managed Instances alongside your other serverless compute services in a single, unified view. This enables you to spot bottlenecks, fix errors, and determine which workloads to refactor in order to optimize concurrency, whether that means increasing throughput or reducing unnecessary parallel executions.
In this post, we’ll explore how Datadog helps you visualize performance and health with unified metrics, logs, and traces and optimize workloads to balance performance and cost.
Get full observability from day one
Once you install Datadog Serverless Monitoring, telemetry from your AWS Lambda Managed Instances will start to populate into the AWS Serverless Monitoring view in real time. If you’re already using Serverless Monitoring for AWS Lambda, any function that transitions from Lambda on-demand to Managed Instances will automatically continue to emit the same telemetry to Datadog.
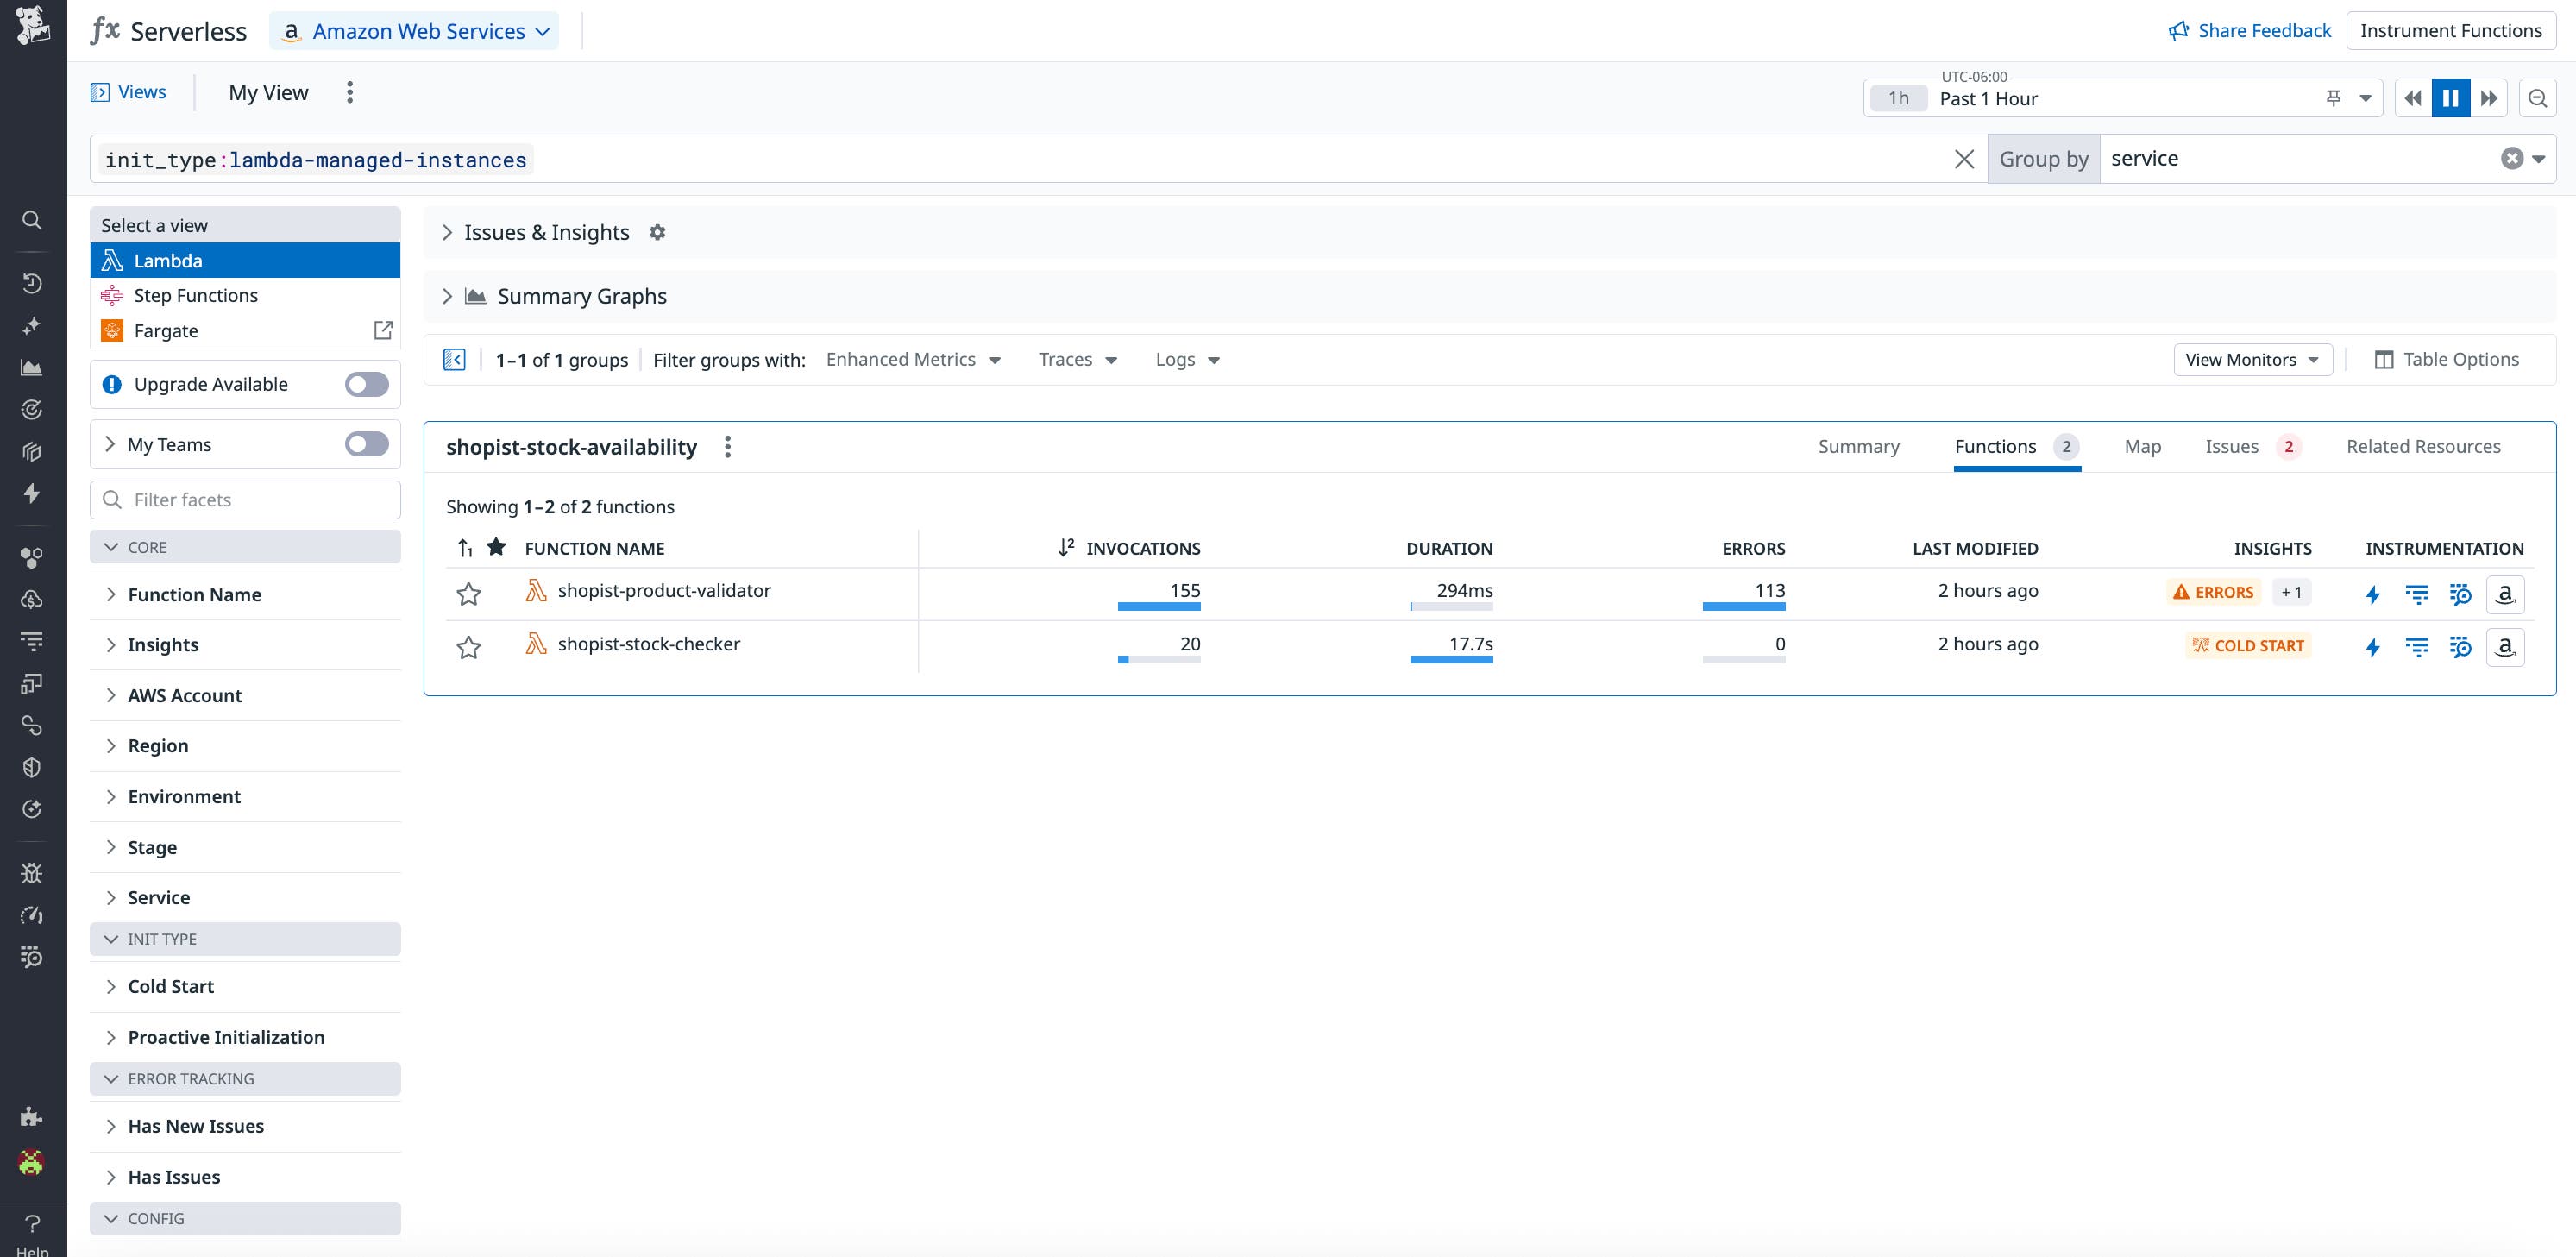
Adding the Datadog Lambda extension to your functions enables you to collect invocation, duration, and error metrics from your Lambda Managed Instances. Datadog will automatically correlate them with the logs and traces that instances generate. Because Datadog supports auto-instrumentation, you’ll also get full trace propagation between upstream and downstream services when you install the Datadog Agent. With full trace propagation, you can visualize how requests flow between Managed Instances, other Lambda functions, and AWS services like S3, DynamoDB, or API Gateway.
You can review invocation metrics, open related logs, and then analyze full request traces in order to pinpoint performance bottlenecks or infrastructure errors. For example, if a GPU-backed Lambda Managed Instance shows a spike in duration or error rate, you can open a related trace to see which part of the function’s code or downstream service caused the slowdown.
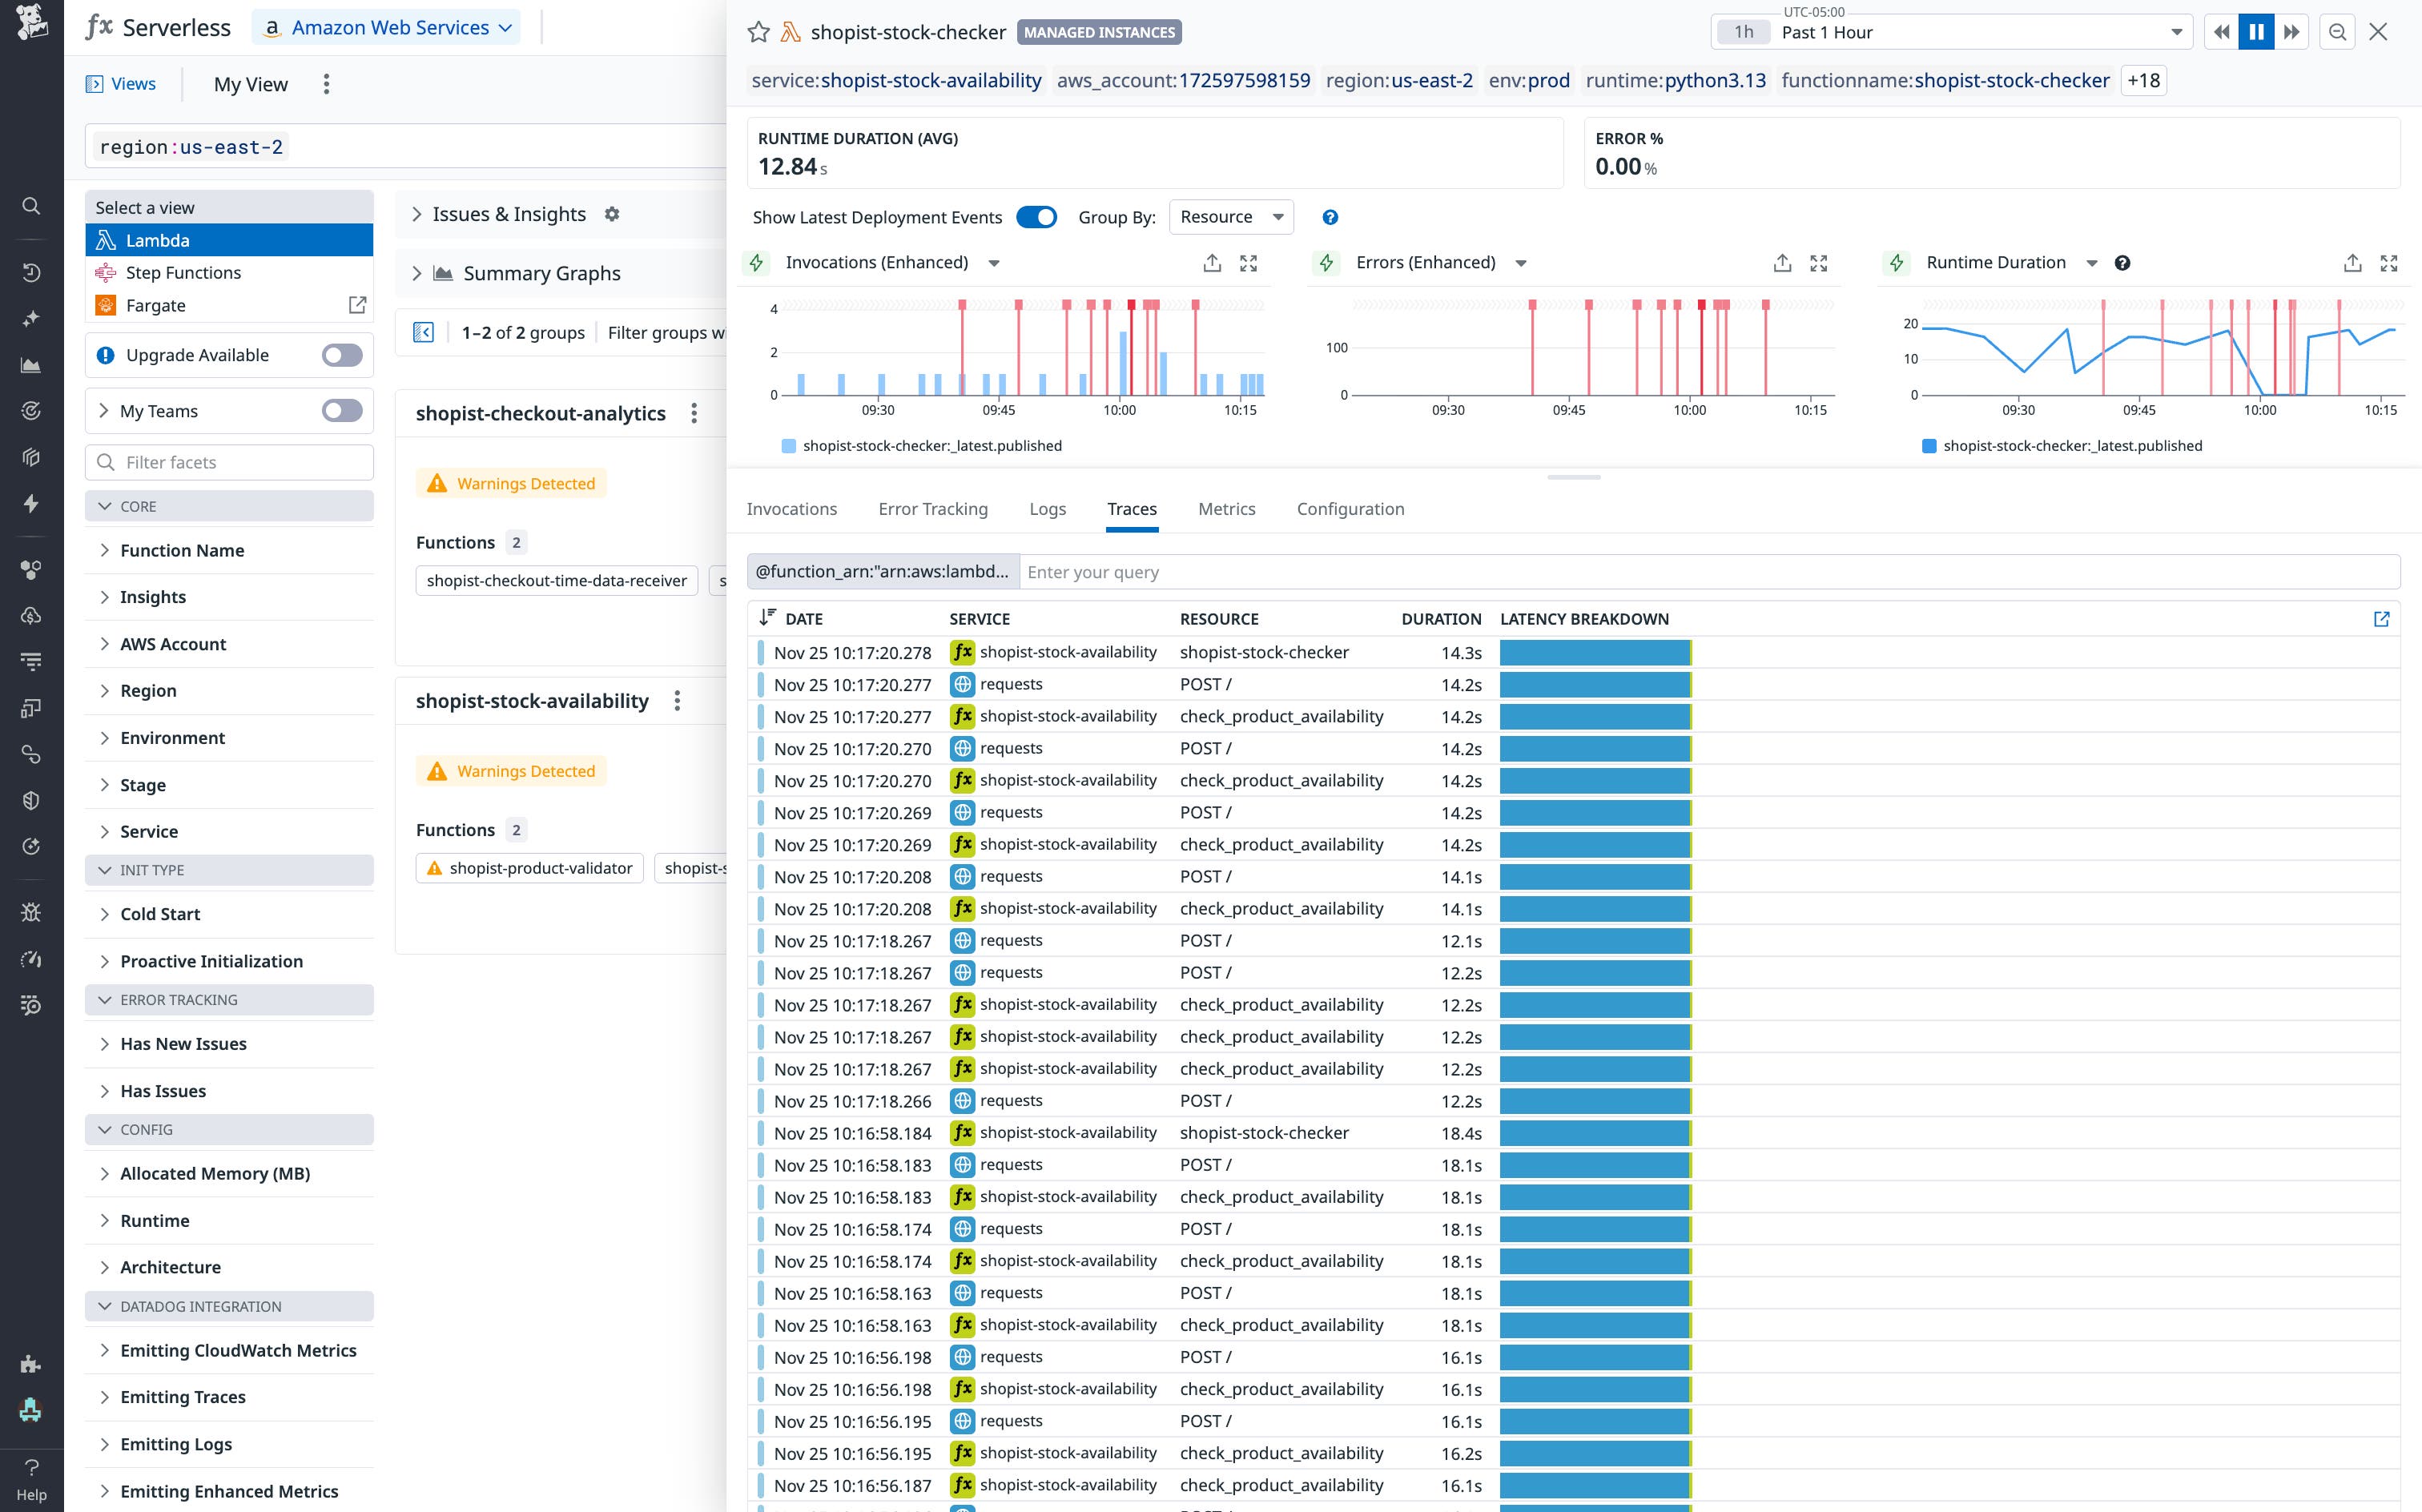
As teams adopt Lambda Managed Instances for steady or high-performance workloads, including training AI models on GPUs or running data processing pipelines, they require the same visibility they expect from Lambda’s traditional model. Datadog provides that visibility out of the box.
Assess how EC2-backed AWS Lambda Managed Instances perform at scale
Because Lambda Managed Instances extend Lambda’s execution model onto EC2 hardware, organizations can now unify observability across both ephemeral and persistent compute. Using Datadog dashboards, you’re able to monitor the performance of functions running on Lambda Managed Instances alongside their underlying hosts’ performance and resource usage. All EC2 Instances that are managed by Lambda are automatically tagged with aws_ec2_managed-launch:lambda-managed-instances. This enables you to identify issues in your business logic, detect unexpected compute usage and rising costs, and correlate workload traffic with host resource utilization all from a single view.
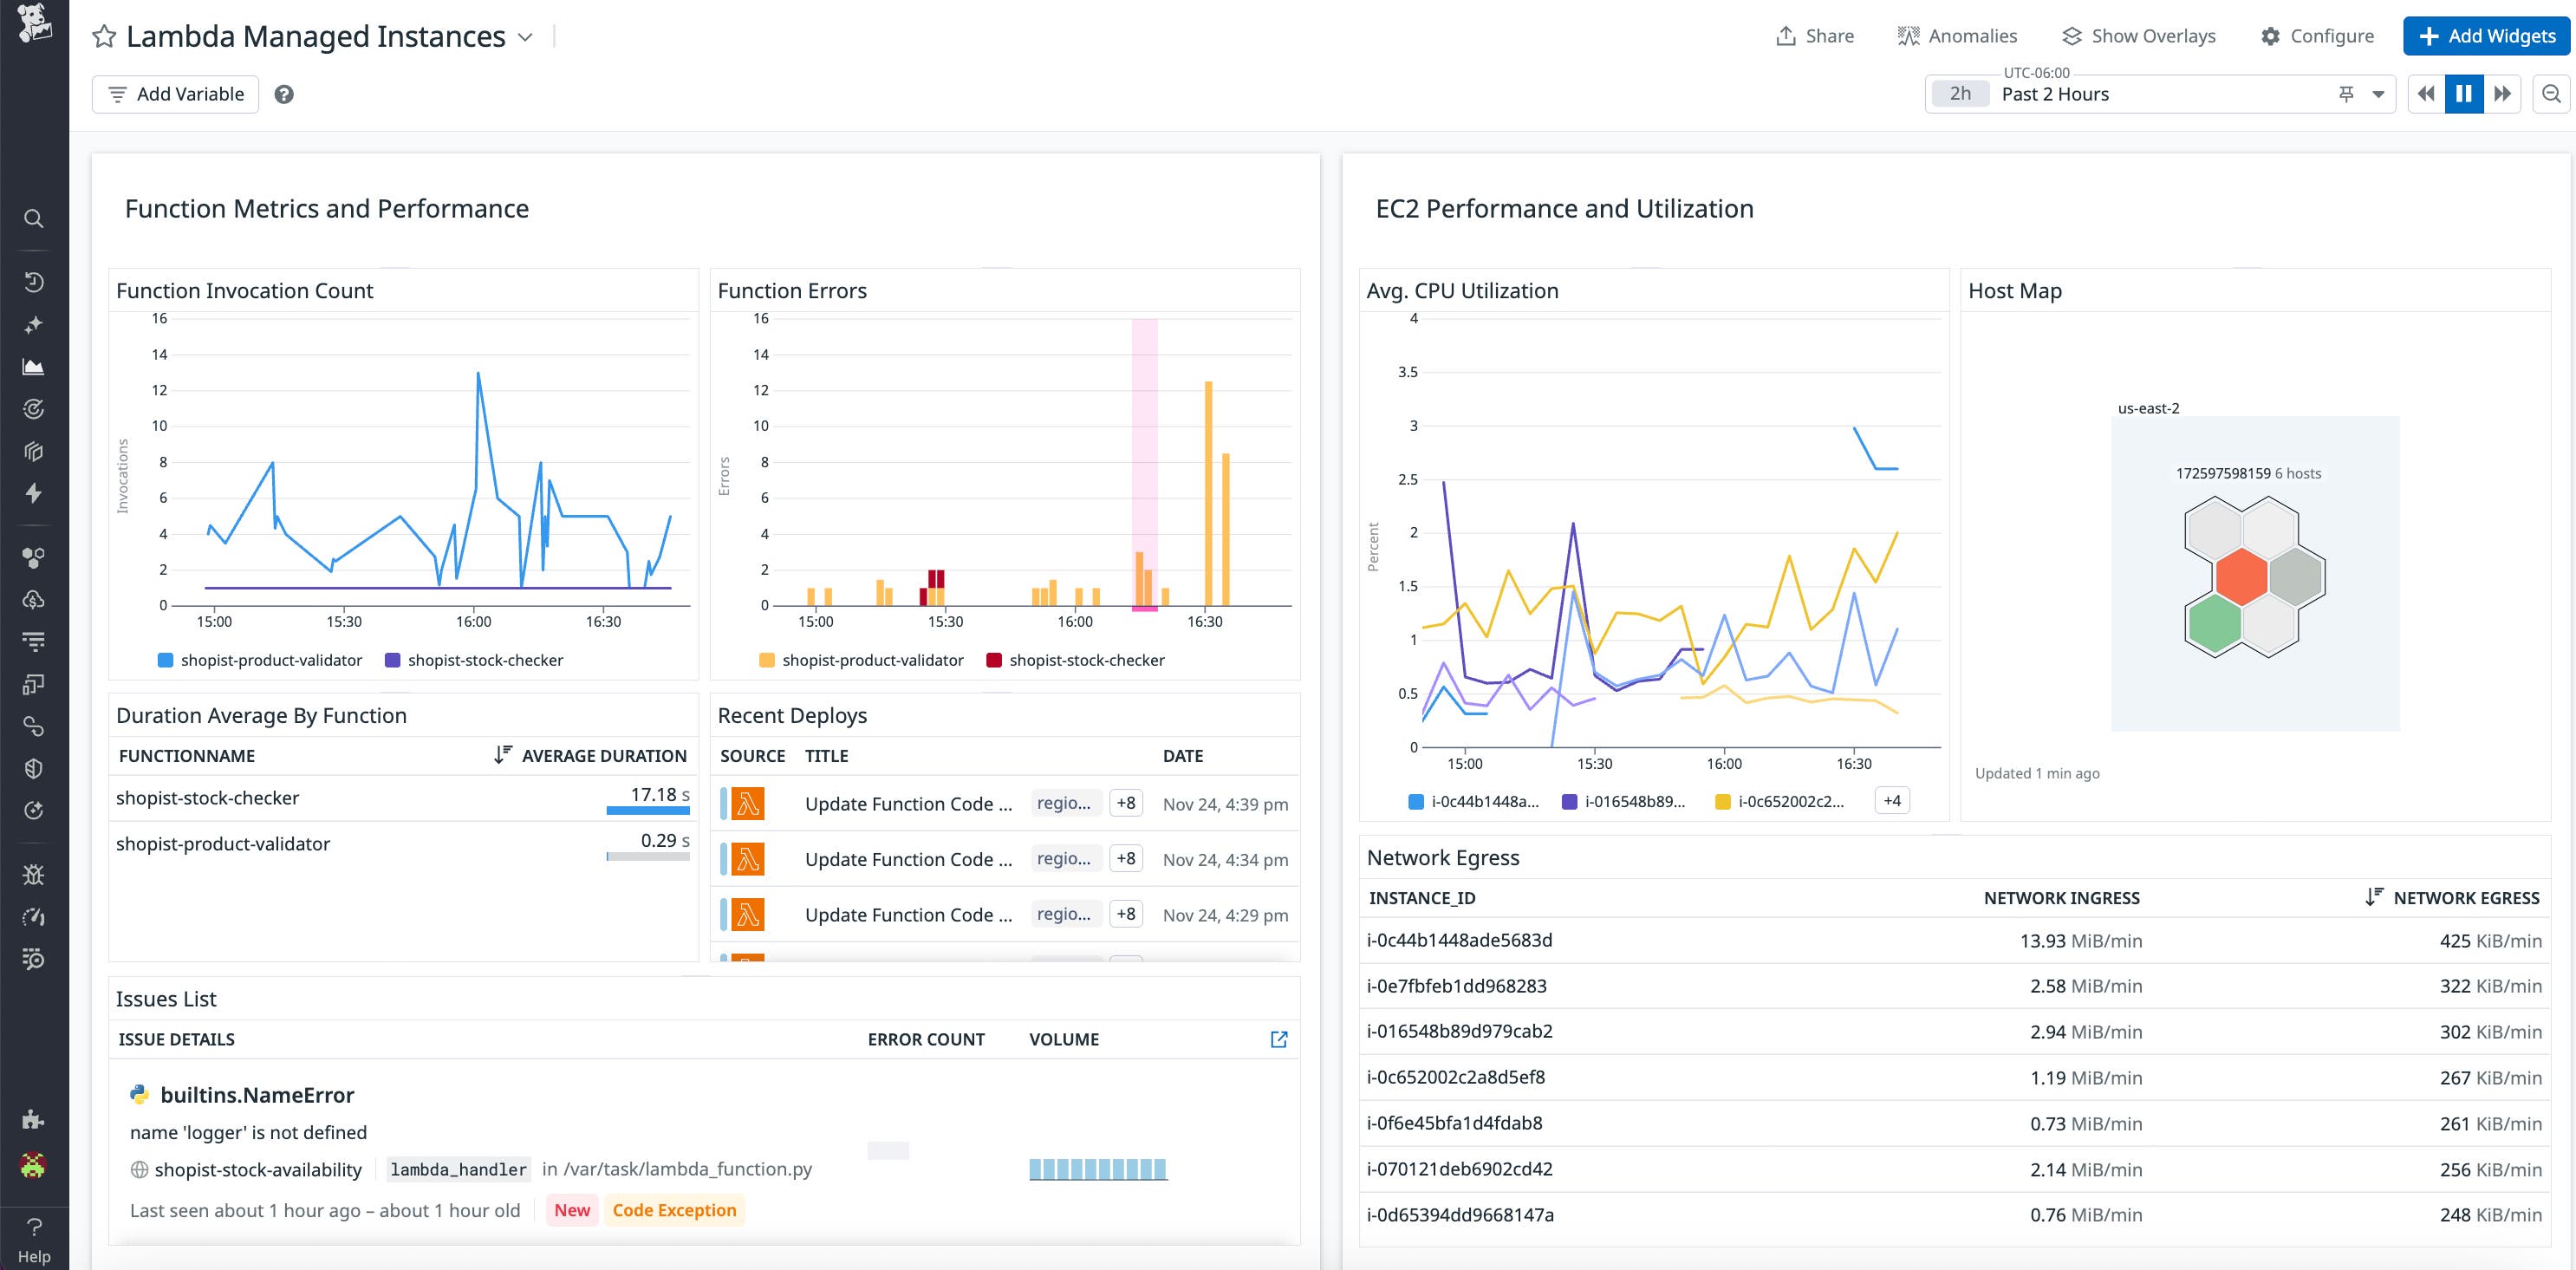
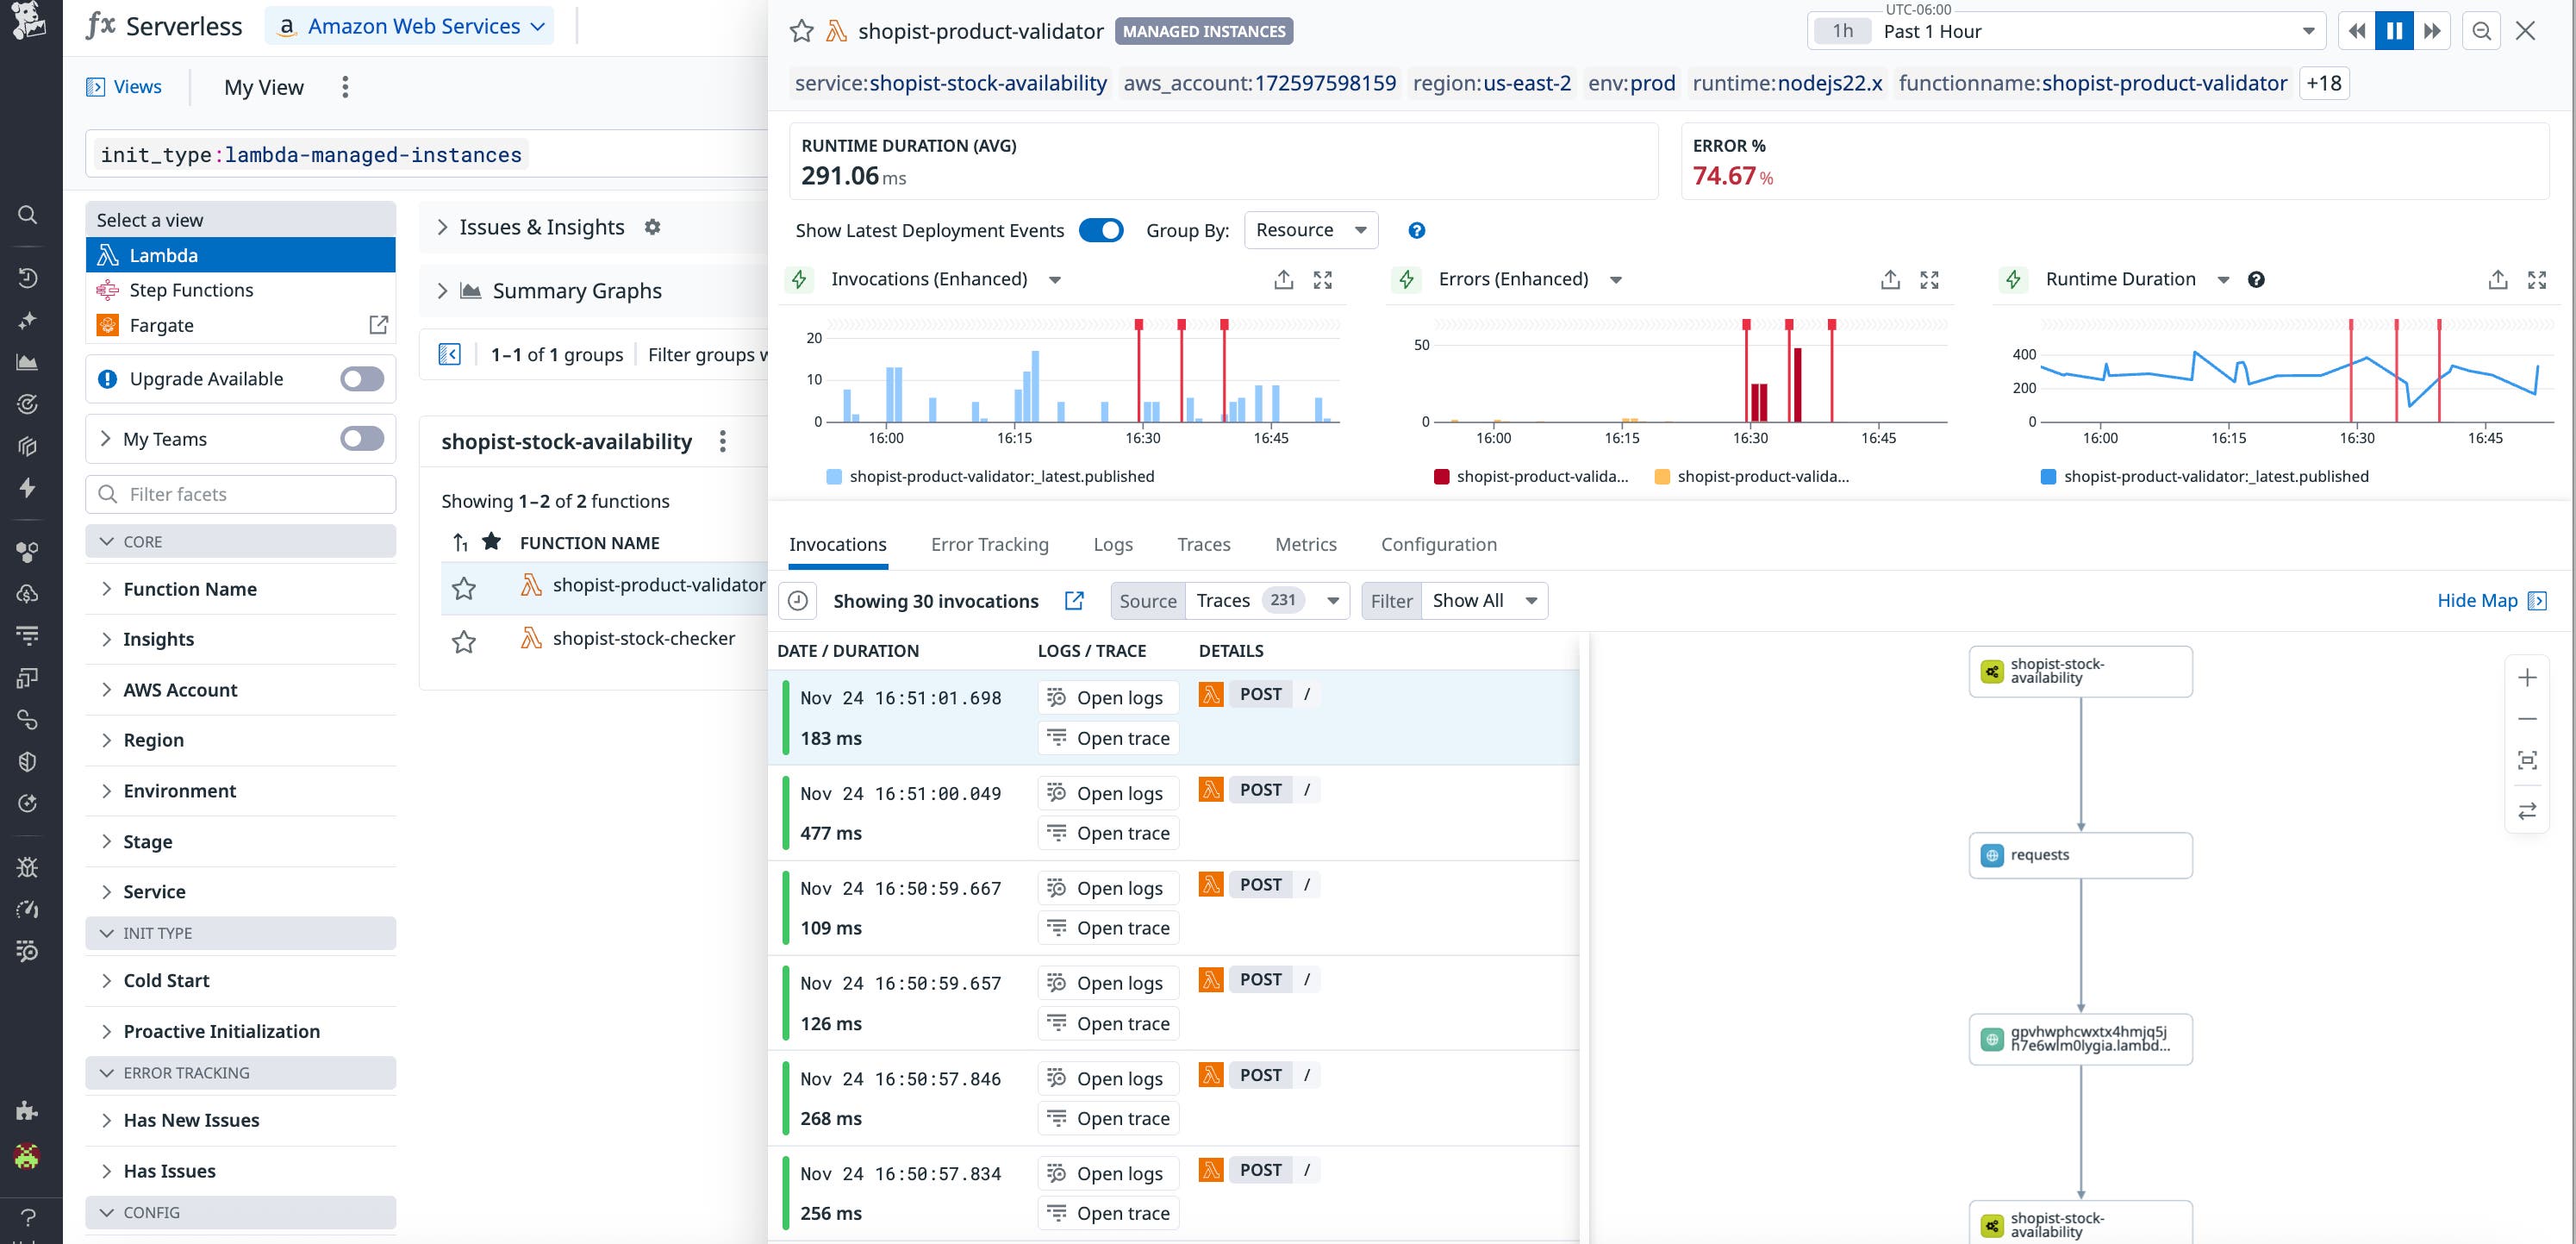
The dashboard can also be a starting point to launch your investigation when errors arise. For example, if you notice high network egress from a Managed Lambda Instance, you can directly inspect it from your dashboard to investigate the network traffic and mitigate costs. From here, you can investigate the instance’s function history and dive deeper into the traces of invocations with long runtime durations.
Start monitoring your Lambda Managed Instances with Datadog today
By running Lambda functions on any EC2 instance type, Lambda Managed Instances bridge the gap between serverless agility and infrastructure control. Datadog helps you take full advantage of this flexibility with complete visibility into how your workloads perform, scale, and consume resources.
Visit the documentation to learn more about monitoring your AWS Lambda Managed Instances. New to Datadog and don’t already have an account? Sign up for a 14-day free trial.

