
Mallory Mooney
Microsoft Azure SQL Database is a platform-as-a-service (PaaS) database offering for modern cloud applications. It's a fully managed service that runs on the latest version of the SQL Server database engine, enabling you to create highly available and performant database instances without needing to maintain hardware upgrades, patches, or backups. SQL Database also supports both relational and non-relational (i.e., NoSQL models) data, so you can store, consolidate, and manage different data formats (e.g., XML, JSON) in the same database instances.
Azure lets you deploy databases as either single database instances or as a part of an elastic pool. Single databases are isolated instances with their own resources and are useful for applications that only need a single data source. Elastic pools consist of a group of databases that can run different workloads in support of more complex applications. Pools share the same resources, which is ideal for grouping instances with similar usage patterns—typically low average utilization with occasional spikes—in order to reduce costs and ensure they always have enough resources to perform optimally. For every provisioned database, Azure provides several performance and security features, including automatic tuning and performance insights powered by artificial intelligence.
Monitoring Azure SQL databases helps you manage the costs of running them and enables you to detect performance issues that can negatively affect the reliability of your applications. For example, an underprovisioned database instance may not be able to process queries efficiently, which ultimately slows down application performance and affects your users' overall experience. To help you monitor performance and costs, Azure SQL databases generate the following telemetry data:
- metrics that track resource utilization, database connections, available storage, deadlocks, and more
- resource logs, a type of Azure platform log, that contain additional details about activity related to database performance, such as deadlocks
- audit logs for all operations on a database, including details about executed queries
These types of telemetry provide better visibility into database activity, but which data you should monitor could vary depending on the database architecture. When you provision a database, you select which pricing model and service tier you want to use. This determines what levels of compute, memory, I/O, and storage capacity are available for your databases, which directly affect performance and costs. In this guide, we'll look at this data in more detail and how the different configuration options for Azure SQL Database determine which types of data you should monitor.
This guide uses metric terminology defined in our Monitoring 101 guide, which provides a framework for metric collection and alerting.
Key Azure SQL Database metrics
The key metrics we'll look at fall into the following categories:
- Performance metrics: compute, storage, and worker usage and limits
- Connectivity metrics: active connections to a database
We'll also look at Azure SQL Database audit logs, which can be used to monitor database activity and surface potential threats to your database instances.
Performance metrics
Azure offers various purchase models and service tiers to support different types of database workloads. These enable you to define how much processing power and storage your databases have, which helps you better predict costs and determine how well they execute workloads and handle traffic.
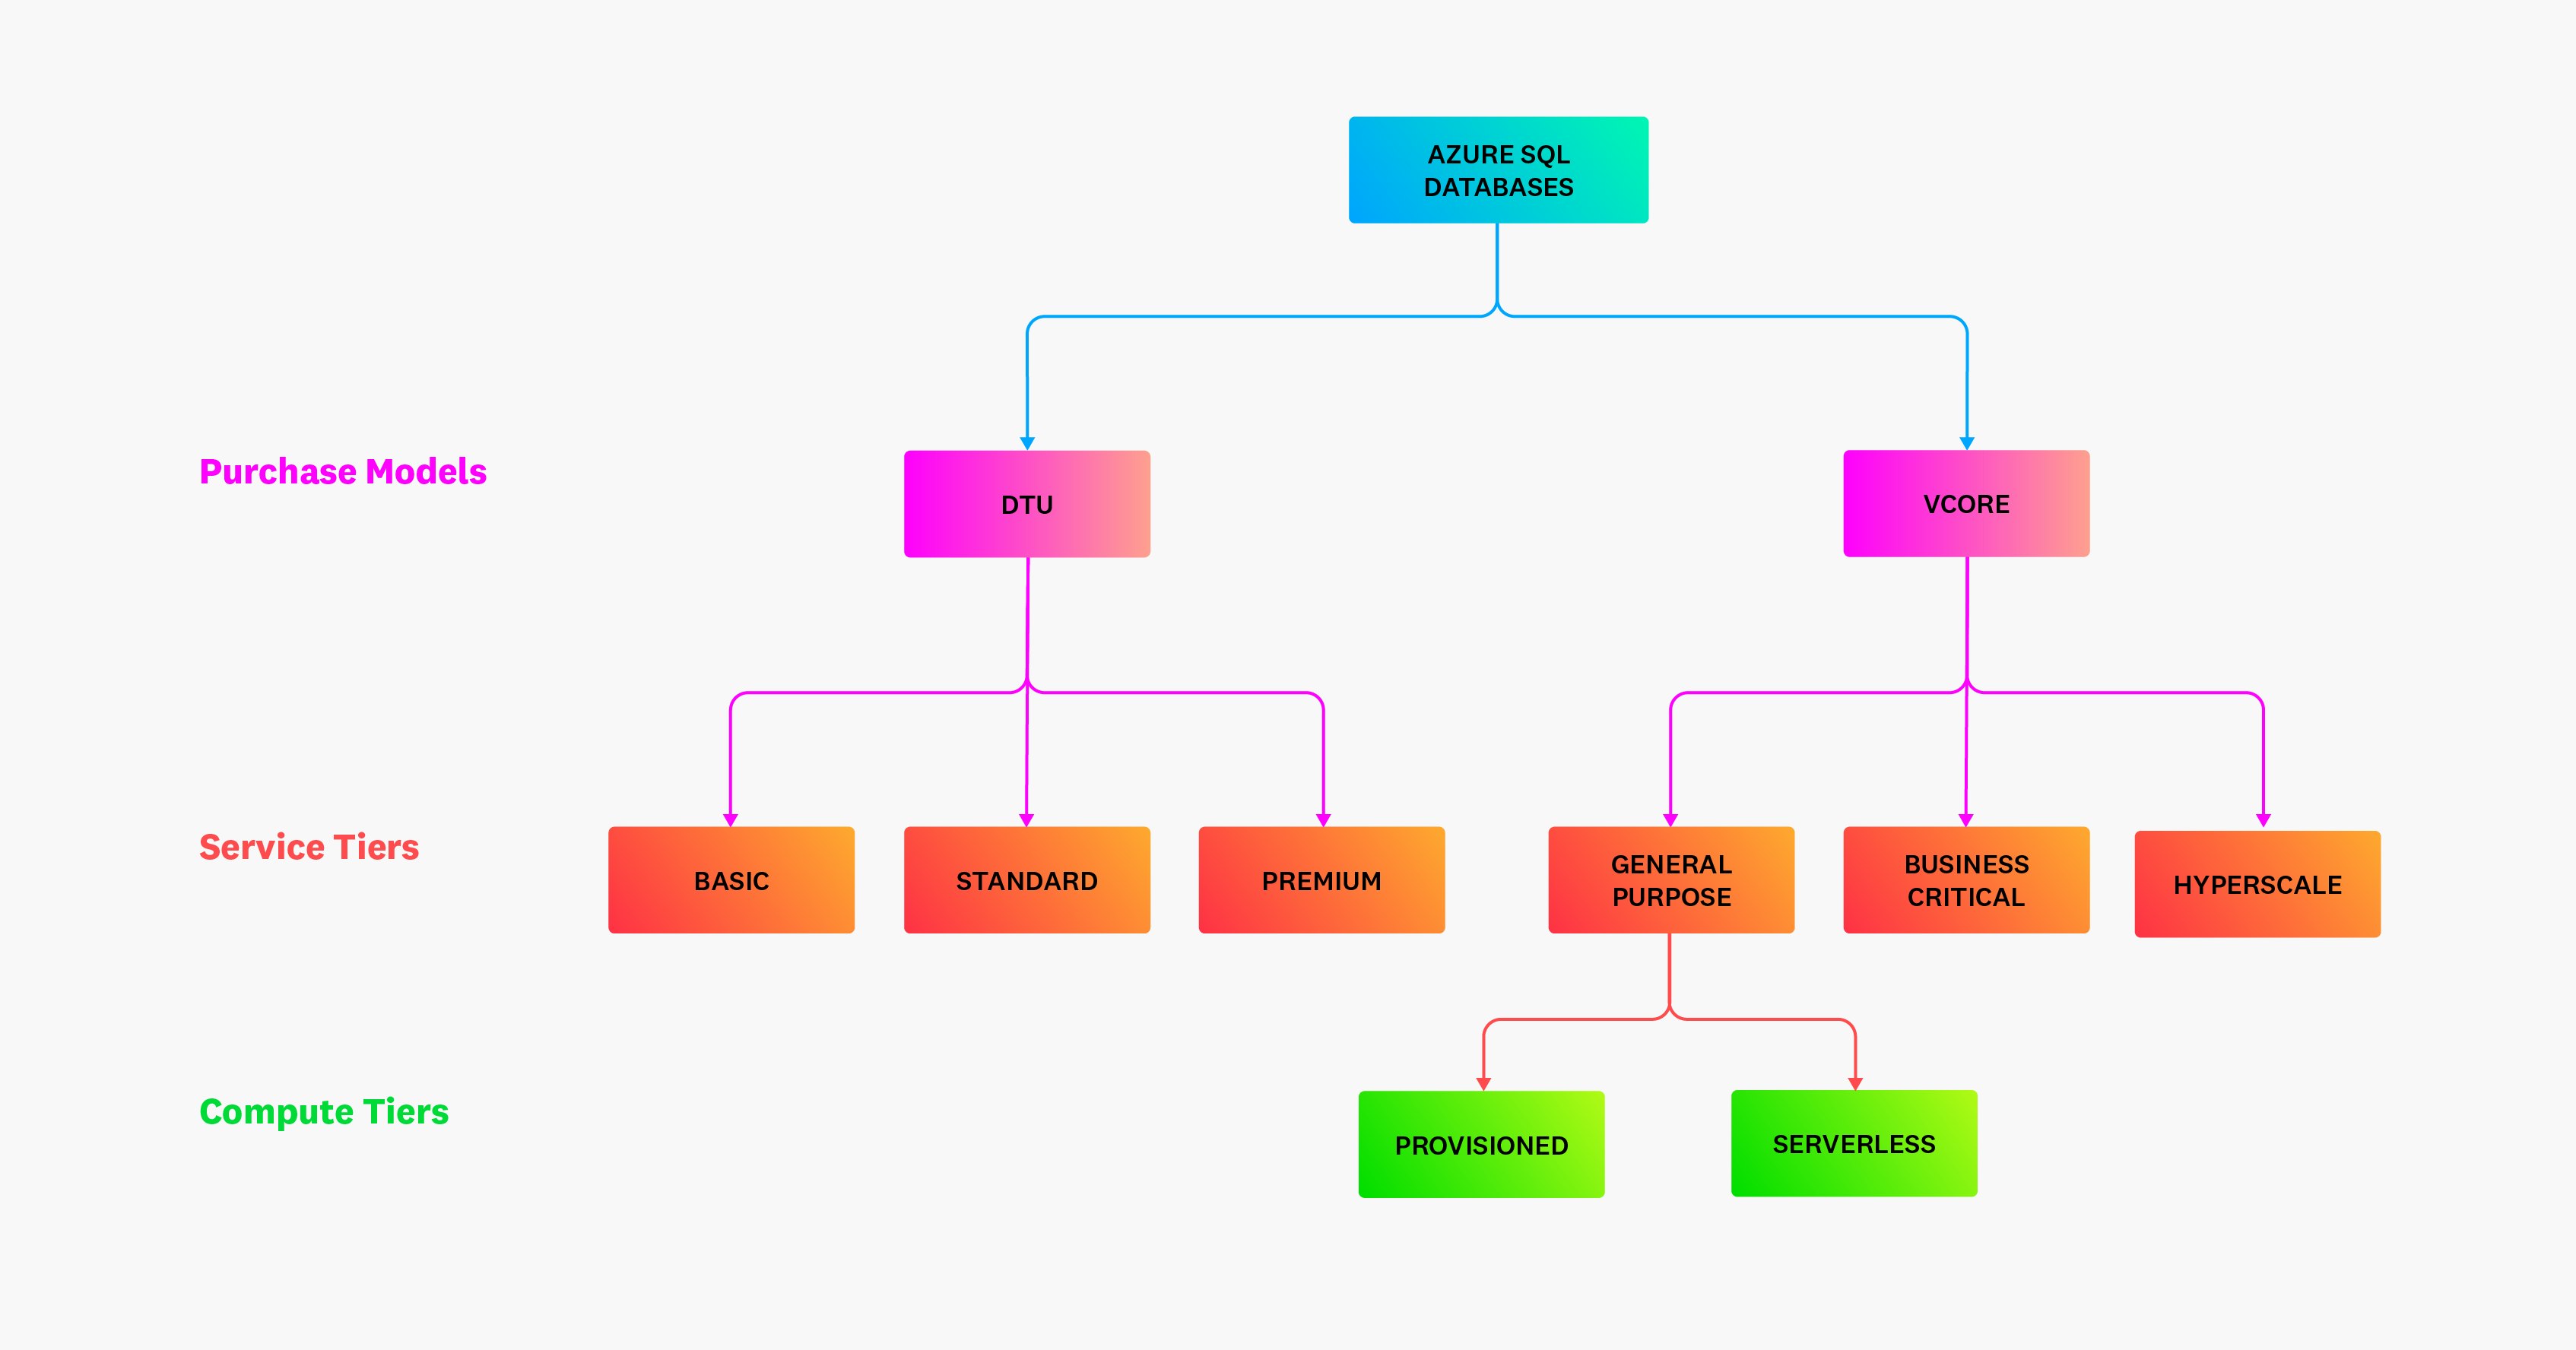
There are two available purchase models for Azure SQL single database instances and pools: database transaction units (DTUs) and virtual cores (vCores). The DTU-based model offers choices of specific compute (measured in DTUs) and storage bundles based on Azure's Basic, Standard, and Premium service tiers. Which tier you choose will dictate the resource limits for that database.
The vCore model is recommended for more complex workloads. It offers two compute tiers: provisioned and serverless. With the provisioned compute tier, you can choose the exact amount of compute resources (measured in vCores) to provision for workloads, while the serverless tier enables you to auto-scale available compute resources within a configured range and automatically pause databases when they are not active. This tier is best suited for database instances that have unpredictable usage patterns, including frequent periods of inactivity, and newly launched database instances that have no usage history and therefore are more difficult to adequately size.
Understanding your databases' resource utilization and availability involves monitoring the following performance metrics:
- Compute metrics: CPU and DTU limits and usage
- Storage metrics: storage limits and usage
- Request metrics: availability of database workers and sessions to process requests
Monitoring these metrics helps ensure that you are using the appropriate service tier for your workloads, whether you are using serverless databases, single database instances, elastic pools, or a combination.
Compute metrics
| Name | Description | Metric type |
|---|---|---|
| CPU percentage | Percentage of vCores in use, based on the service tier | Resource: utilization |
| DTU percentage | Percentage of DTUs in use, based on the service tier | Resource: utilization |
| CPU limit | Total number of vCores allocated to a database | Resource: other |
| DTU limit | Total number of DTUs allocated to a database | Resource: other |
| App CPU percentage | Percentage of vCores in use, based on total number of vCores allocated in the serverless tier | Resource: utilization |
| Memory percentage | Percentage of memory in use | Resource: utilization |
| App CPU billed | Amount of compute billed (in vCore seconds) | Resource: utilization |
Metrics to alert on: DTU and CPU percentage vs. DTU and CPU limits
Your purchase model (DTU or vCore) will determine which utilization metric you should monitor. Both of these metrics measure the percentage of used compute resources for a provisioned or serverless database or elastic pool. Monitoring utilization—and alerting on high utilization—can help you determine if you are close to reaching the max number of vCores or DTUs you have allocated for your instance or pool (i.e., your DTU and CPU limits). Once a database hits these limits, active queries will time out.
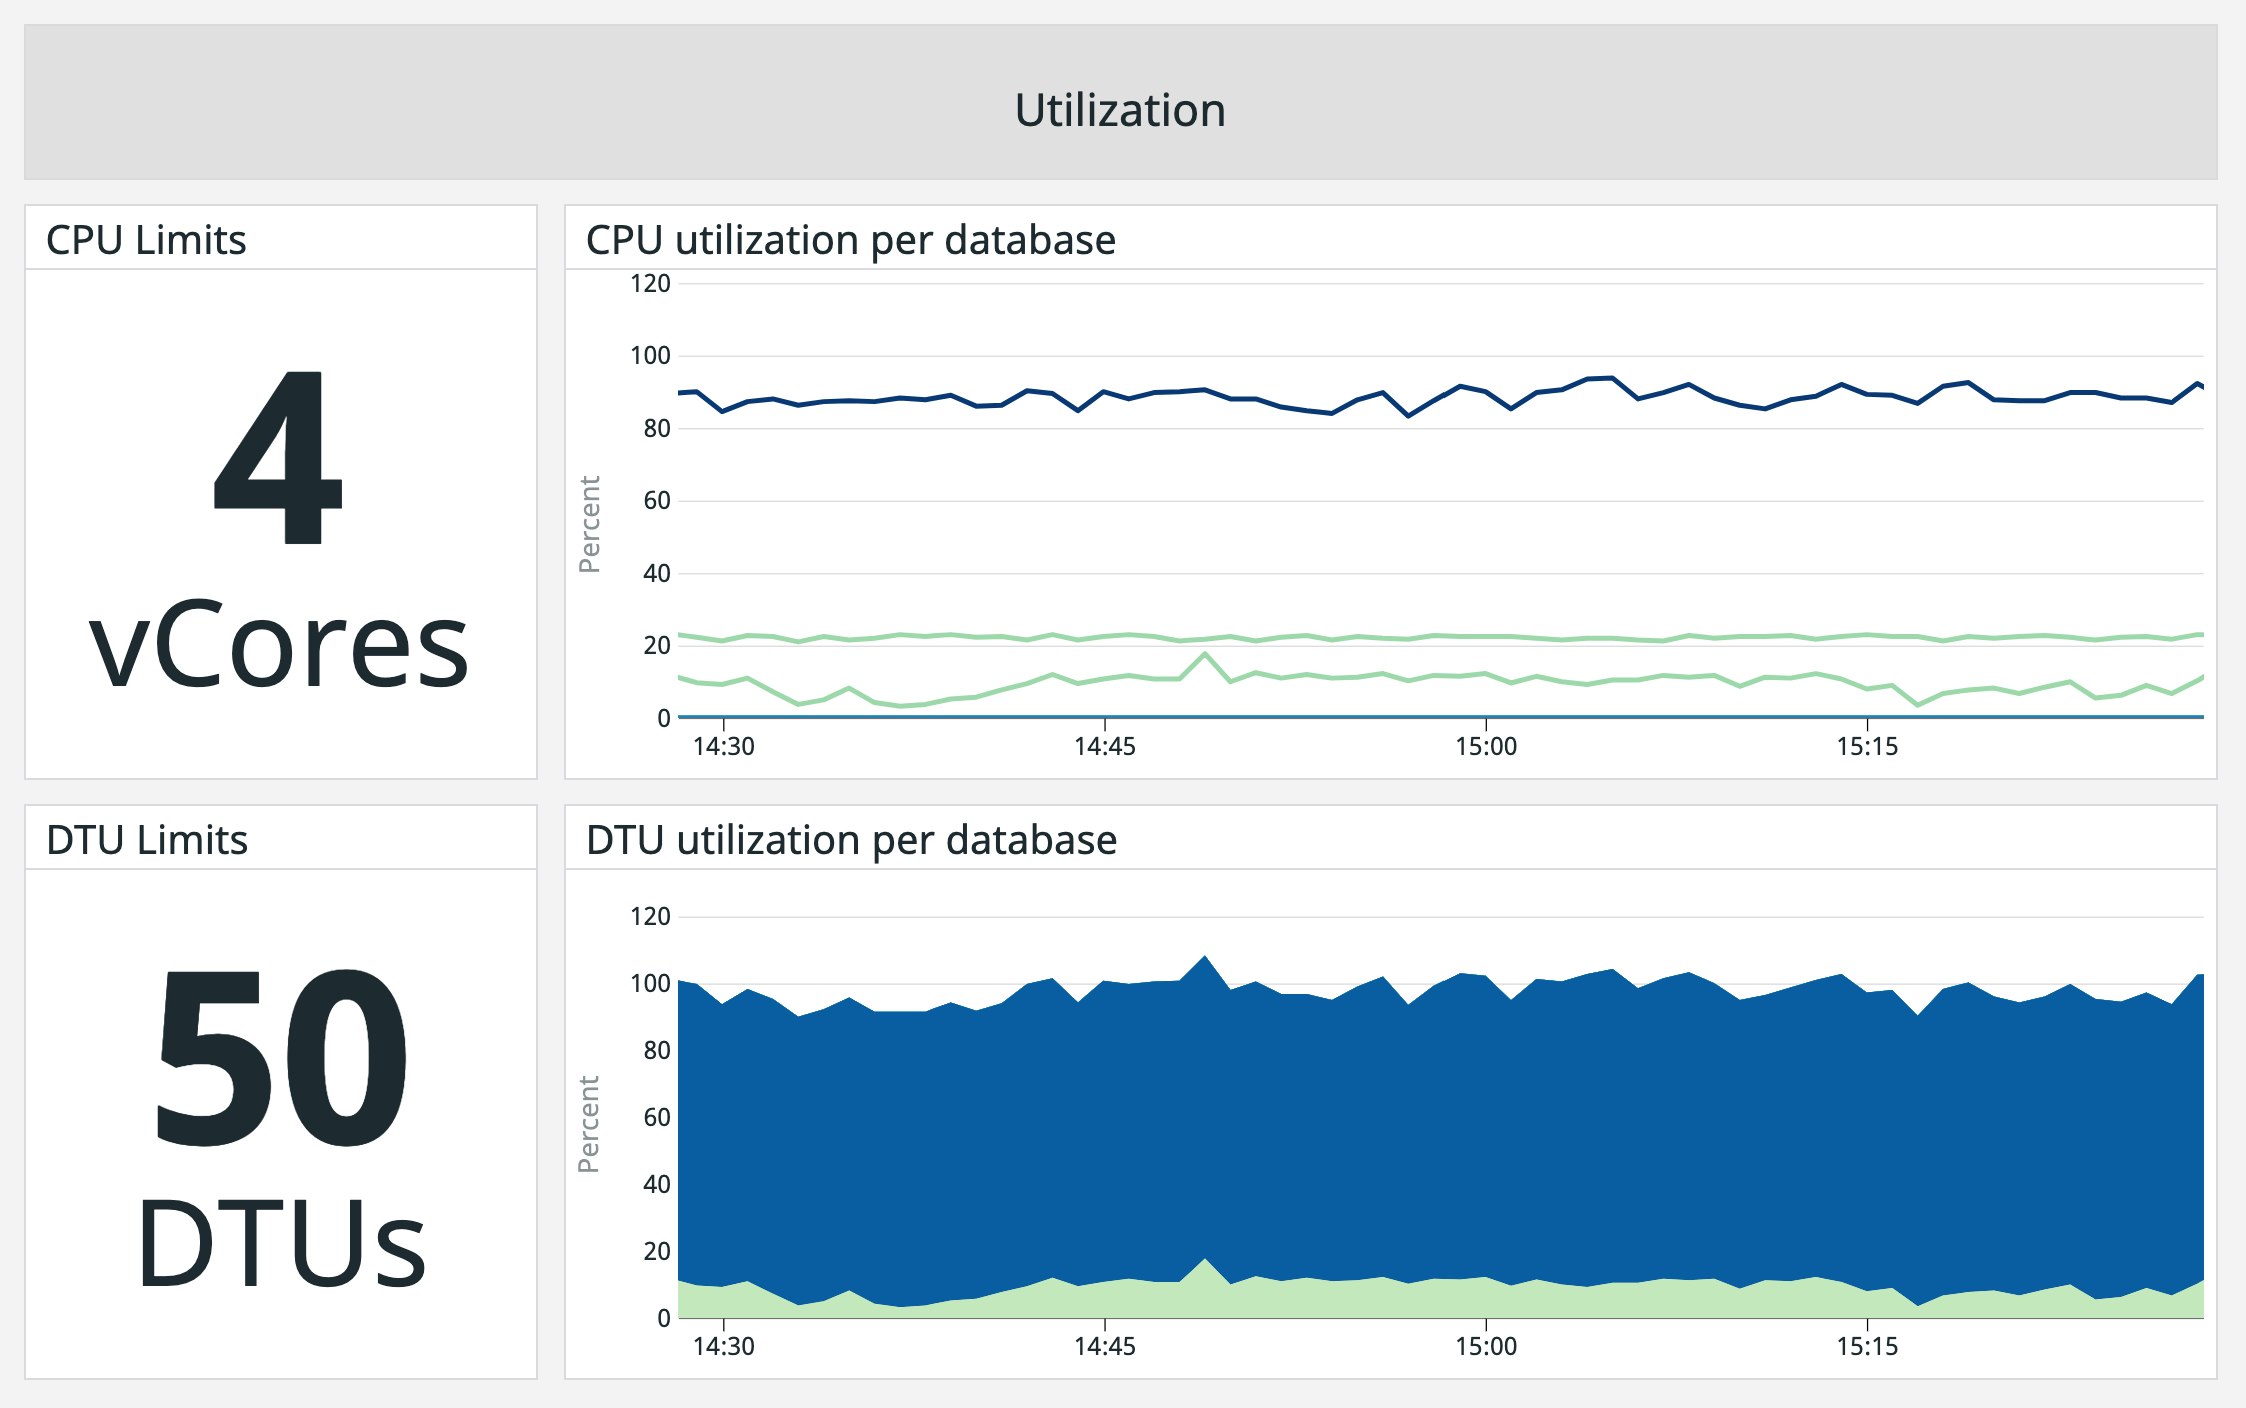
One potential cause of high CPU utilization is inefficient database queries. Inefficient queries consume more resources (e.g., CPU, memory, workers) and can create latency as your application must wait for your database to execute queries. If you see consistently high CPU and DTU utilization, correlating it with the percentage of available workers and seeing if that is also high can help you determine if inefficient queries are to blame. In these cases, you may need to scale a database's or pool's compute size to meet demand, or determine if you need to optimize query performance. Azure SQL Database resource logs can provide more details about query performance, such as runtime statistics and whether the query timed out, giving you more context for why you are seeing high utilization on a database instance.
Metrics to alert on: App CPU and memory percentage
When configuring a serverless-tier database, you define a minimum and maximum number of vCores that can be allocated to that database. The number of vCores the database uses automatically scales based on demand while staying within that range. This range also determines the service objective (i.e., compute size) that Azure uses for your database, which defines limits for other resources, such as memory and workers. App CPU percentage and memory percentage measure vCore and memory utilization for a serverless database, respectively, based on the maximum vCores you have configured and the resulting memory limit.
Monitoring app CPU percentage and memory percentage can help you determine if your serverless databases are under- or overutilizing resources. For instance, consistently low vCore utilization could indicate that you have allocated too many vCores for your database and can safely downsize. You can compare the app CPU percentage metric to metrics such as the percentage of running workers to determine if high utilization is caused by too many running queries or by a few long-running queries that need to be optimized.
Metric to watch: App CPU billed
The App CPU billed metric is used to calculate billing costs for serverless databases. Azure bills serverless-tier databases based on the amount of compute (i.e., CPU and memory) used per second and provisioned storage. App CPU billed only measures compute usage of active serverless databases. Serverless databases that are paused due to periods of inactivity are only charged for provisioned storage.
Serverless costs can change depending on database activity and resource consumption, so it's important to monitor this metric to ensure that you are aware of how much you are spending to host your serverless databases. If you are seeing higher costs, you can compare App CPU billed to your database's CPU and memory utilization to determine if there is an underlying issue that needs to be addressed, such as inefficient queries consuming too much CPU or memory.
Storage metrics
| Name | Description | Metric type |
|---|---|---|
| Storage percentage | Percentage of database space in use, based on the service tier | Resource: utilization |
| XTP storage percentage | Percentage of storage in use for in-memory online transaction processing | Resource: utilization |
| Storage | Amount of space allocated to a database | Resource: other |
Metric to alert on: Storage percentage vs. storage size
Having enough available database storage for updating or creating data is vital for your applications to perform properly. For example, if a database does not have adequate space to execute INSERT or UPDATE statements, clients will receive an error message, and the application will not be updated accordingly.
Azure databases are subject to the storage caps (i.e., your storage size) defined by the DTU and vCore purchase models, so setting alerts on a database's storage utilization (i.e., storage percentage) will help you know when it is about to run out of space. Mitigation steps such as shrinking database transaction logs, which can quickly consume available storage, can reclaim storage space if utilization is high.
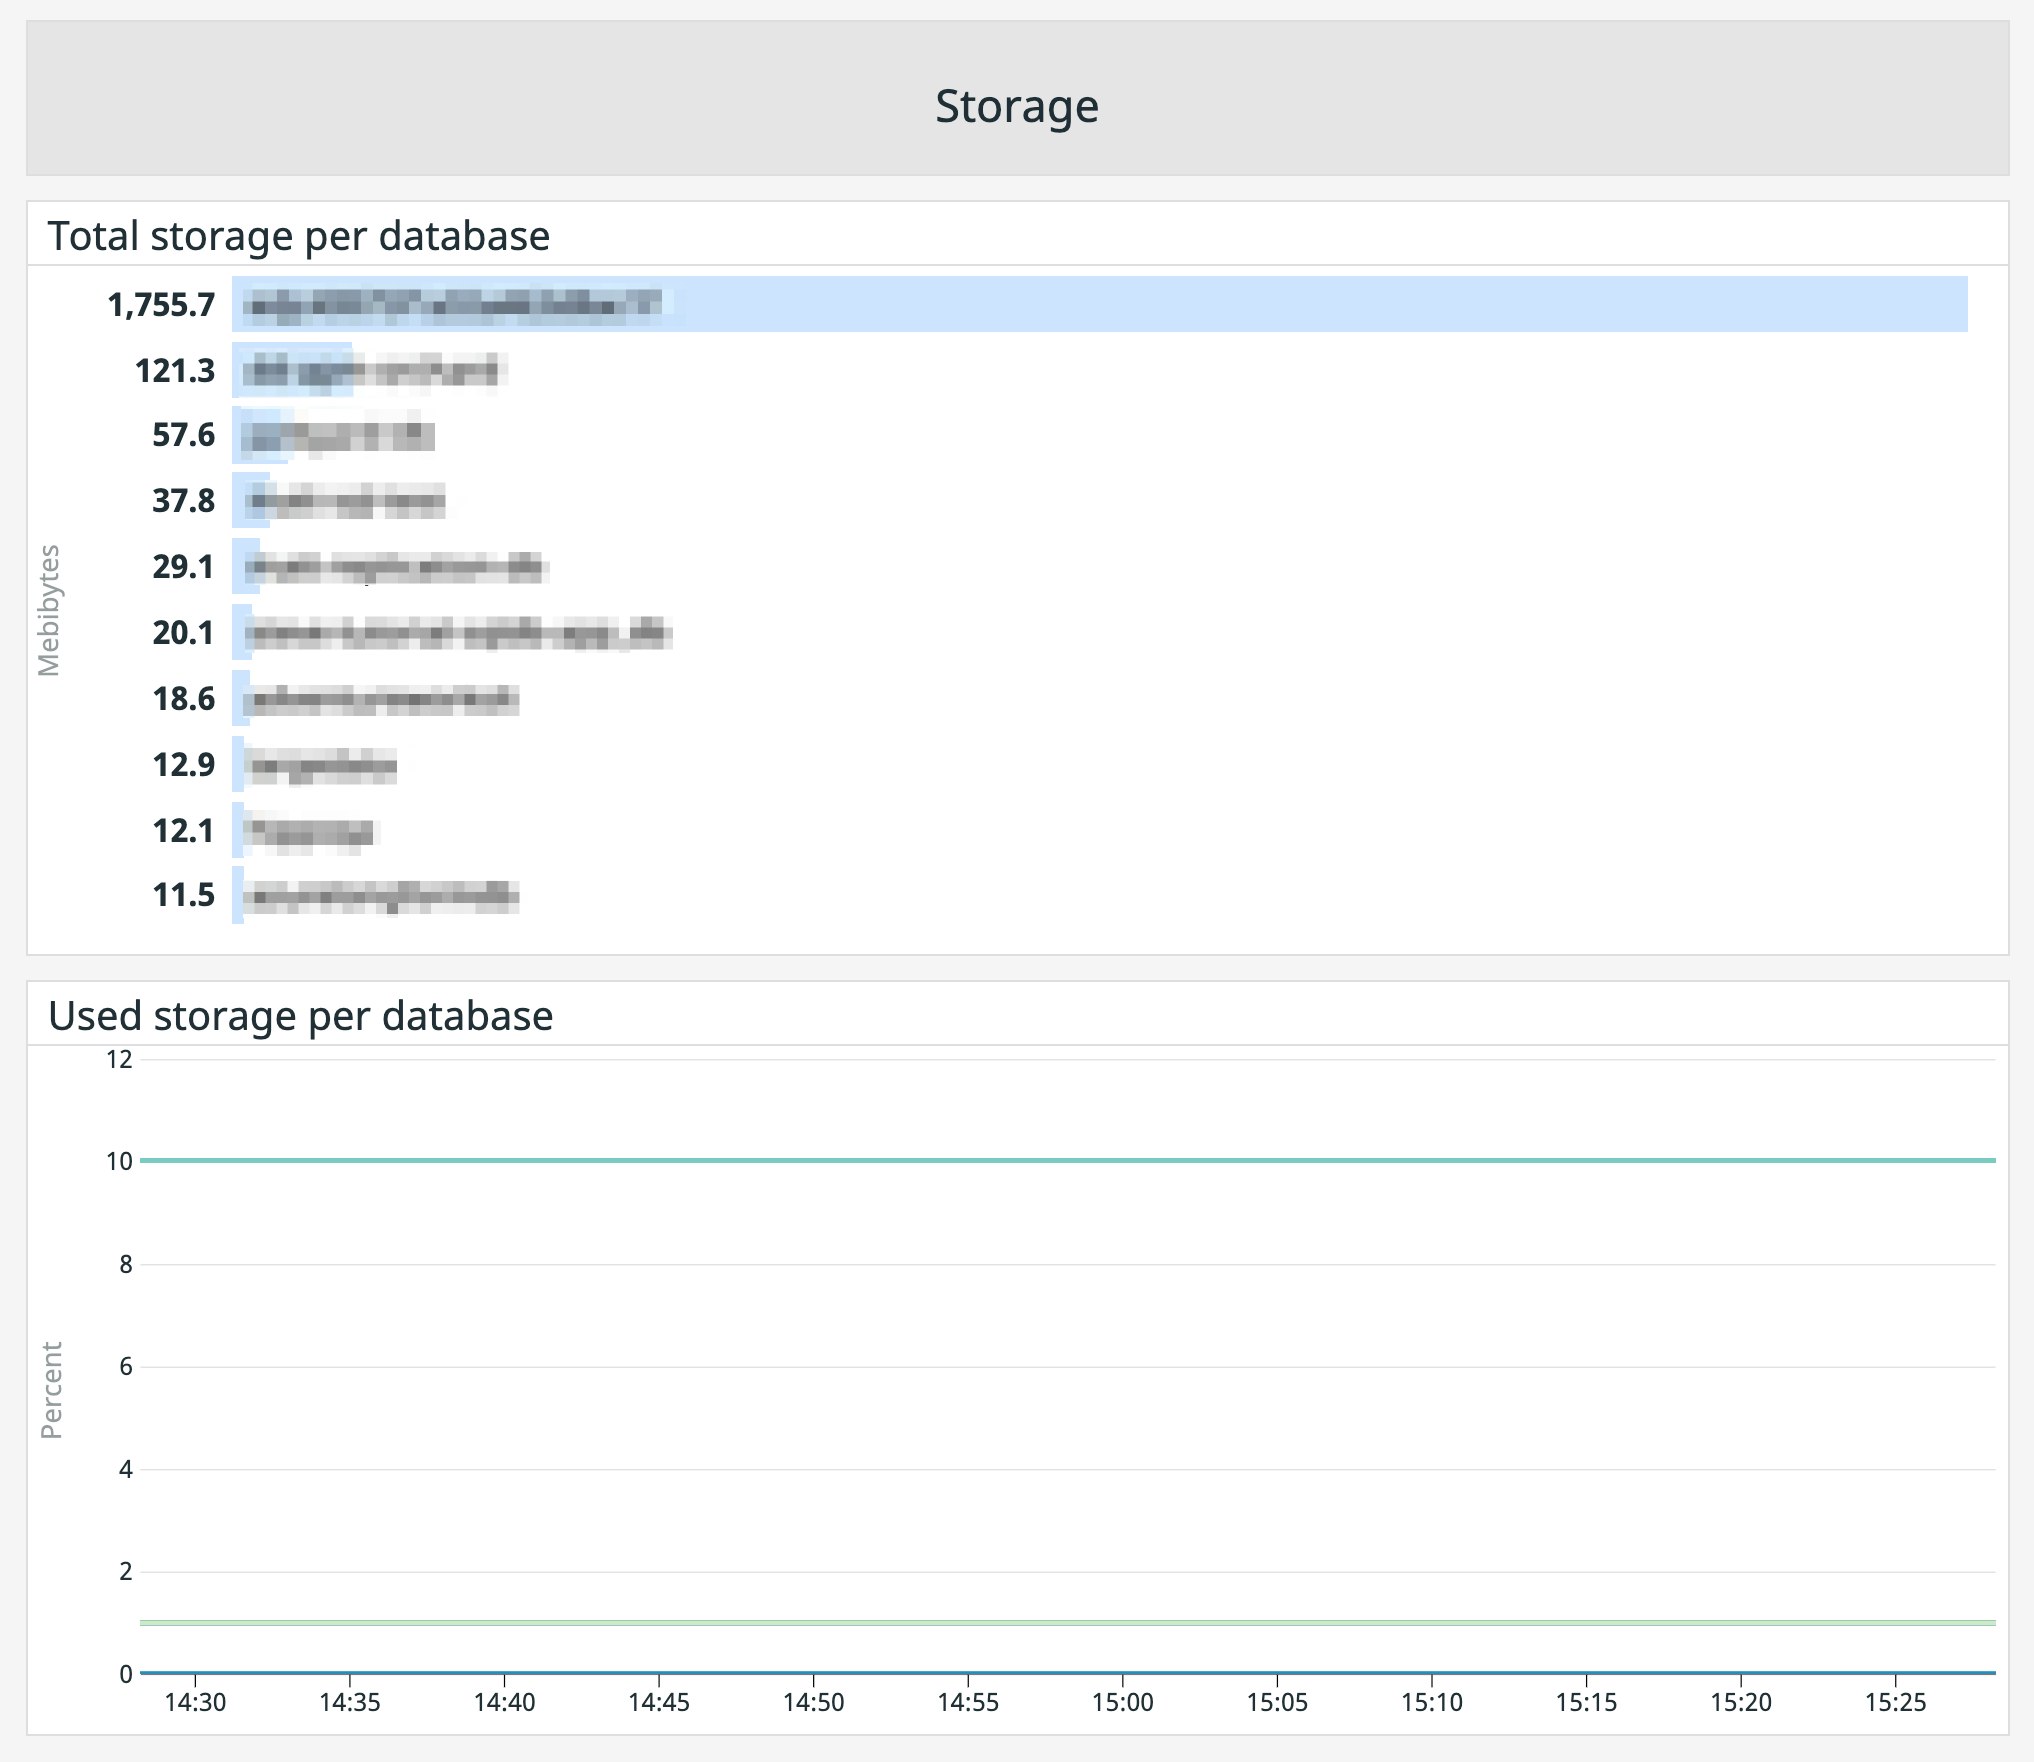
Comparing this metric with your database's storage size can also aid in capacity planning, which is the process of calculating the amount of resources needed to support workloads in order to optimize costs and performance. For example, you may be able to scale a database down to a service objective with a lower data size limit if storage utilization remains low over a period of time, which in turn reduces costs.
Metric to alert on: XTP storage percentage
Azure SQL Database offers in-memory online transaction processing (OLTP), which stores data in memory-optimized tables in order to improve application performance. This technology is available for Premium and Business Critical service tiers and is best suited for applications that ingest large volumes of data in a short amount of time, such as trading, gaming, or IoT services.
For databases using OLTP, as with other resources, there is a cap on in-memory storage that is based on DTU and vCore limits. Monitoring in-memory OLTP utilization (i.e., XTP storage percentage) can help ensure that optimized tables do not run out of space. Single and pooled databases that exceed their in-memory OLTP storage limits will generate errors and abort any active operations (e.g., INSERT, UPDATE, CREATE). If this happens, you can reclaim storage space by deleting data from memory-optimized tables or upgrade your service tier.
Request metrics
| Name | Description | Metric type |
|---|---|---|
| Workers percentage | Percentage of available workers in use, based on service tier limits | Resource: Utilization |
| Sessions percentage | Percentage of concurrent sessions in use, based on service tier limits | Resource: Utilization |
| Deadlocks | Total number of blocking queries running on a database | Resource: other |
Metrics to alert on: Workers and sessions percentage
Workers process incoming requests for databases (e.g., queries, logins, logouts) and sessions are active connections to a database. The maximum number of concurrent workers and sessions each of your databases can support is based on your service tier and compute size. For example, the Basic tier allows a maximum of 300 concurrent sessions and 30 concurrent workers on a single database instance. When your database runs out of workers to process new requests, clients will receive an error message and the database will reject new queries until workers become available. Similarly, when the session limit is reached, the database will reject new connections.
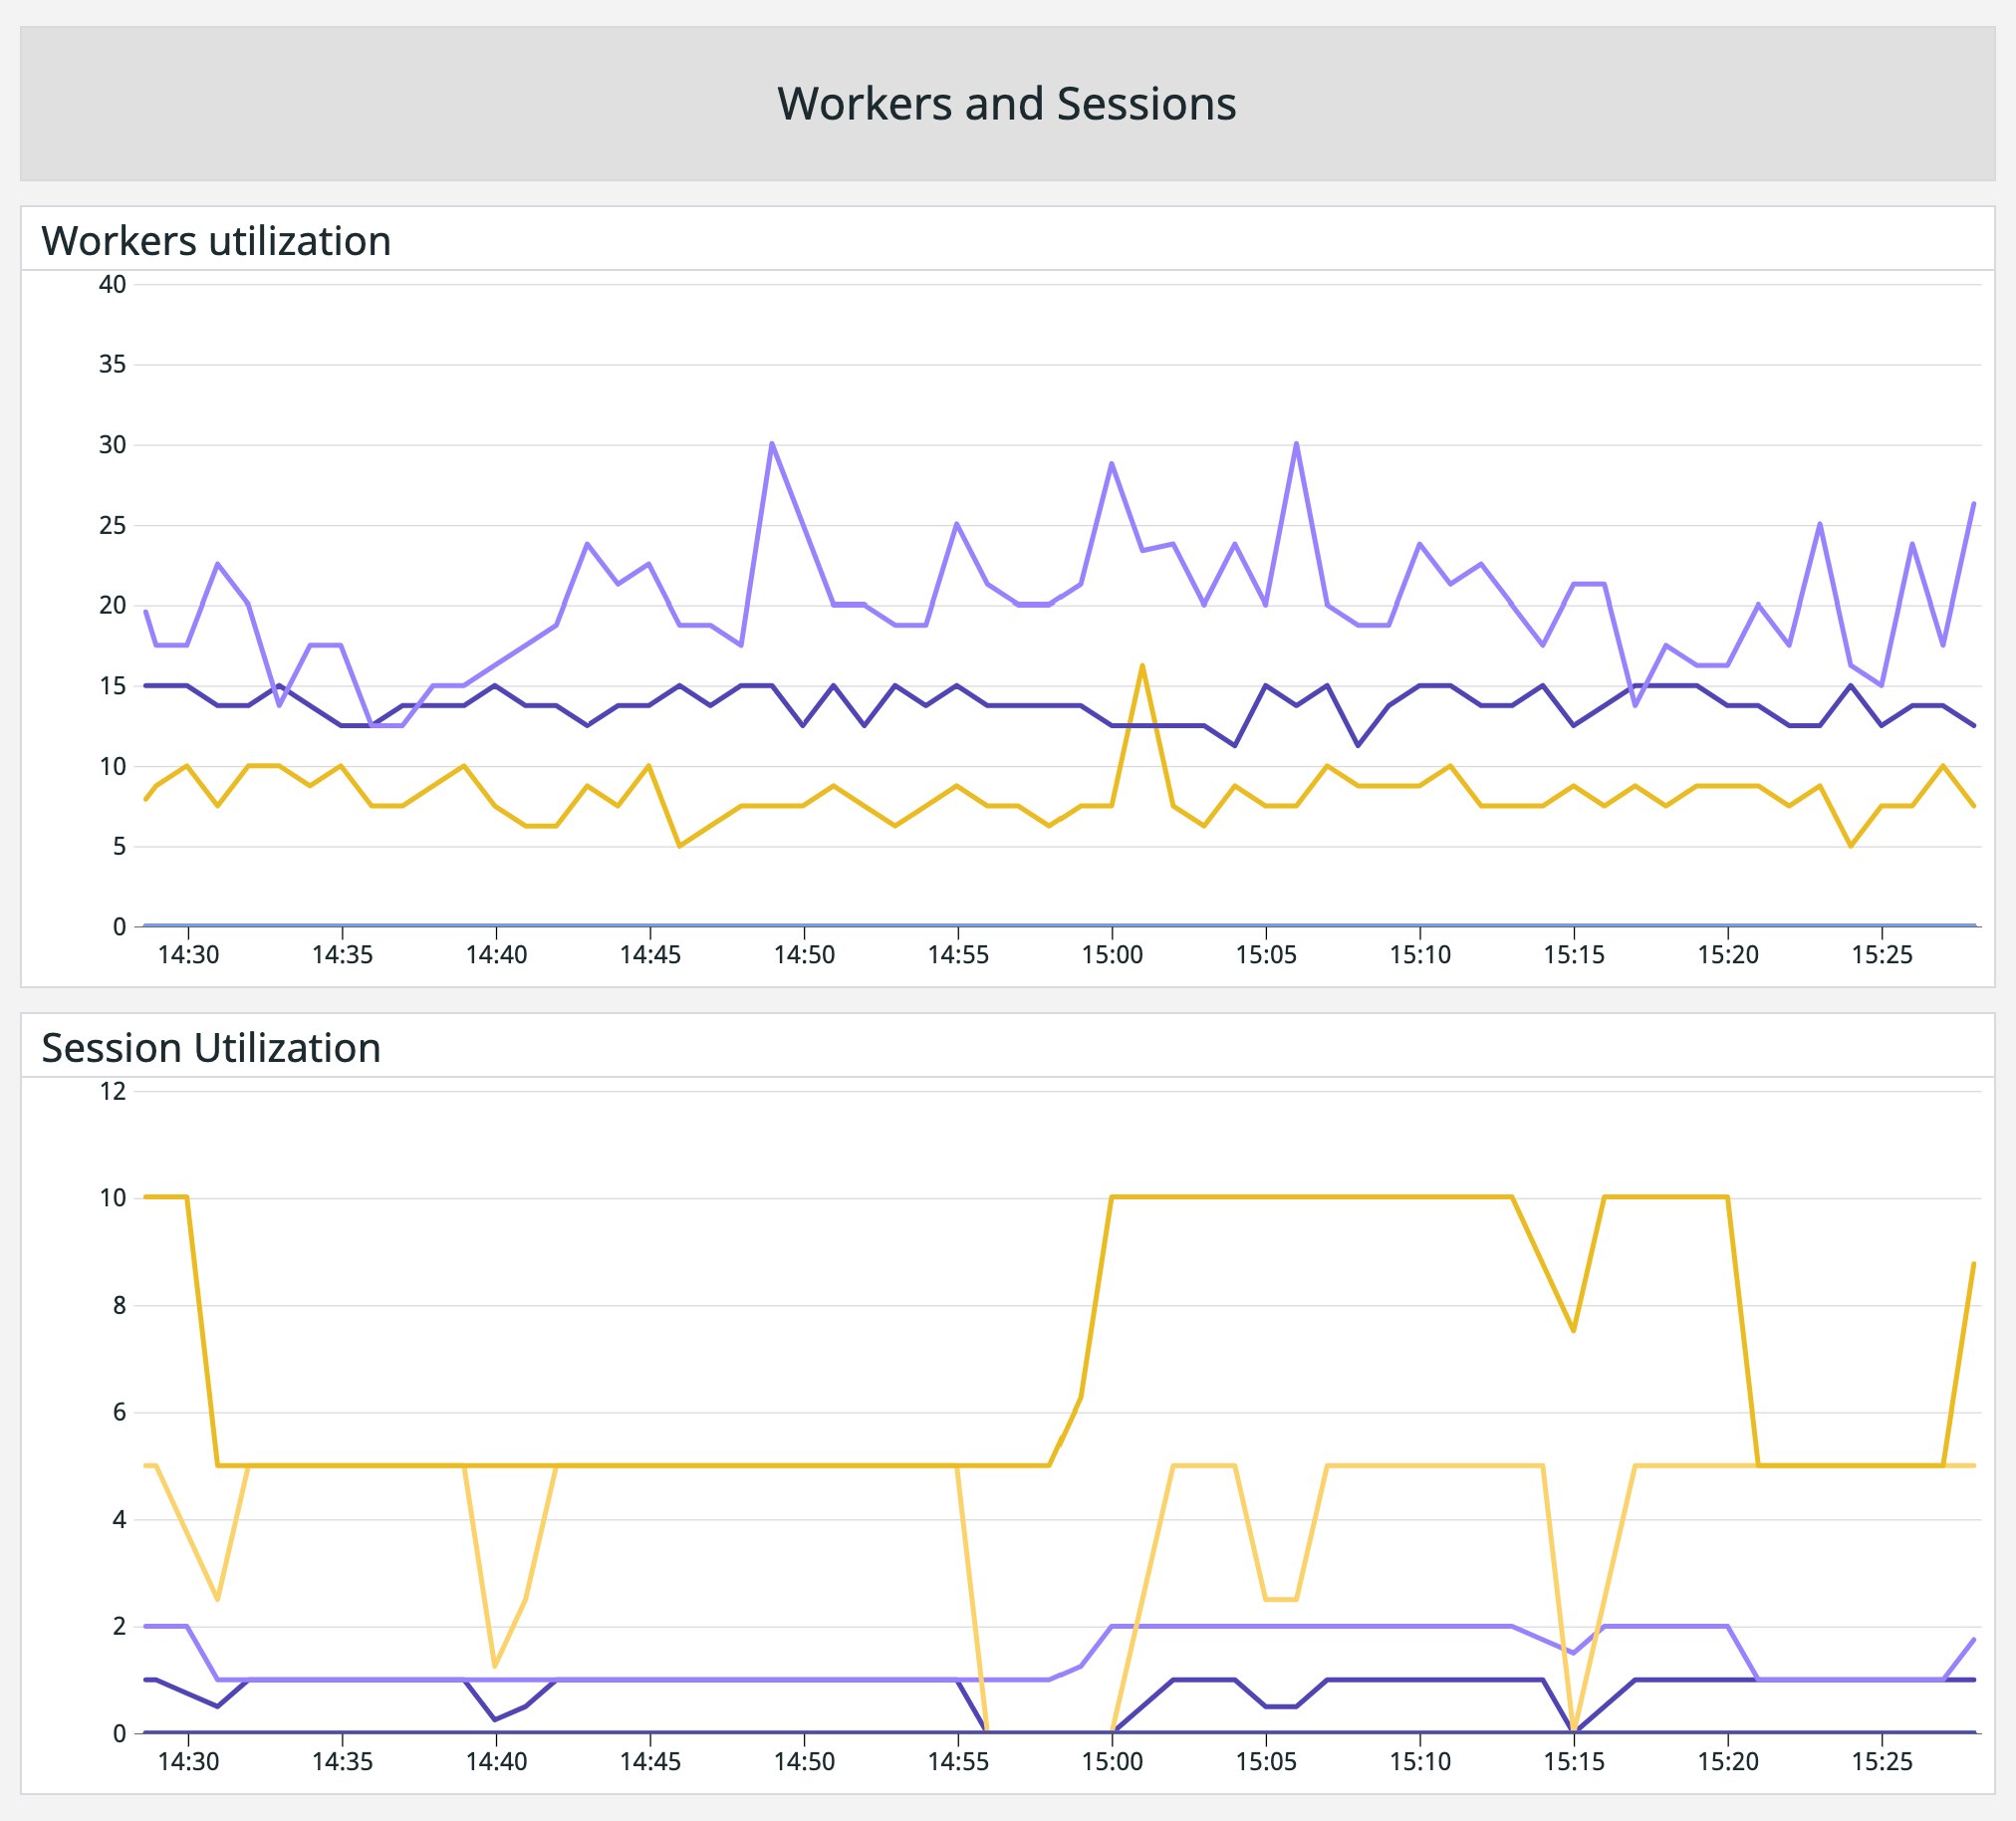
Monitoring session and worker usage alongside CPU utilization can help ensure that your databases are always able to process requests and enable you to determine if you need to optimize database queries. For example, high utilization for all three resources could mean that your database is underprovisioned, which can increase the amount of time it takes to process a request. In that case, you may need to upgrade to a different service tier. This ensures that you can run queries efficiently and avoid hitting tier limits.
High worker or session utilization could also be caused by a database attempting to process too many inefficient queries. These types of queries can consume more resources and hold workers from processing new requests. For instance, a service may initiate multiple workers to retrieve data for an end-user request—one to retrieve an initial record and another to retrieve record details. This workflow is often inefficient and can cause network and downstream server latency. You can optimize these workflows by combining the two requests in a stored procedure, which reduces the number of active workers dedicated to one query.
Metric to alert on: Deadlocks
Database deadlocks are caused when a transaction—a single unit of work, such as a request to connect to a database—holds a lock on resources (e.g., key, row, page, table) that another transaction needs, thereby blocking both transactions. When this happens, Azure SQL Database's underlying SQL server database engine will terminate one transaction to allow the other one to continue. An application can retry terminated transactions once the other transaction completes.

If you see an increase in deadlocks, you should investigate which queries are causing the lock. You can look at Azure's resource logs for more details about where the lock occurred, and use Azure's Query Performance Insight to identify the specific queries that created the deadlocks and review recommendations for optimizing them. Recommendations can include actions such as splitting long transactions into multiple smaller ones to reduce the time a database resource is locked by a query.
By monitoring key performance metrics, you can detect the early signs of issues in a database and determine if performance degradations are a result of inefficient queries or instances not having enough processing power or storage space to handle workloads. Next, we'll look at some key connectivity metrics that can help you monitor connections to your database and surface potentially malicious activity on a database instance.
Connectivity metrics
Each database instance or pool in your environment is managed by a database server that acts as an administrative hub for managing logins, firewall and threat-detection policies, audit rules, and more. This enables you to monitor connections to your databases and set appropriate access controls to protect them from anomalous activity, such as unauthorized access and SQL injections.
When a client makes a request to a database, a gateway redirects or proxies traffic to the appropriate database cluster. Once inside the cluster, traffic is forwarded to the right database. Gateways support redirect and proxy connection policies. With the redirect policy—which is recommended for improved latency and is the default policy for traffic from within Azure—the gateway routes initial client connections to the node hosting the database, then routes subsequent connections directly to the appropriate cluster. The proxy policy directs all traffic through the gateway and is the default policy for traffic outside of Azure.
To help you monitor database traffic and ensure that the gateway directs traffic to the appropriate databases, Azure generates the following metrics:
| Name | Description | Metric type |
|---|---|---|
| Connection failed | Total number of failed connections to a database at a given point in time | Other |
| Blocked by firewall | Total number of connections to a database blocked by your server's firewall at a given point in time | Other |
| Connection successful | Total number of successful connections to a database at a given point in time | Resource: Utilization |
Metrics to alert on: Connections failed and connections blocked by firewall
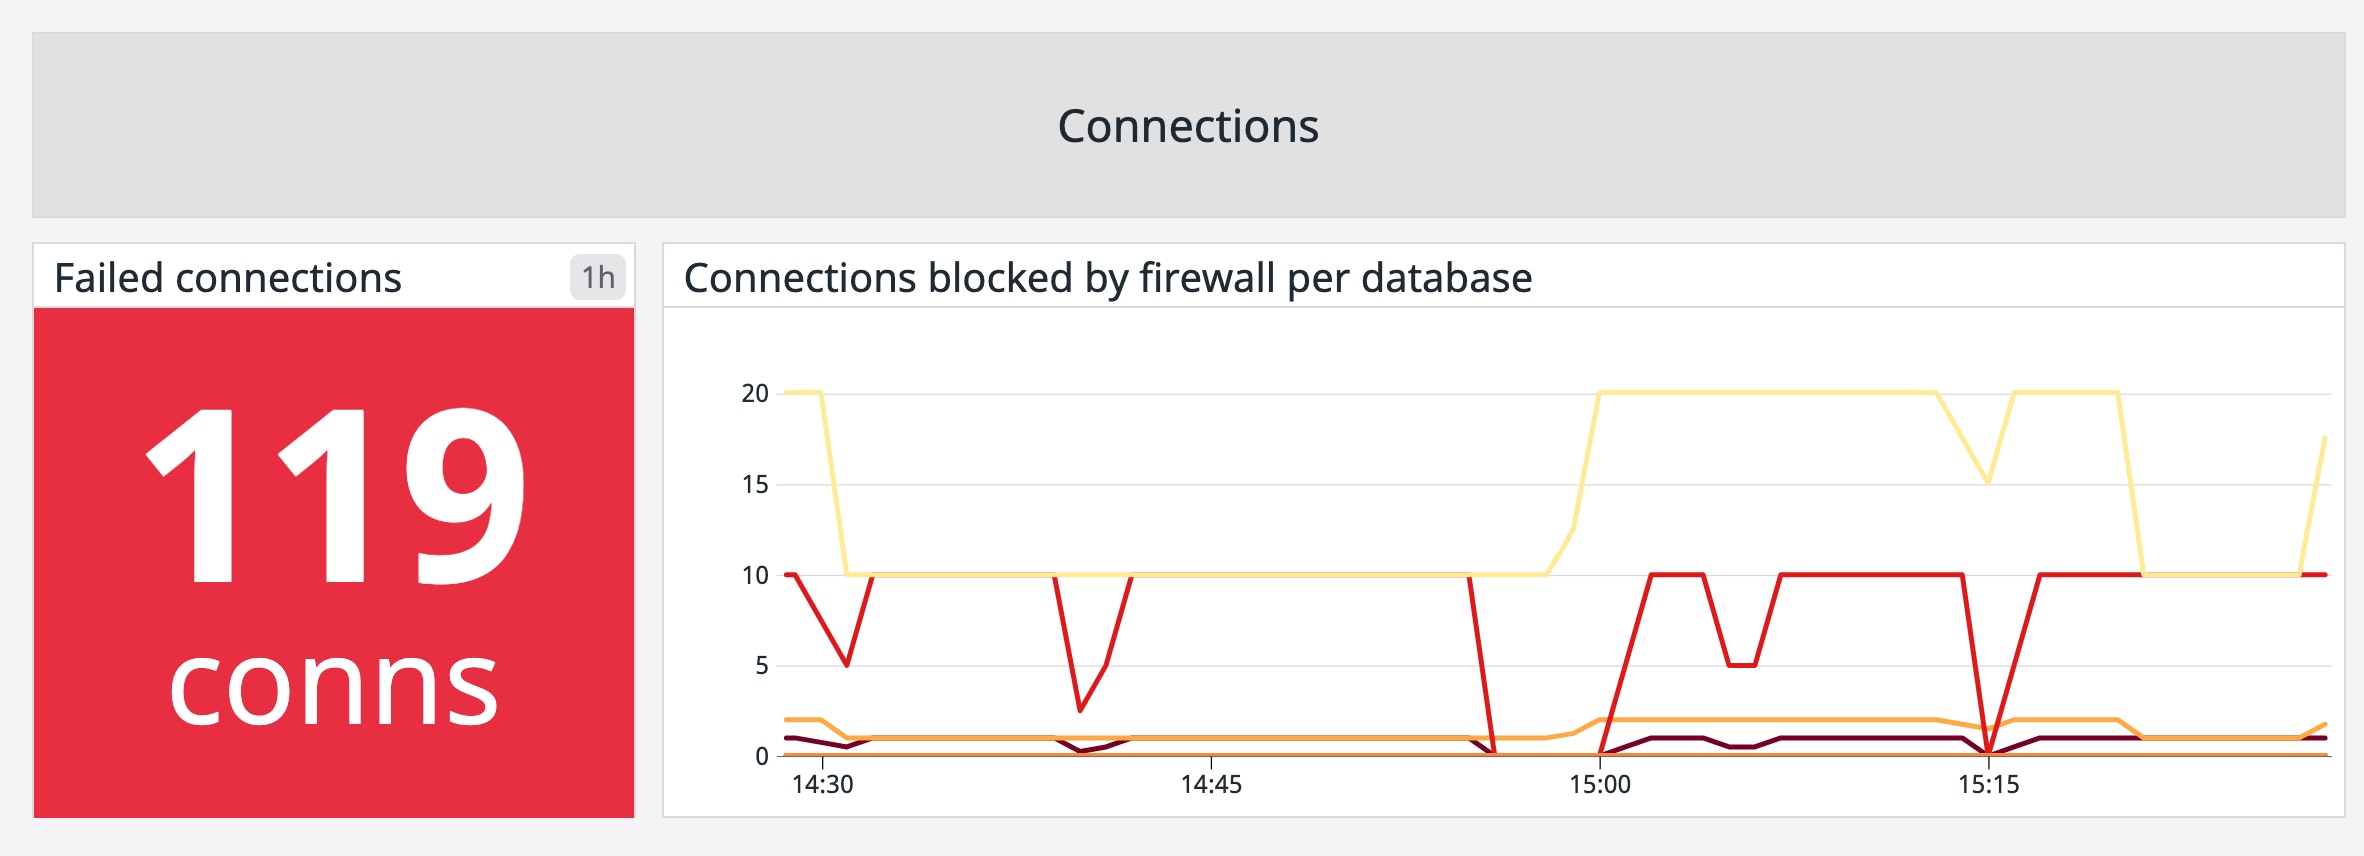
Azure tracks both the number of failed connections and the number of connections blocked by a firewall. Failed connections could be the result of transient errors or a database reaching resource limits, so creating an alert to notify you of any anomalies in this metric can help you resolve an issue before it affects users. A spike in the number of blocked connections, however, could be the result of a misconfigured firewall policy. You can troubleshoot further by reviewing your audit logs to find more details about who is attempting to connect to a database and determine if the user should have access or not.
Metric to watch: Connection successful
A sudden drop in successful connections means that services are not able to query your databases. You can compare this metric with the number of failed connections or connections blocked by a firewall to determine the root cause. For example, if the number of blocked connections is high, then the source of the issue could be the result of a firewall or network misconfiguration.
Alternatively, a sudden increase in the number of successful connections could indicate malicious activity, such as a distributed denial of service (DDoS) attack, which attempts to exhaust application resources by flooding them with requests. You can review your database audit logs to determine the source of these types of attacks (e.g., IP address, geographic location) then create a firewall rule to block them.
Connection metrics provide a high-level view of database traffic, but they do not offer insights into who is accessing a database and why they are accessing it. This makes it more difficult to determine if database traffic is coming from legitimate or potentially malicious sources. For more context into the users and services accessing a database and their actions, you can review audit logs, which we'll look at next.
Auditing and threat detection
Azure SQL Database provides several built-in security and compliance features, such as audit logging and threat detection, to help protect databases from an attack. Audit logs contain a record of all database actions and action groups, including:
- successful and failed logins
- executed queries and storage procedures
- changes to database ownership, permissions, schemas, and user passwords
Database instances use a default audit policy when you enable auditing, but you can configure the policy to suit your needs.
Threat detection alerts
Audit logs provide more information about potential security threats and can be used alongside other advanced features like threat detection alerts to speed up mitigation efforts. Alerts surface key details about database activity, such as the client's IP address, the name of the database that was accessed, the time it was accessed, and if the database contained sensitive data. Together, audit logging and threat detection provide a complete picture of database activity, including malicious activity, so you can ensure that your databases are not only performant but safe.
Better visibility into your Azure SQL databases
In this post, we looked at the key metrics and logs you need to monitor to fully understand the health and performance of your Azure SQL databases. In Part 2, we'll look at some of the tools Azure provides to collect and analyze database metrics, logs, and other activity.
Acknowledgment
We'd like to thank our friends at Azure for their technical reviews of this post.


