Michael Gerstenhaber
To make your dynamic container infrastructure more observable, Datadog is introducing a powerful new Live Container view that gives you insight into the status and performance of all your containers in real time.
Docker adoption is exploding; according to our recent survey, almost a fifth of our users run Docker-ized workloads, representing a growth of 40 percent over the previous year. Containers allow you to run services in isolation, with high fault tolerance, and with better provisioning of resources. However, because of short lifetimes and hardware-agnostic behavior, they pose new challenges in infrastructure monitoring.
Taking inspiration from bedrock tools like htop and ctop, Live Containers gives you complete coverage of your container infrastructure, in a continuously updated table with resource metrics at two-second resolution and faceted search. Coupled with Datadog’s integrations with Docker, Kubernetes, ECS, and other container technologies, plus our built-in tagging of dynamic components, this new Live Container view provides a detailed overview of your containers’ health, resource consumption, and deployment in real time.
We’re going to need a bigger barge
Our research shows that Docker hosts run seven containers each, on average. And the churn rate of these containers is nine times faster than VMs. On top of that, the average Docker user quintuples their container usage between their first and ninth month after adoption. That’s … a lot to monitor:
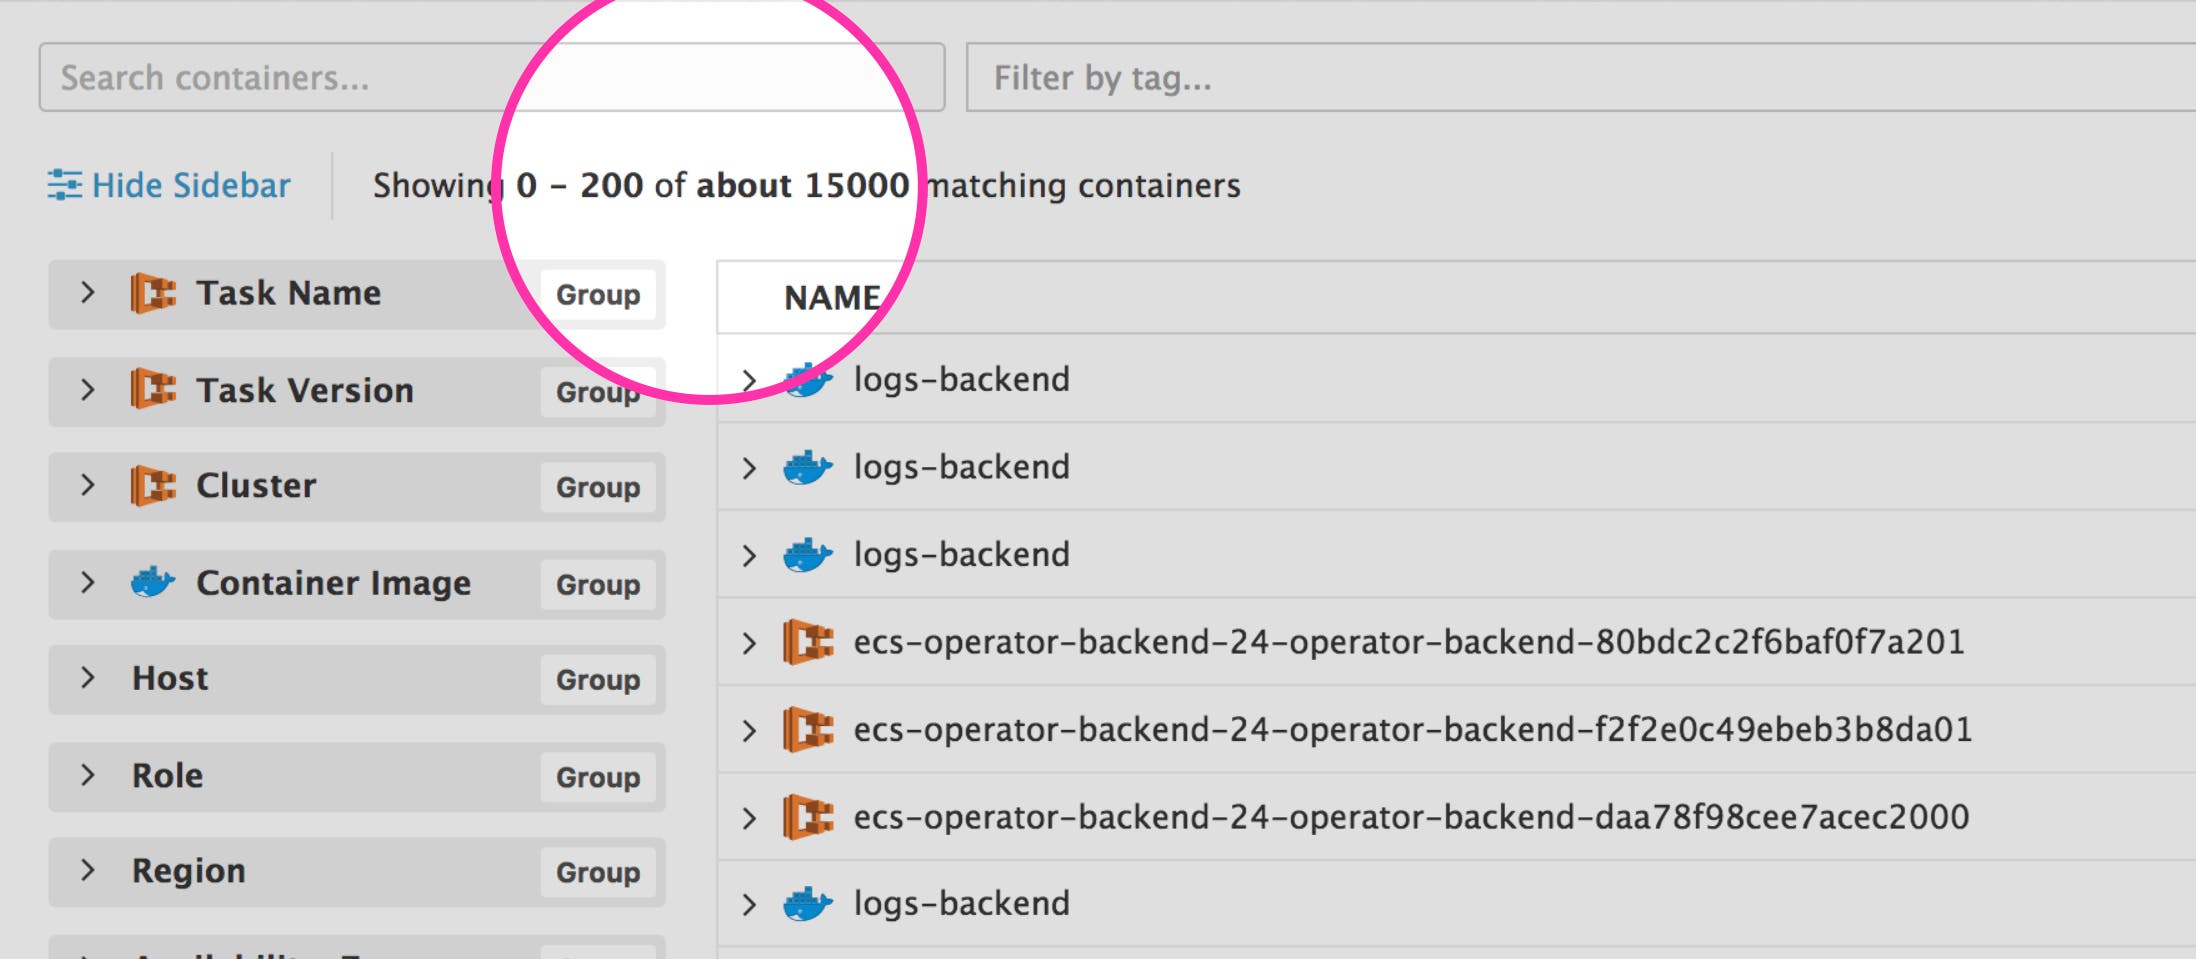
Further complicating the picture, through many popular orchestrators, Docker users are generally able to abstract their operations from the virtual or physical machines that containers run on. A container lives and dies wherever there are compute resources available to schedule it.
Isolate and investigate individual containers with Datadog's Live Container view.
Datadog’s tagging gives you the ability to cut through this complexity and focus on the layer you want to see. Use the Live Container view to filter to a specific Docker image, or pivot the table by Kubernetes service and namespace, or even host, and drill down from there. Integrations with popular orchestrators automatically detect and populate the facet explorer with integration-specific metadata and pull in container-level tags, so you can easily explore your container infrastructure on the fly.
In the above example, we group by host and by deployment, a tag that is automatically included from our Kubernetes integration.
Providing context
The table is an instantaneous look into your container ecosystem. If you need more extensive recent context we provide summary graphs that chart resource metrics for your containers over a longer timespan. In addition, each container can be inspected to see the behavior of an individual in the context of the group. This allows you to quickly identify your most resource-intensive containers or those that are behaving anomalously.
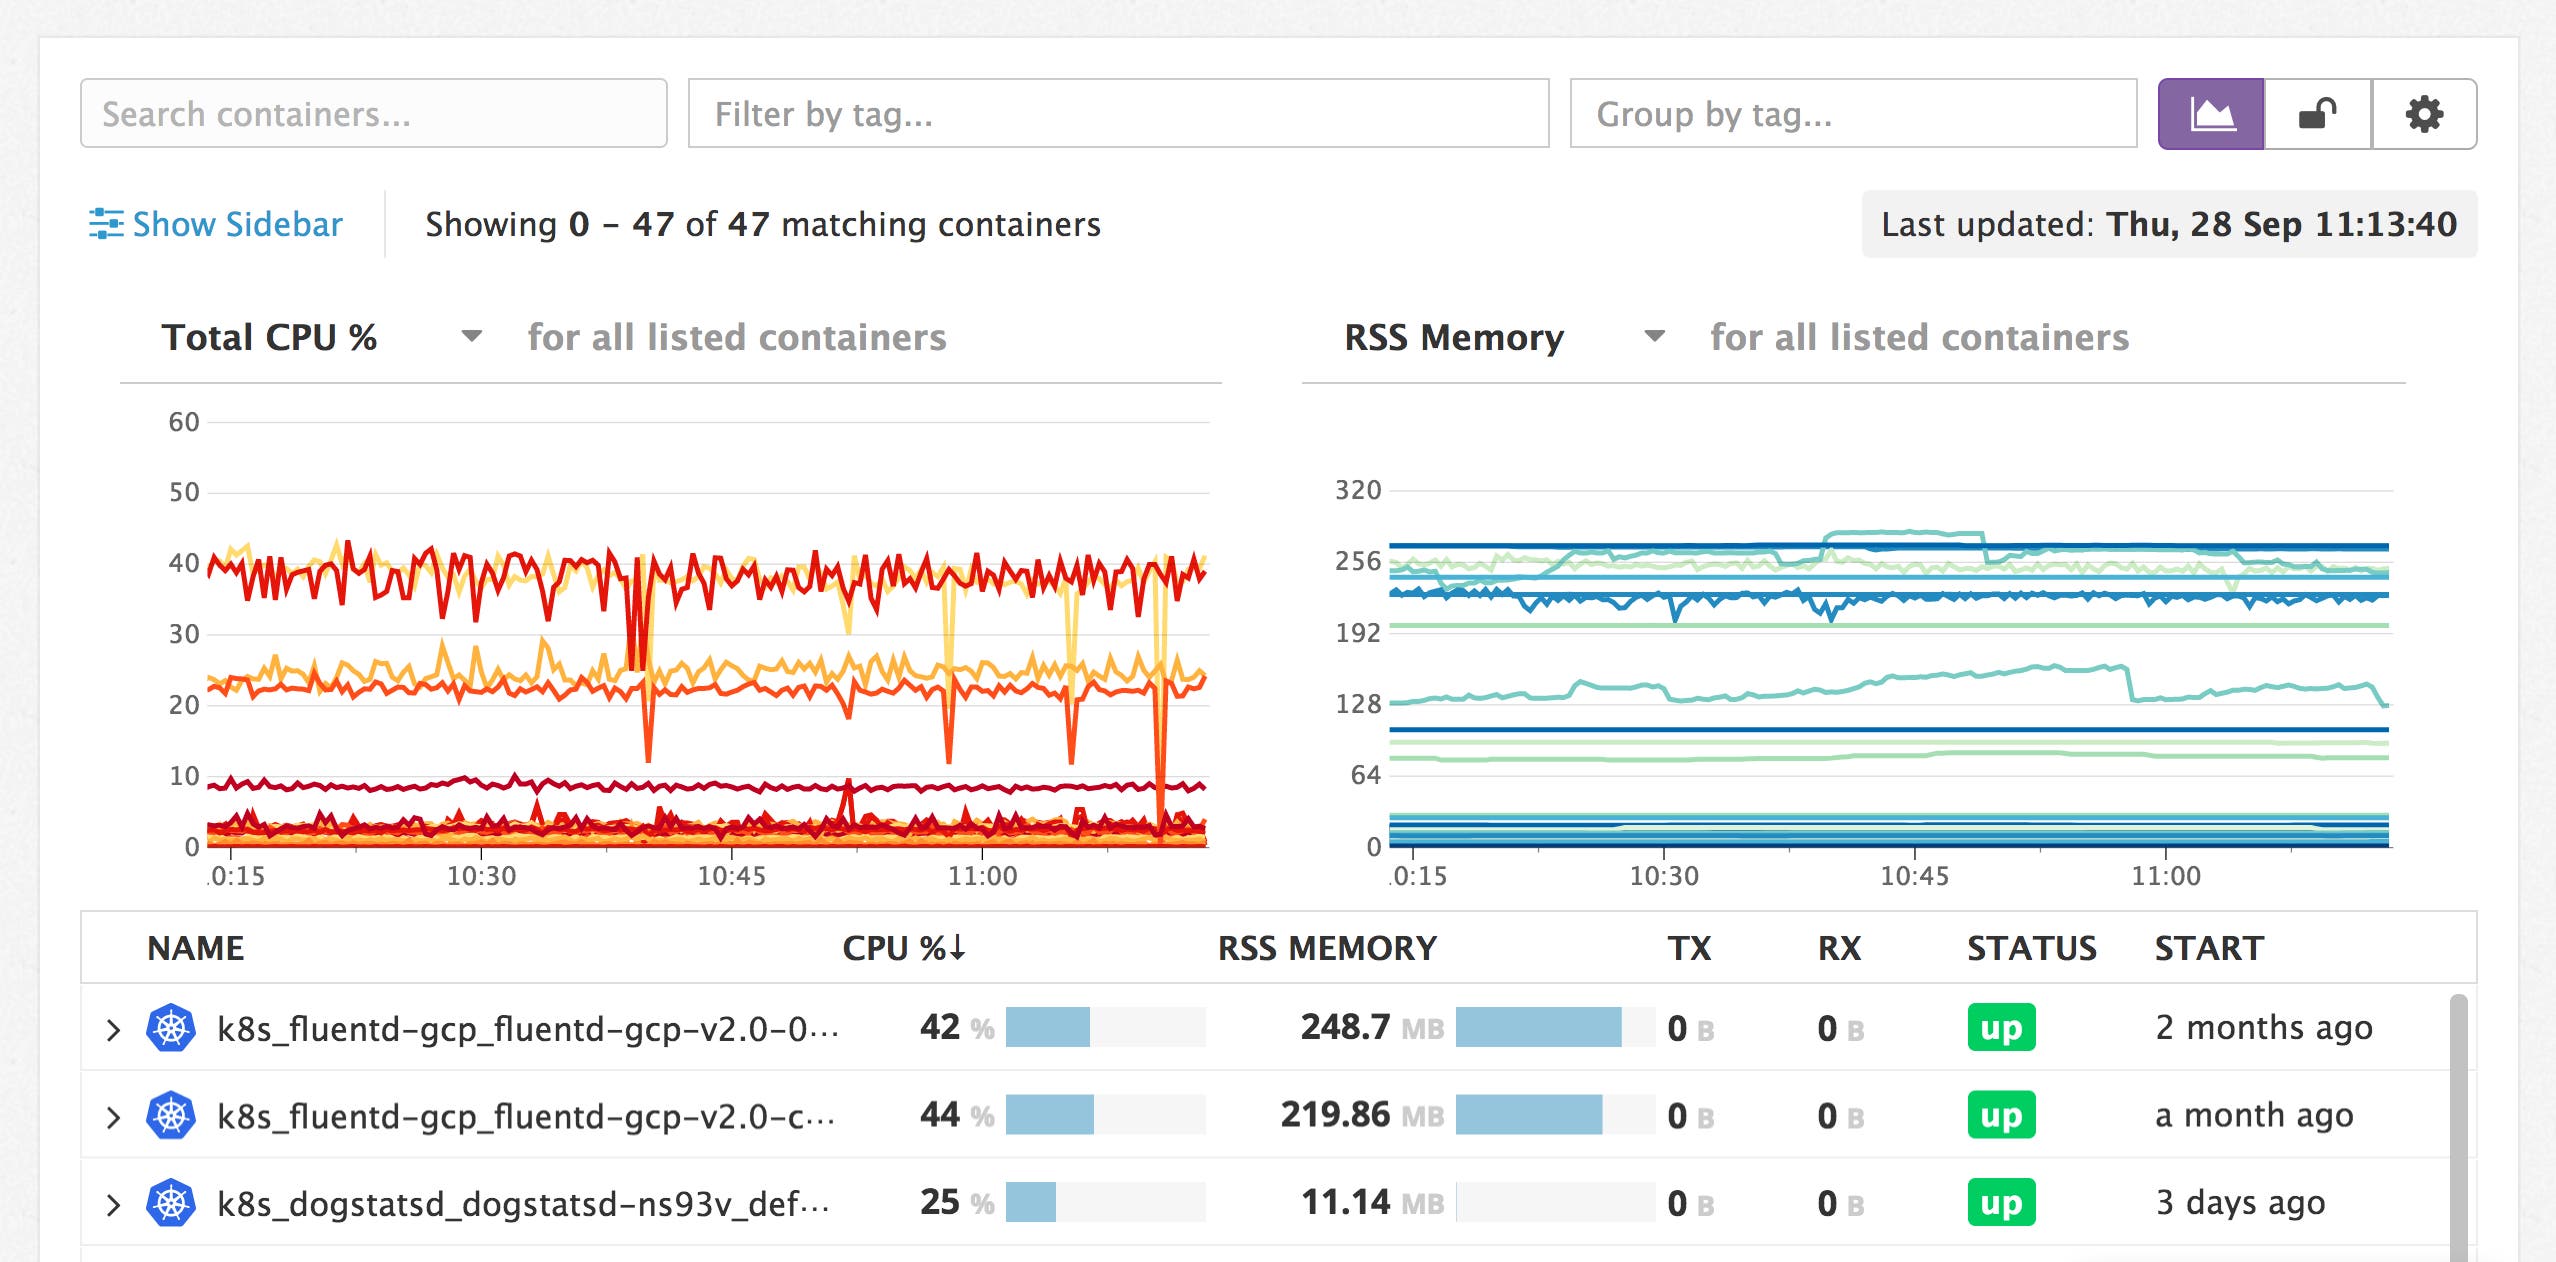
In the above example, you can see that CPU utilization can be highly volatile. Because of this, all real-time resource metrics on the Live Containers page are graphed at two-second resolution. That way, important spikes aren’t smeared out by longer-timespan averages.
Visibility into provisioning
All resource metrics in the Live Container view are reported in relation to their provisioned limits. Not only does this make it easy to see which components are nearing resource saturation, but it allows you to quickly see which containers might be overprovisioned so you can take steps to better allocate resources.
Getting started
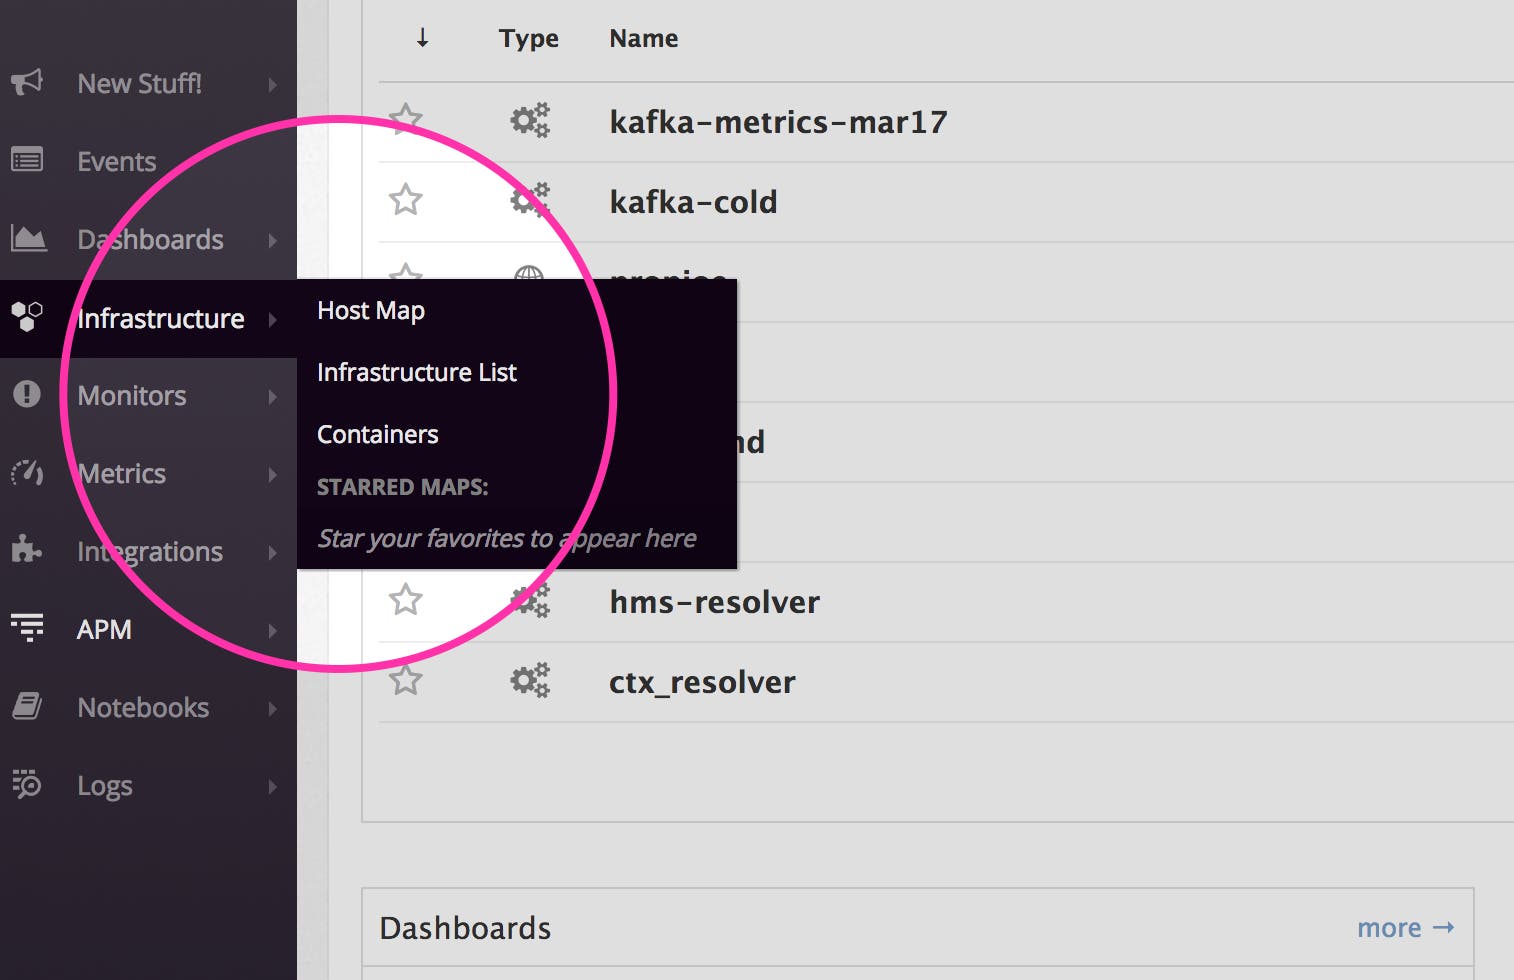
Whether you are just dipping your toe in, planning a major migration, or running full production workloads on containers, Datadog’s new Live Container view will help you understand your ecosystem, manage your provisioning, and debug effectively. To get started, all you need to do is update your Agent to version 5.17.2 or higher. Data collection for Live Containers is enabled by default, and you will find the new container view in your “Infrastructure” menu in the Datadog nav bar.
If you’re not already a customer, you can start a 14-day free trial to get deeper visibility into your container infrastructure today.


