Bowen Chen

Brooke Chen

Paige Andrews
As an engineering organization, you’re expected to deliver new software and products as fast as possible while maintaining standards for security, reliability, and performance. However, this can be difficult to achieve when developers need to spend valuable time tracking down the correct service owners and deployment instructions, waiting on other teams to fulfill requests to provision infrastructure, and trying to find clear-cut criteria to help them determine whether code is production-ready before seeking approval from platform engineering teams.
Datadog Internal Developer Portal (IDP) enables developers to ship software quickly and confidently by providing them with pre-approved self-service actions and delivery guardrails. Our IDP is a central hub for engineering knowledge, developer self-service tools, and live observability data, helping developers stay up-to-date with important changes and reduce context switching in their workflows.
In this blog, we’ll discuss how Datadog IDP empowers developers to do the following:
- Gain a dynamic view into their software systems and APIs with the Software Catalog
- Easily provision infrastructure, scaffold new services, and manage code changes and deployments with Self-Service Actions
- Follow engineering best practices and production-readiness standards at scale with Scorecards
Centralize observability, ownership, and engineering knowledge with the Datadog Software Catalog
When teams onboard new developers, build new systems, expand existing ones, or respond to incidents, they need easily accessible, up-to-date visibility into their systems. This includes information such as which team owns a service, how the service relies on other system components, and guardrails for deployments. Documentation of these systems and components—such as service maps, architecture diagrams, or deployment workflows—are often hidden within the service owner’s internal workspaces and are not guaranteed to be up to date.
Datadog Software Catalog serves as the foundation of the Datadog IDP and provides a centralized source of truth for your engineering organization. Software Catalog helps group related backend services, queues, datastores, and endpoints into systems and APIs, enabling your developers to better understand how each component plays a part in the greater system. Additionally, teams are able to define shared ownership, documentation, and on-call details for the components in each system that fall within their product ownership. This means that when responders get paged for customer impact, they can refer to Software Catalog to identify the other components within an impacted system and quickly loop in their service owners to help with remediation efforts.
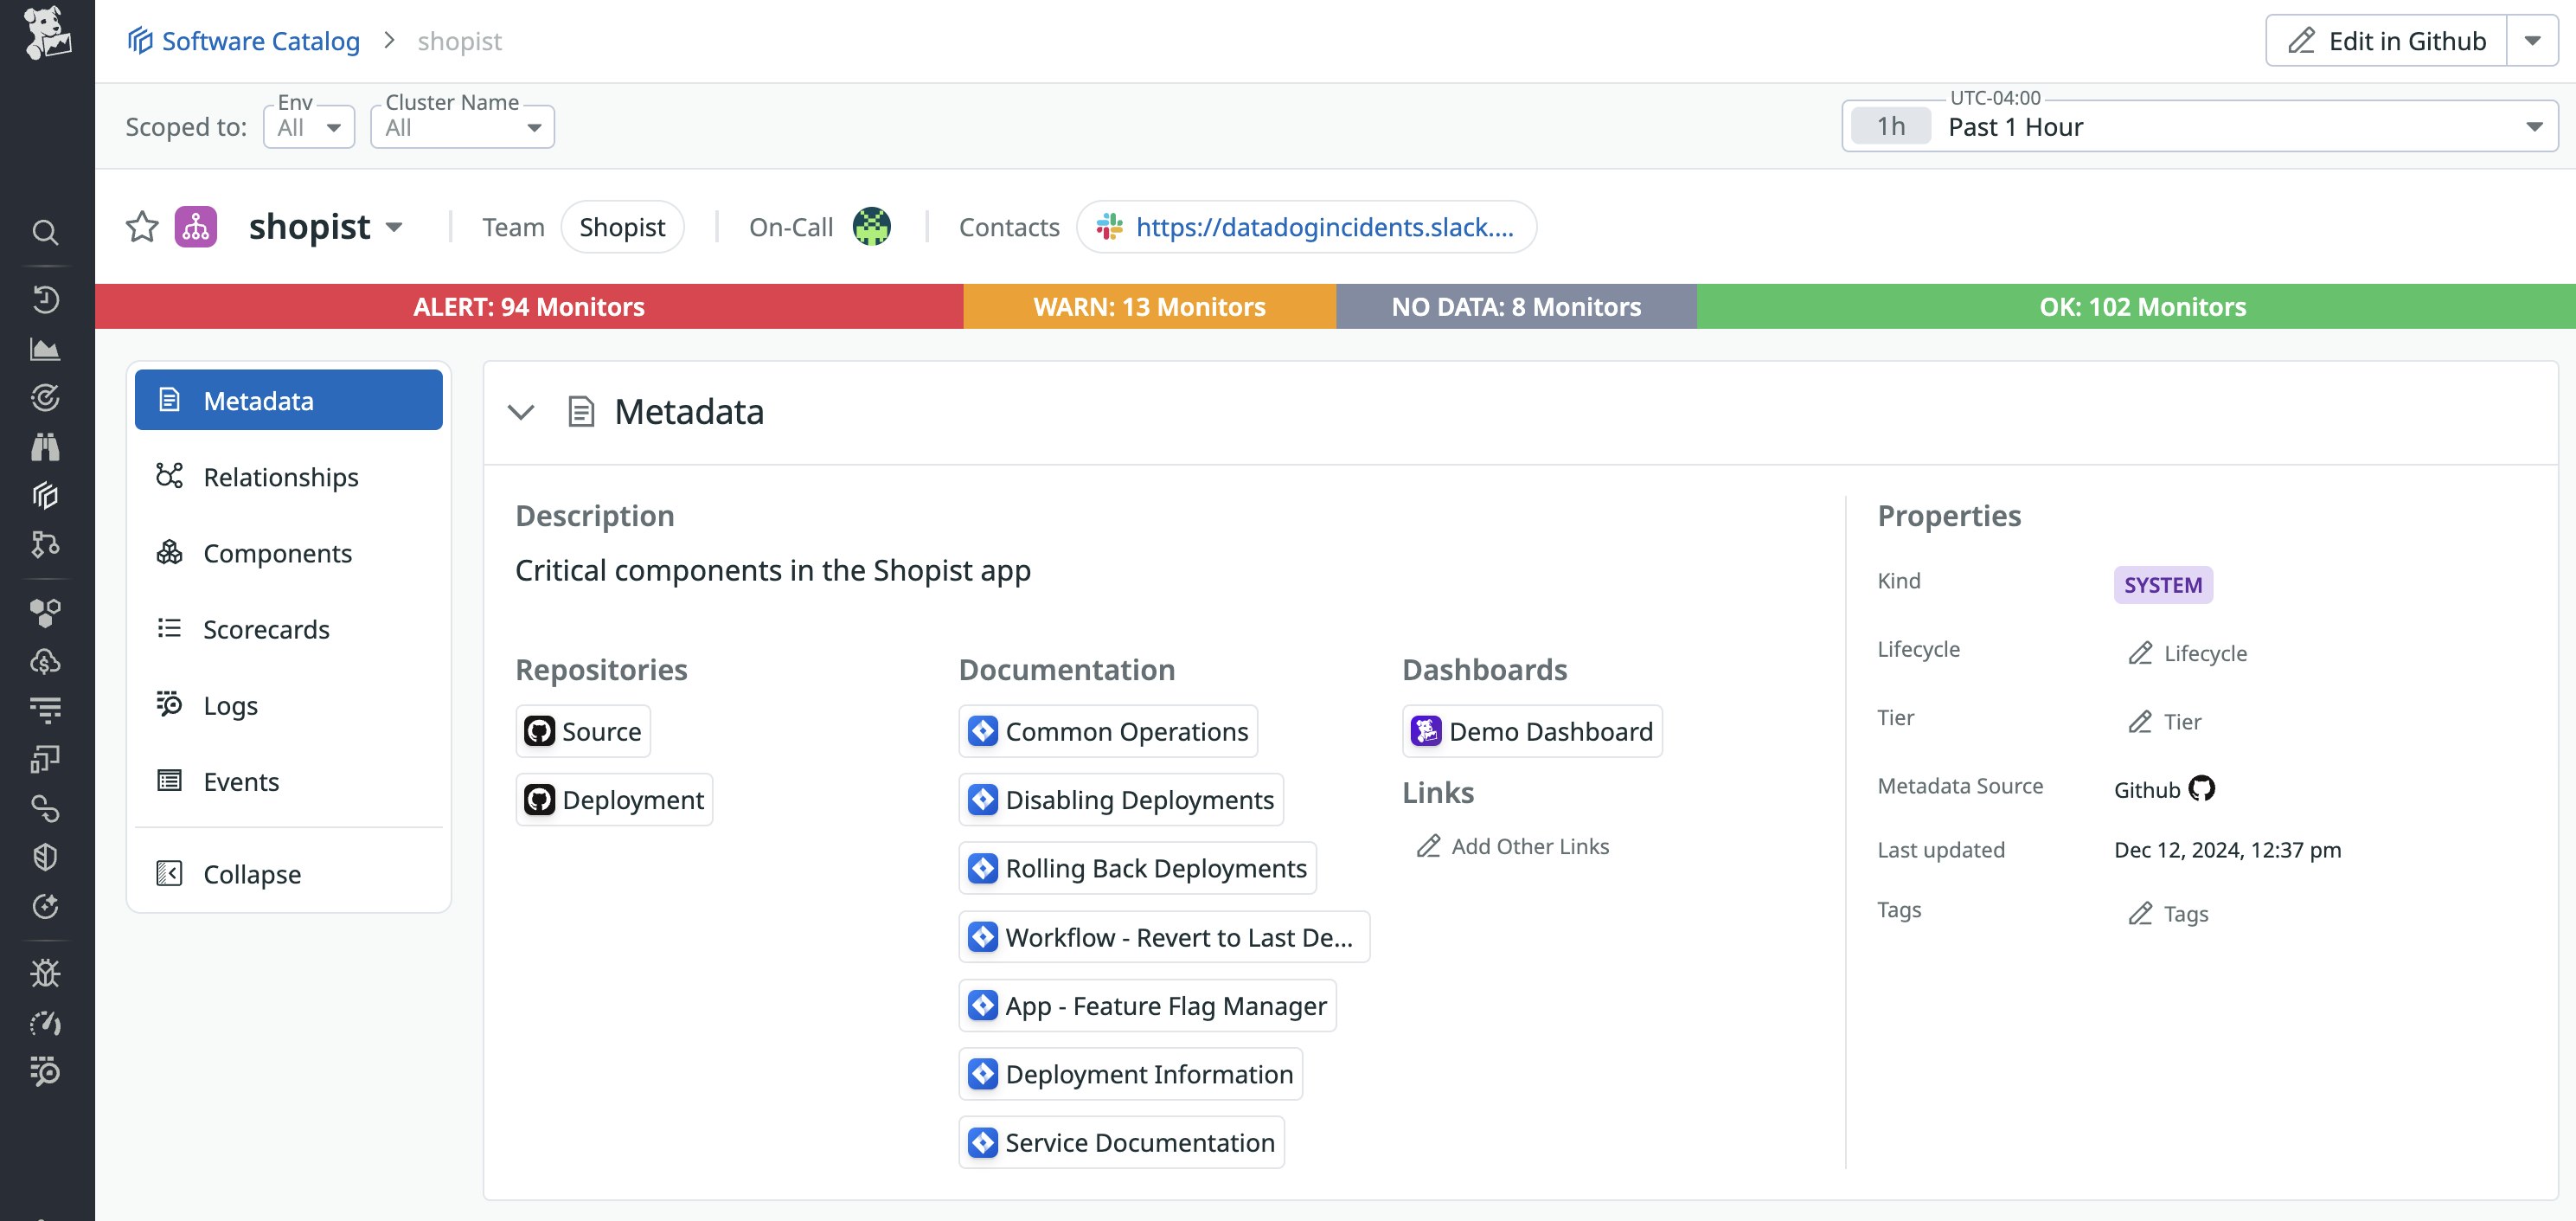
When developers interact with systems outside of their team’s product ownership—for instance, shared services that manage authentication, route traffic, etc.—it can be difficult to gain an understanding of the system’s architecture, dependencies, and deployment workflows. By inspecting a system or API within Software Catalog, developers can access direct links to the system’s repository, as well as documentation that can walk them through deployment workflows or explain the system in greater detail.
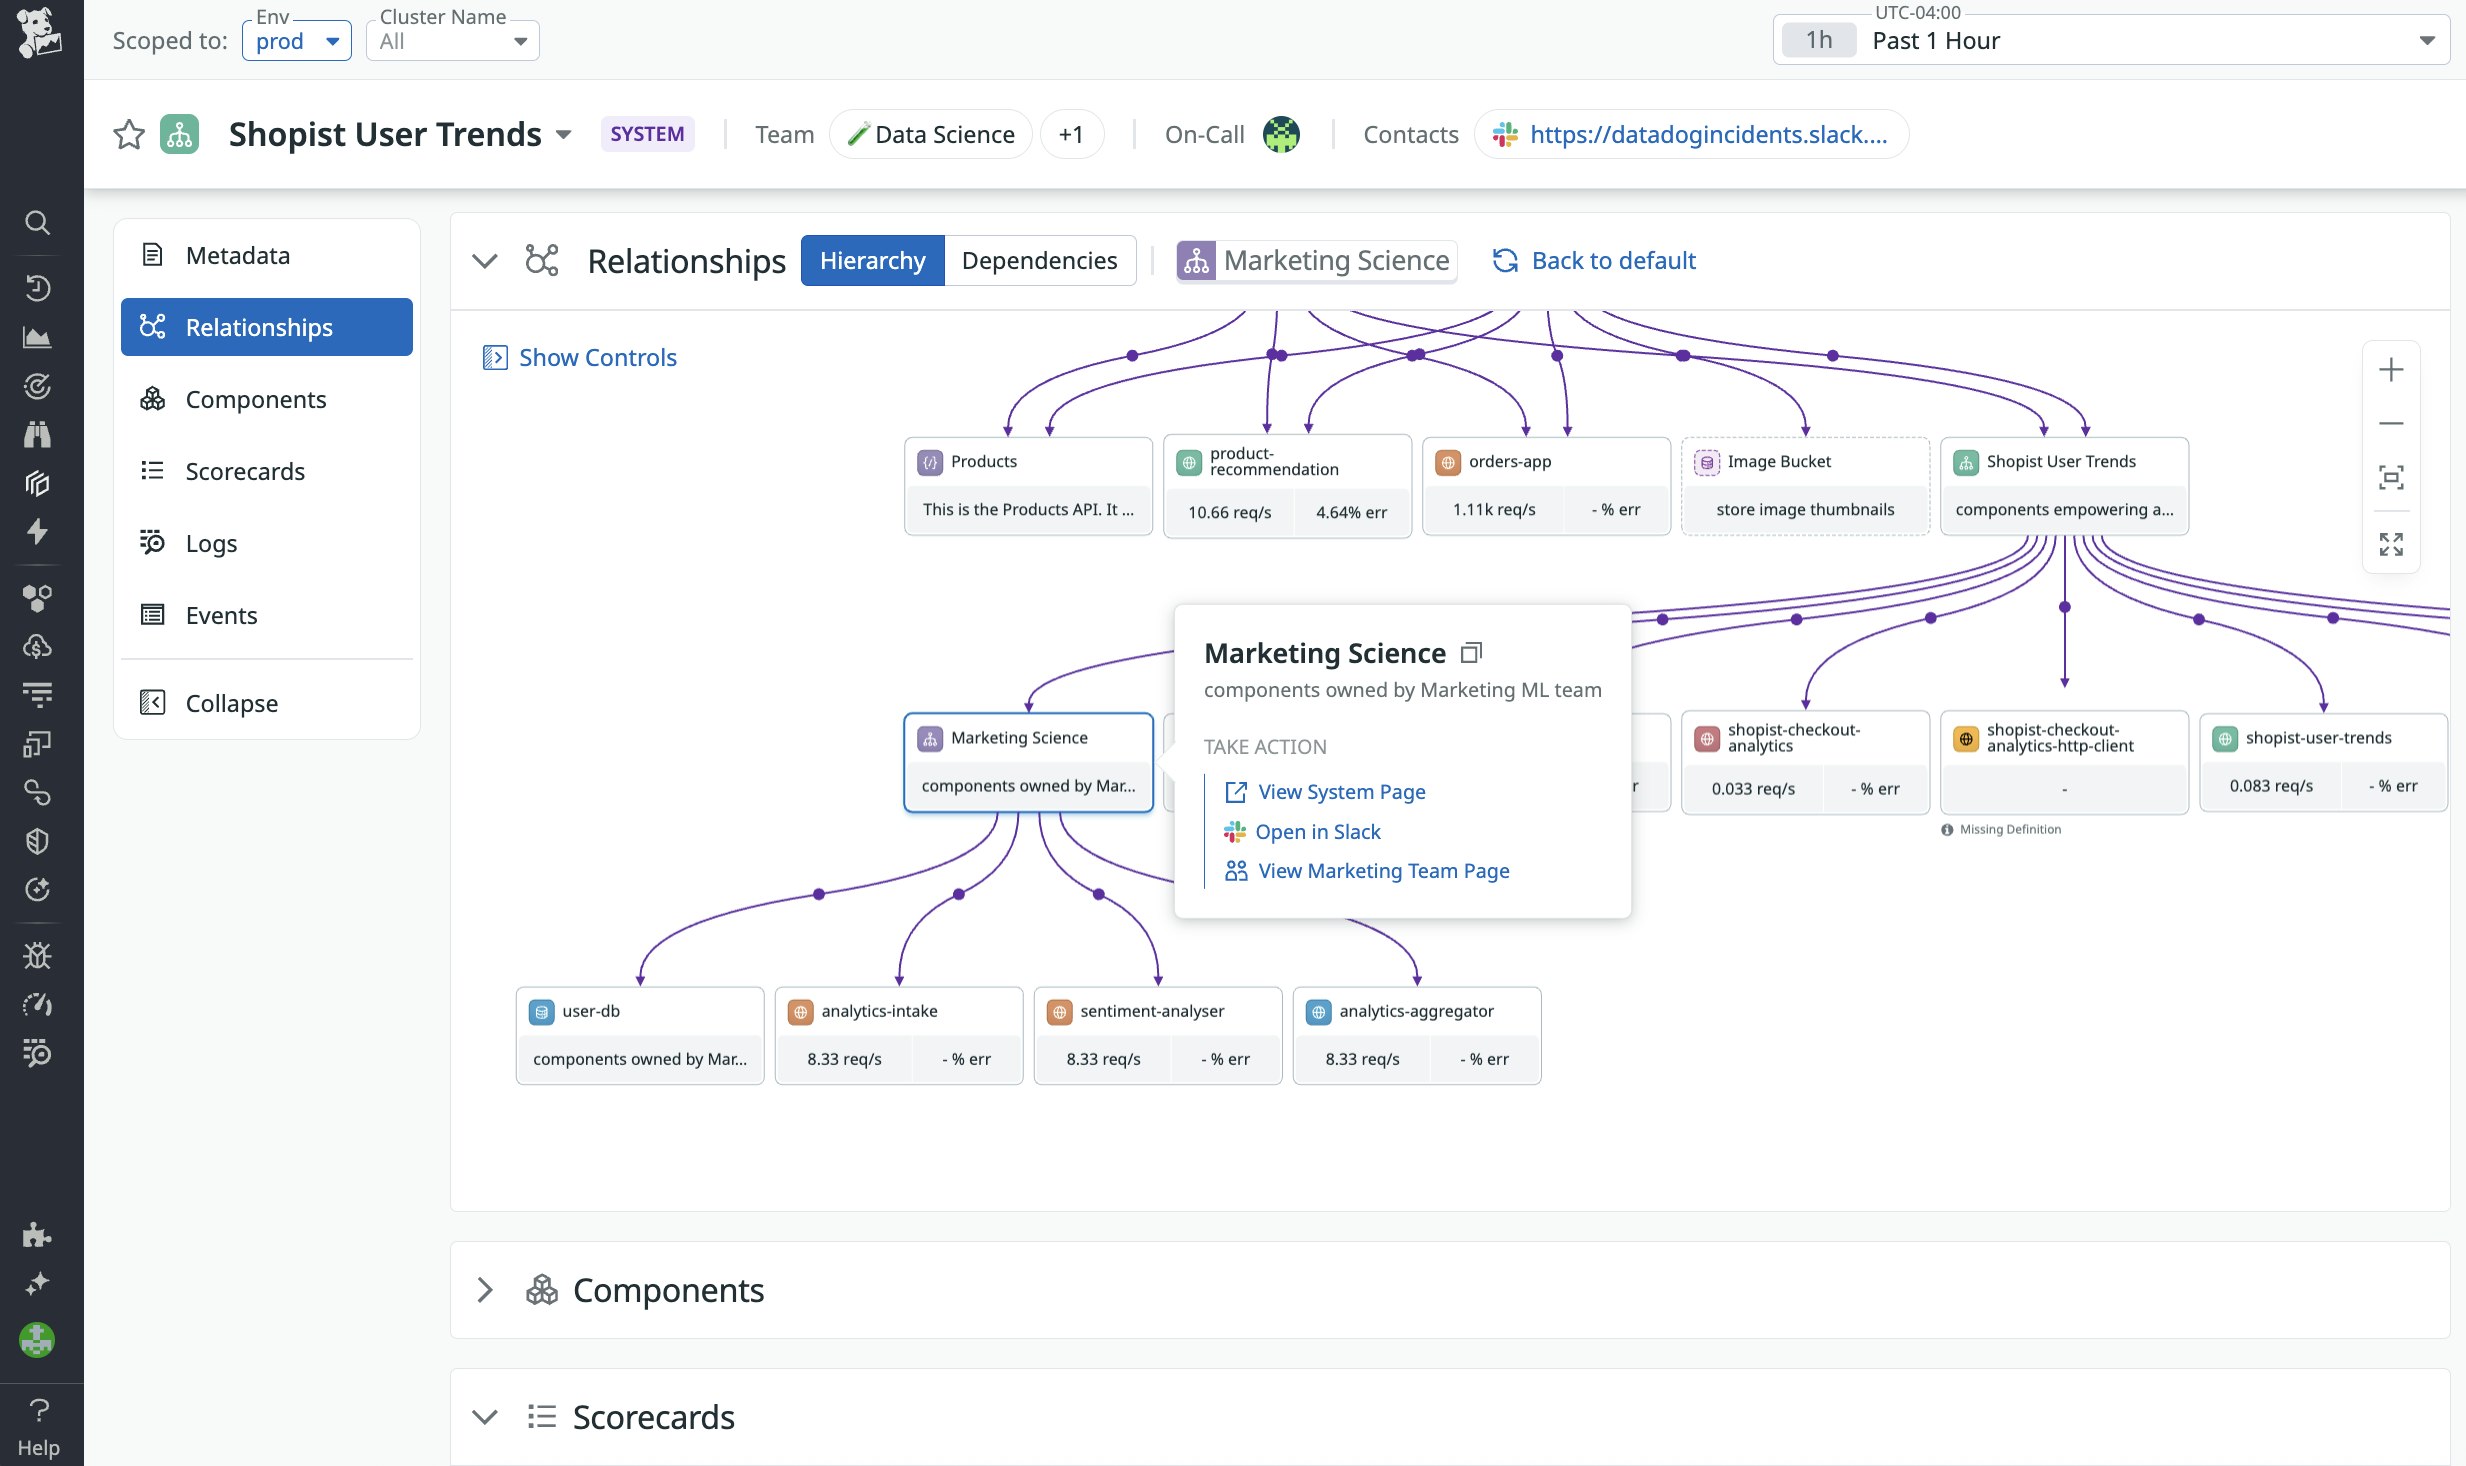
From a system-level view, developers can refer to a hierarchy chart, which maps the system and its child components using connections declared by the system’s product owner. The hierarchy chart helps contextualize how each component ties into your broader system, and how these systems deliver value to the end user (for example, checkout workflows, delivery tracking, recommendation engines, and more).
In the example below, we can see that the Shopist User Trends system is a child system of our larger Product Recommendation system, and is composed of several child components including services responsible for checkout analytics, fraud detection, and marketing science. Upon inspecting the Marketing Science system, Datadog provides actionable links for you to view additional system context or contact the Marketing ML team who owns the system.
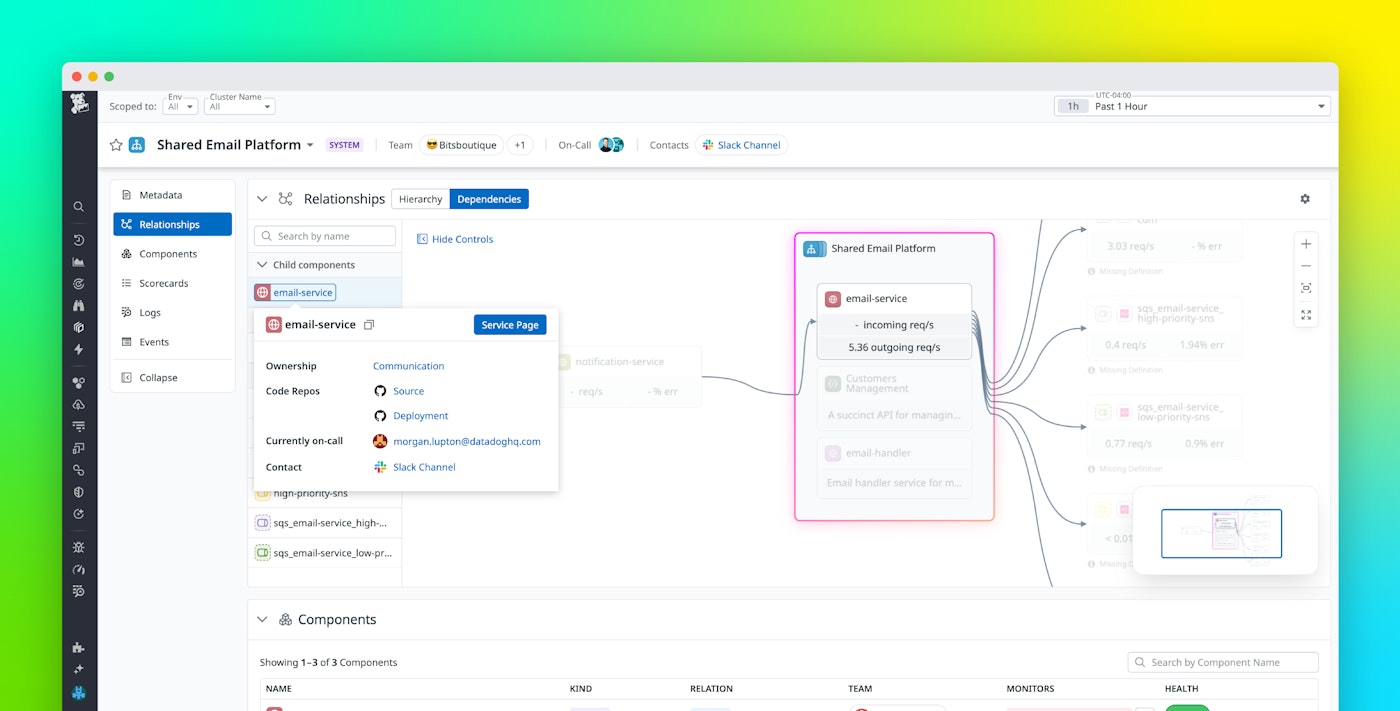
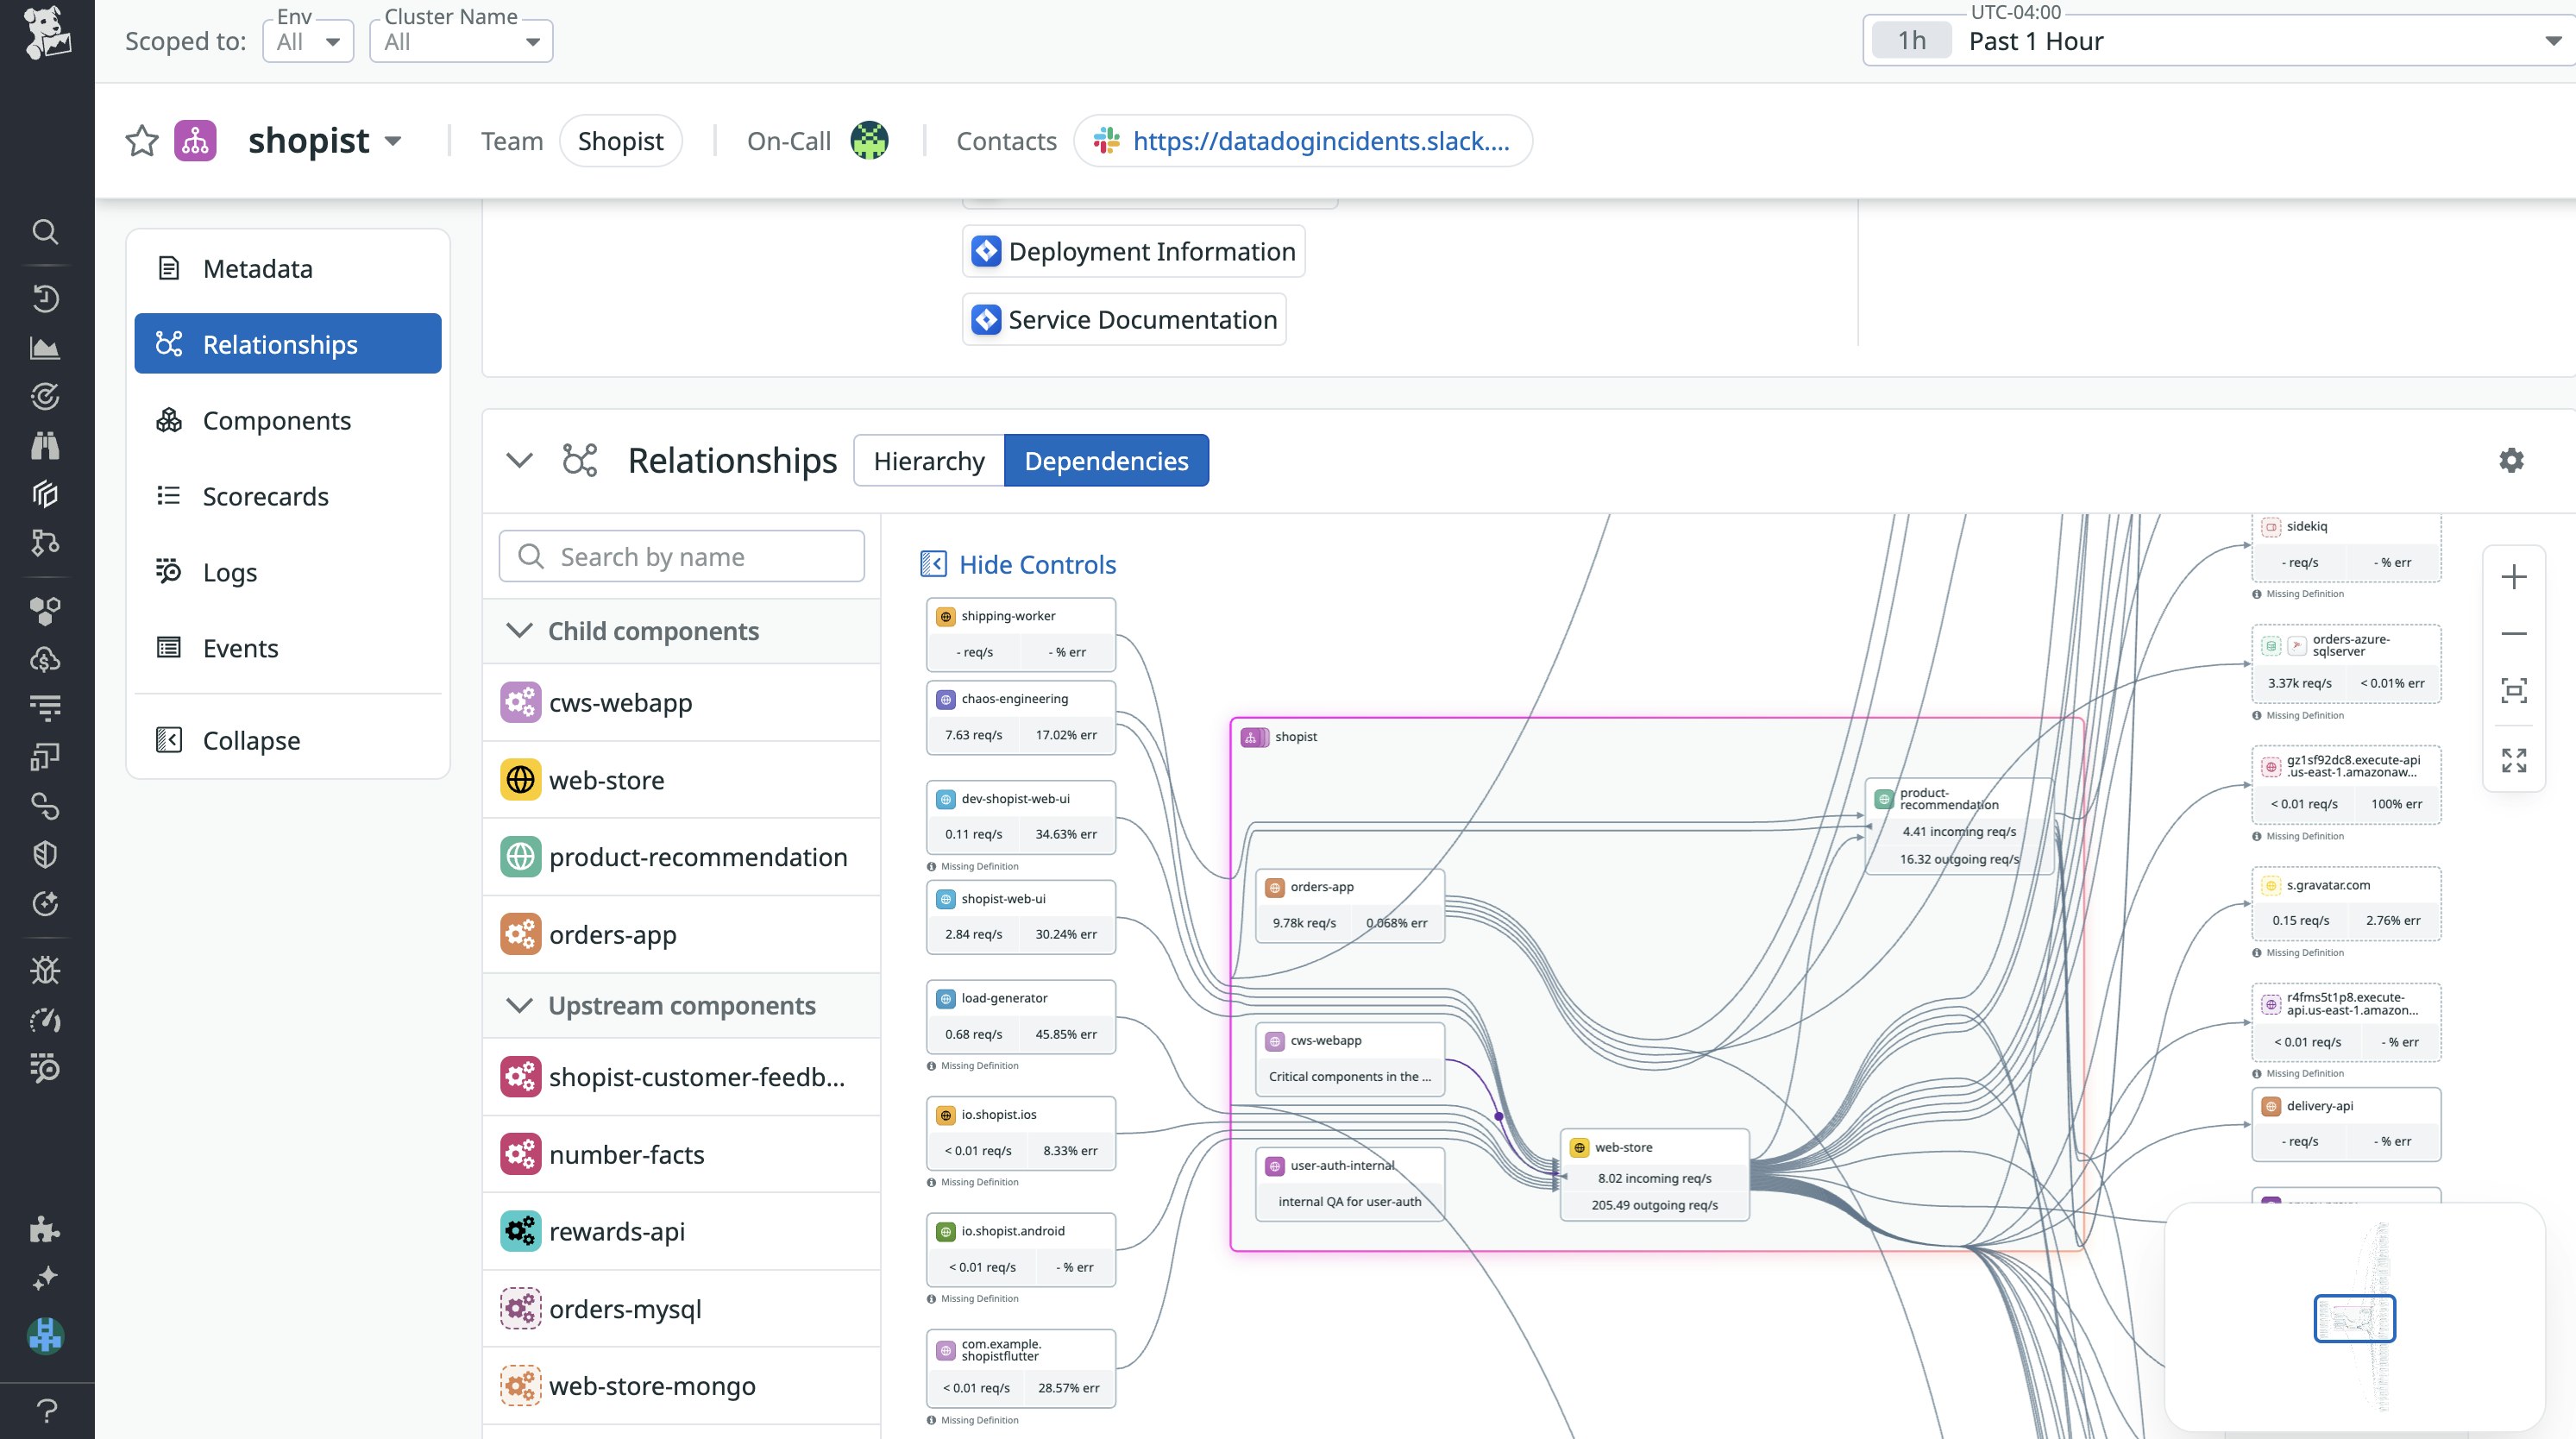
While the hierarchy chart maps the relationships of components within a system, it doesn’t give you a view of incoming requests entering the system or outgoing requests to downstream dependencies. To visualize live traffic, you can inspect the dependencies chart, which uses APM telemetry to automatically detect and map upstream and downstream connections. This means that as long as your hosts are running the Datadog Agent and sending telemetry to Datadog, Software Catalog will accurately represent a live view of your system and its dependencies without any manual service registration or declared connections—for example, when new database instances are spun up or when new APIs are used.
Because the dependency chart is based on real-time data, you’re able to visualize the current state of components via their request rates and error rates, as well as how they’re actually communicating with one another. This can be critical information, especially for developers who are still learning how specific systems fit into a broader architecture and the potential impact radius of deployments that can affect downstream dependencies.
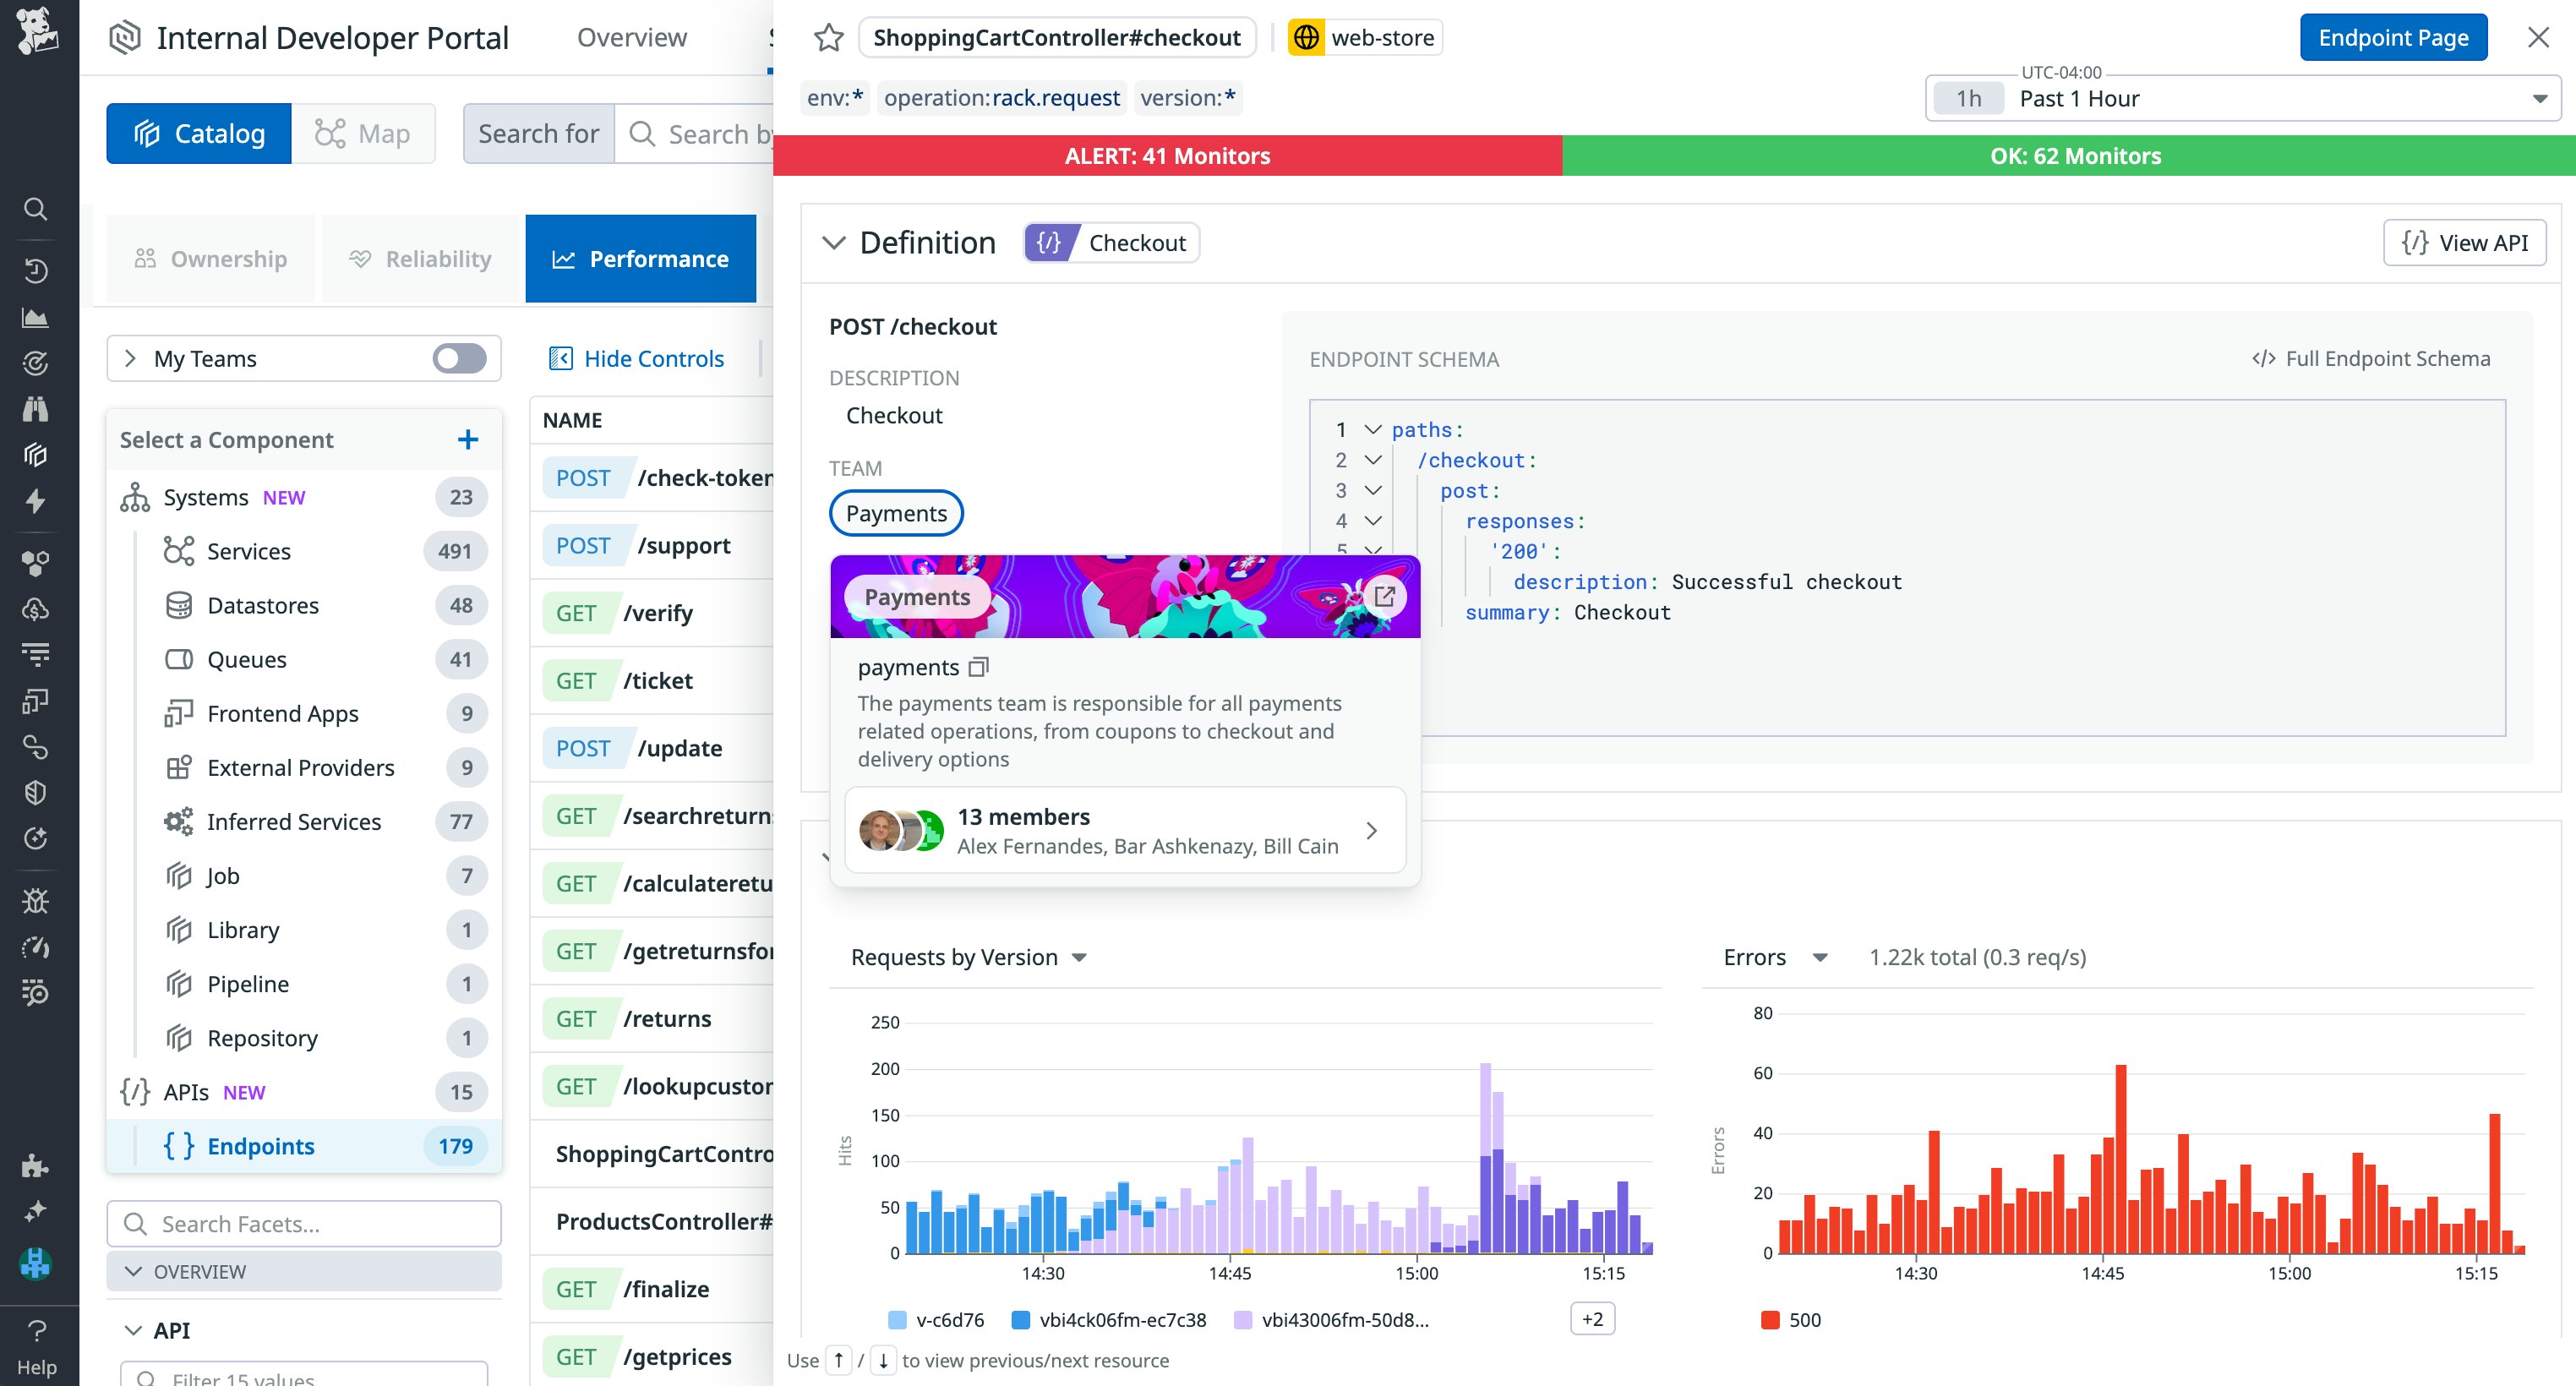
Software Catalog also simplifies API management by grouping together related endpoints and centralizing API metadata such as repositories, runbooks, and links to other sources of engineering knowledge. Datadog automatically discovers and maintains a complete inventory of all of your public, private, and partner APIs through our Agent and APM SDKs without the need for manual registration. After you upload your API’s OpenAPI specifications, Datadog will group together endpoints that belong to the same request path or API. If you encounter instrumentation issues or see no associated spans that link to an endpoint, you can declaratively add endpoints to an API spec so that it still renders a complete picture of your API inventory for developers to reference.
Software Catalog’s API view also enables you to dive deeper into your systems when they exhibit issues or if you’re trying to understand common code paths. For example, while inspecting the performance tab of a service, you may notice that the latency is higher than normal. Endpoint Observability helps you pinpoint these issues to specific request routes and then investigate recent traces to see which span is contributing the most to the request’s latency.
Accelerate software delivery with Datadog Self-Service Actions
When it comes time to provision resources, scaffold new services, or configure CI/CD, developers typically need to open tickets with platform engineering or infrastructure teams. Not only does this slow down development velocity, it also creates a constant stream of requests that need to be reviewed and approved by platform engineers, which consumes their daily bandwidth.
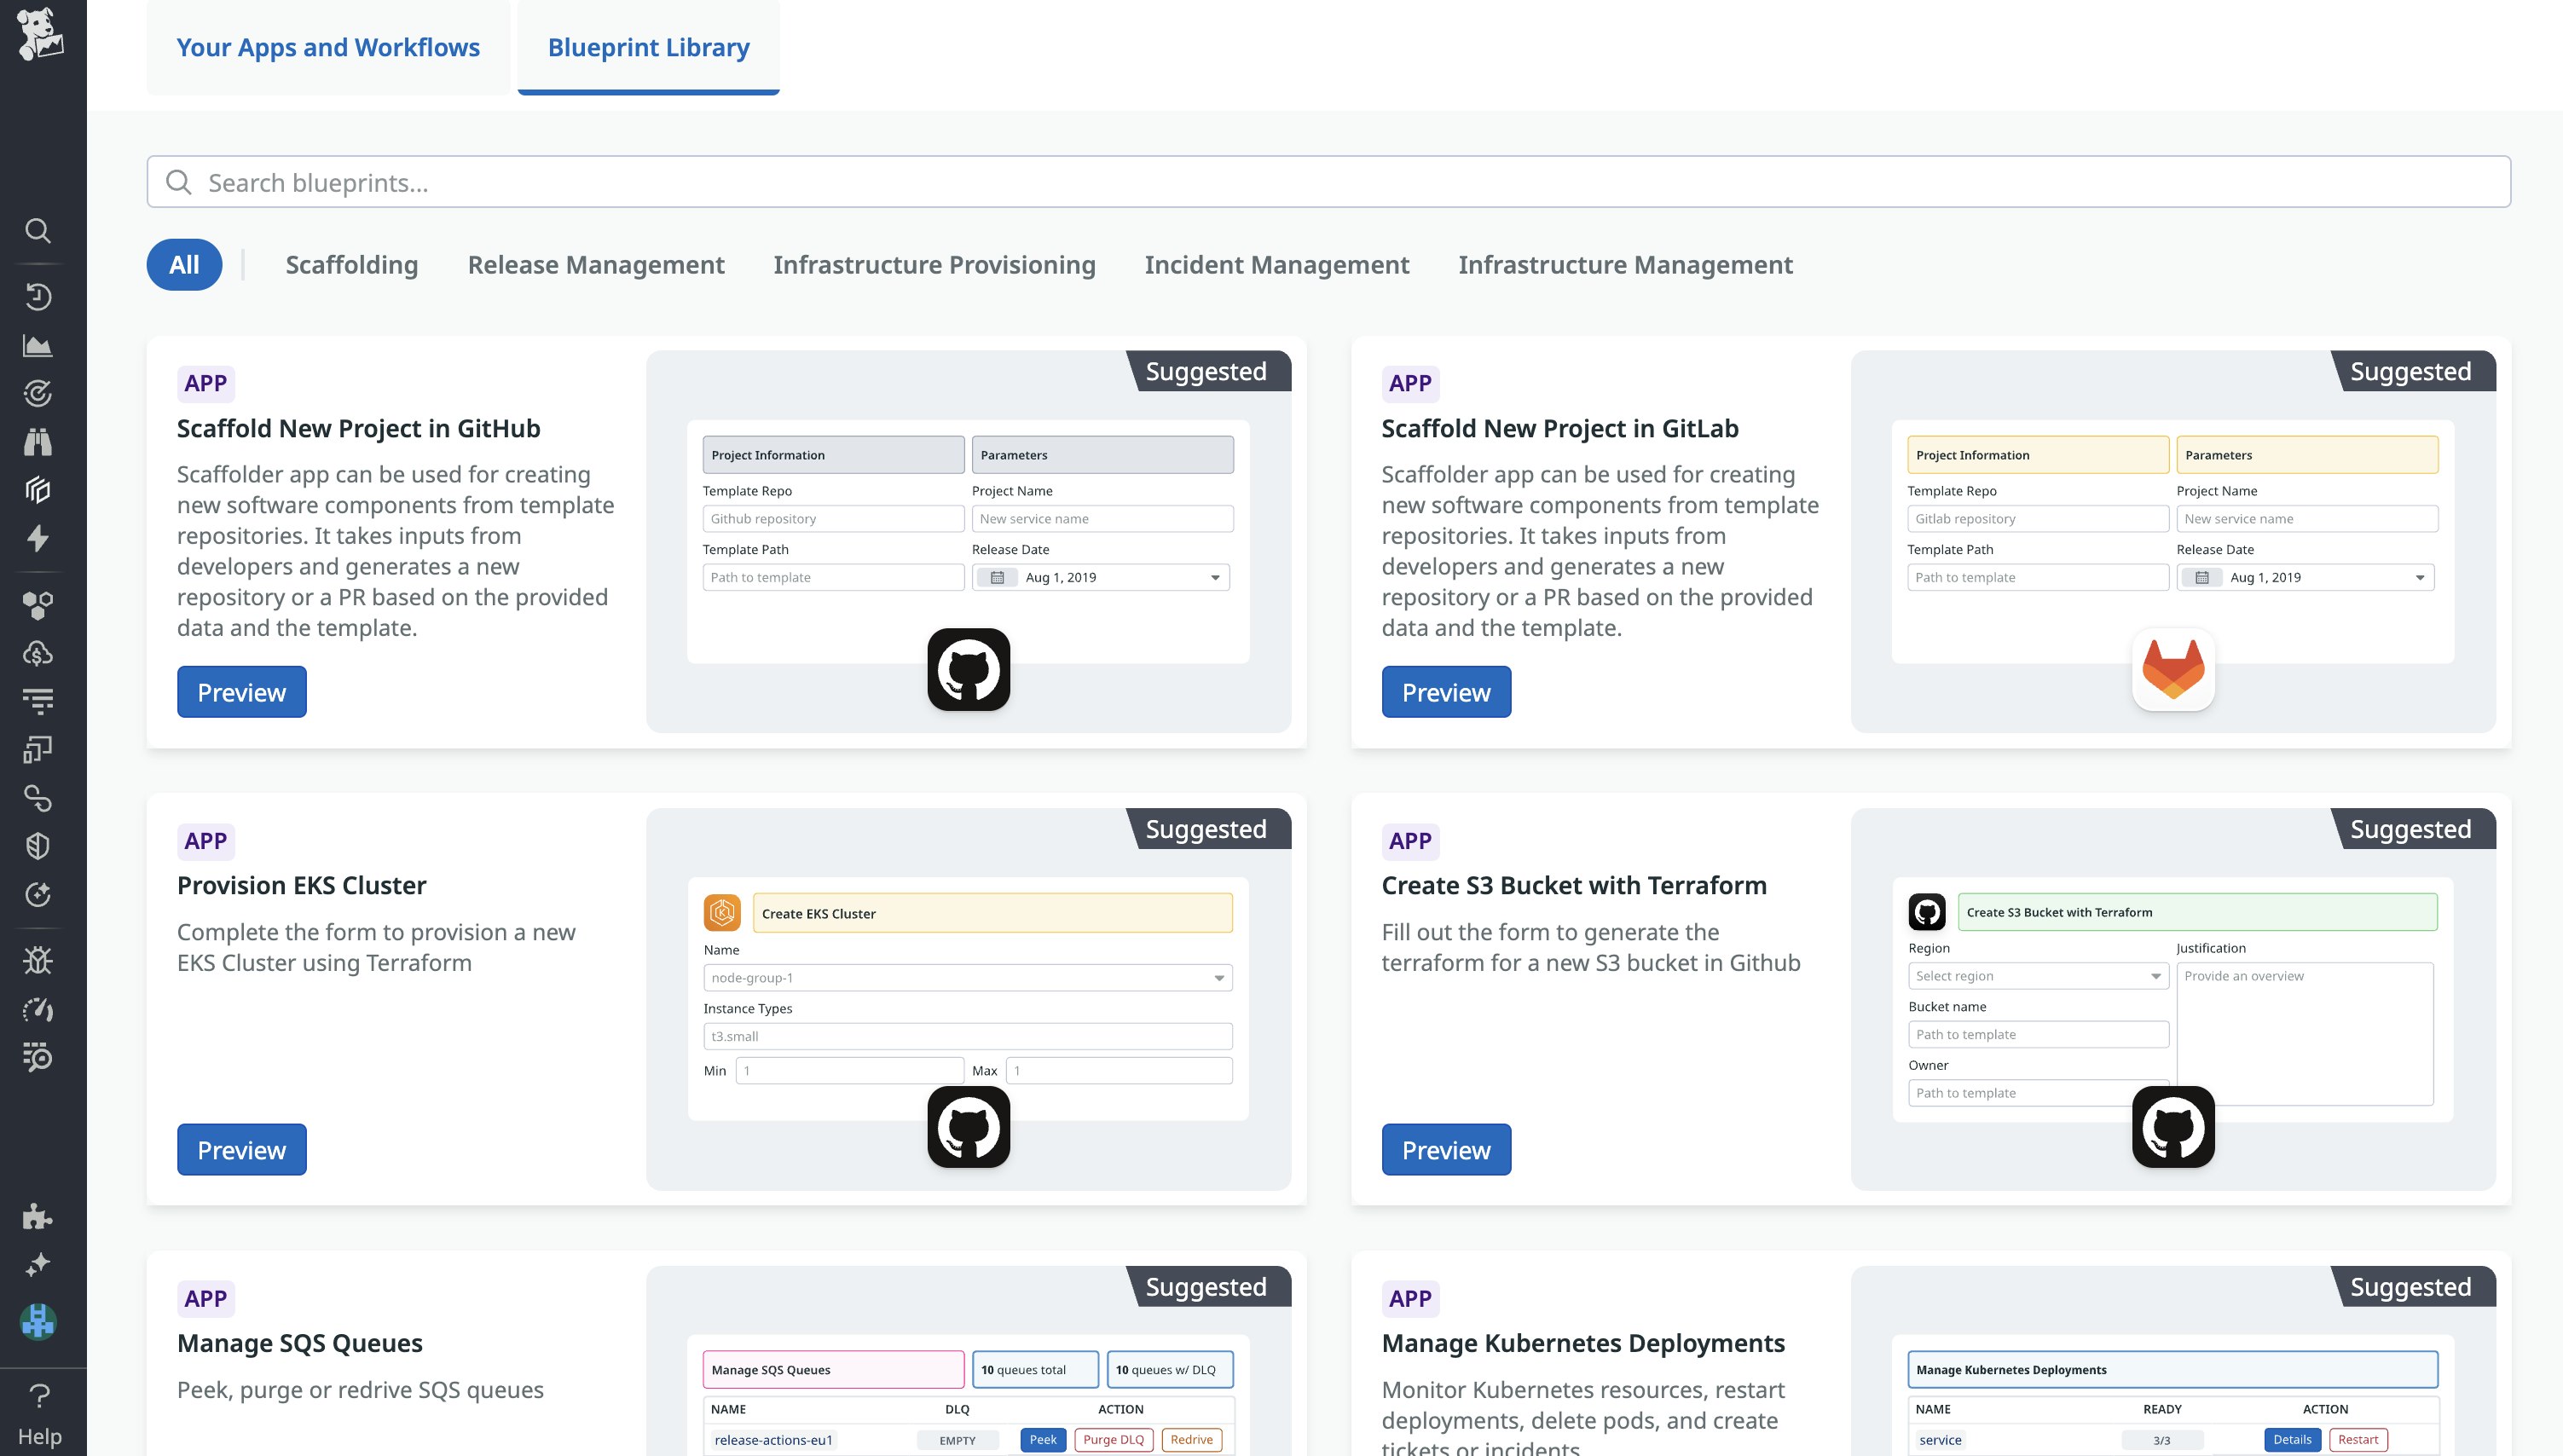
Datadog IDP includes Self-Service Actions, which enable developers to execute common steps in their workflows, such as creating a new S3 Bucket with Terraform; accessing the EC2 Management Console to start, stop, or reboot AWS EC2 instances; or scaffolding an AWS Lambda-based microservice directly from the Datadog IDP. Each tile found within Self-Service Actions represents either an app or a workflow—these provide a structured interface for executing predefined actions created and approved by platform engineers. For platform engineers, creating an app or workflow entails collecting inputs from developers; using these inputs to call Datadog Actions that initiate API calls to external services, perform custom logic, or transform data; and then orchestrating end-to-end processes that involve multiple actions.
Self-Service Actions give developers a central hub for software delivery actions where they can interact with platform services and integrations. Self-Service Actions are all completed using simple-to-use intake forms that either automatically execute the task at hand or output an IaC file or a PR that is submitted to the teams or product owners necessary for review and approval. This can reduce the cognitive load involved with delivering software, since you no longer need to navigate to third-party platforms to configure CI/CD in your CI provider or write custom Terraform syntax to provision infrastructure.
If you’re a platform engineer, to help you avoid significant configuration overhead, Datadog offers App Builder Blueprints and Workflow Automation Blueprints for over 100 common use cases so you can quickly implement common developer tasks and workflows as self-service actions and save time otherwise spent on configuration and orchestration. After selecting a Blueprint, you can customize the default Blueprint template in either App Builder or Workflow Automation to fit your specific needs. For self-service use cases highly specific to your internal systems or business applications, you can also bypass Blueprints and build a new app and workflow from scratch.
Ensure that your service is production-ready with Datadog Scorecards
If you’re a developer who is building out a new service, it can be difficult to evaluate whether your service is production-ready, and if not, what issues need to be addressed in order to meet production-ready standards.
Datadog IDP includes Datadog Scorecards, which provide clear-cut criteria for production-readiness, observability, cloud costs, security, and other requirements that should be fulfilled before a service is deployed. Scorecards serve as a single source of truth to reference for both platform teams and service owners, eliminating much of the guesswork involved with shipping new products. Scorecard rules for observability best practices, ownership and documentation, and production readiness are available out-of-the-box. These rules help you ensure that new services deploy with essential configurations such as deployment tracking and log correlation, and that your team has properly defined monitors, set up an on-call rotation, and created service-level objectives.
You can also create custom Scorecards and categories to evaluate criteria specific to your engineering organization—for example, this can include ensuring that services have completed chaos engineering exercises, include a declared hierarchy diagram in the Software Catalog, and have their linked APIs tagged with OpenAPI specifications. You can learn more about how Datadog uses Scorecards internally to communicate best practices at scale in our blog post.
Streamline your software delivery cycle with Datadog
Datadog IDP provides developers with tools and a central source of engineering knowledge so that they can ship software faster and more confidently. For organizations that already use an open source IDP, Datadog IDP makes it easy to migrate or maintain consistency across platforms by matching the data model of popular open source frameworks such as Backstage. You can also learn more about how the Datadog IDP helps engineering directors and team leads generate reports and track the reliability of their services in this blog post.
Standard IDP features are now available to all existing customers. You can learn more about Standard and Premium IDP features in the Datadog IDP product page. You can learn more about other newly announced Datadog features in our DASH 2025 feature announcement guide.
If you don’t already have a Datadog account, sign up for a free 14-day trial today.
