Thomas Sobolik

Miranda Kapin
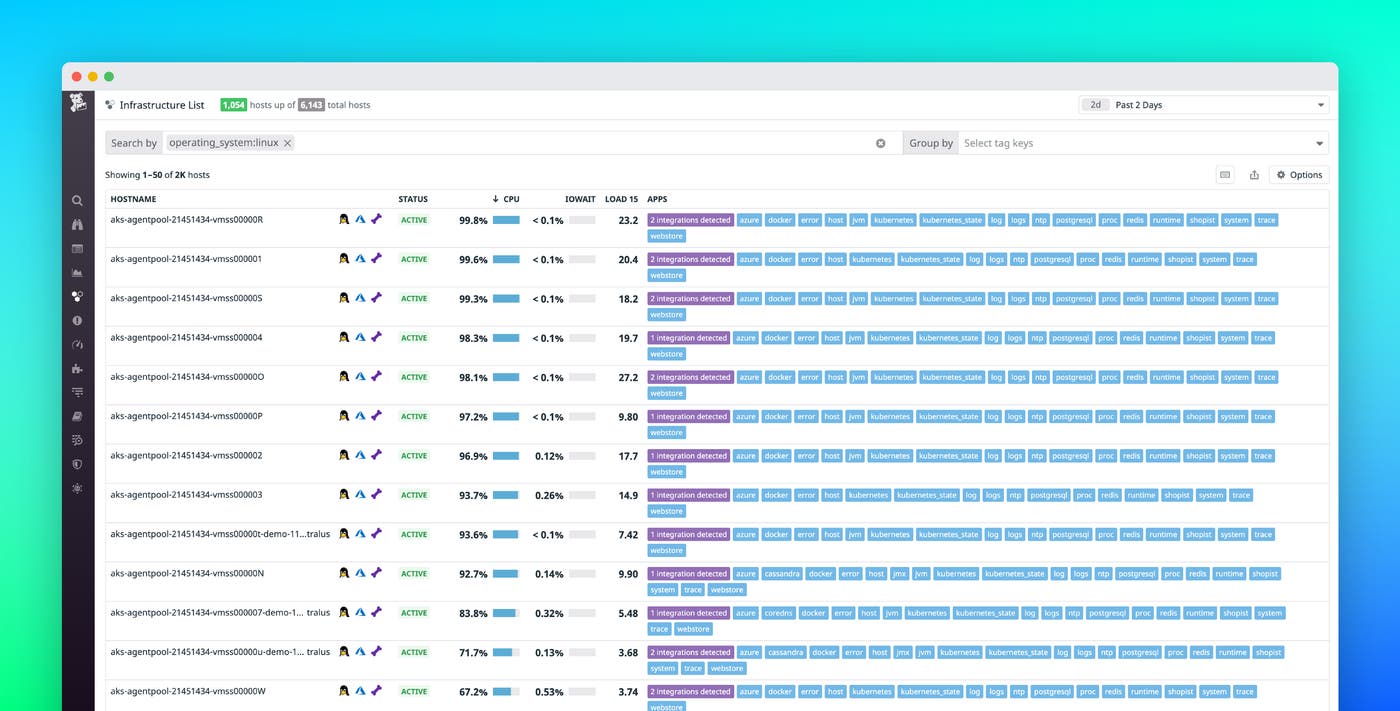
Datadog’s infrastructure list provides a central, high-level view of every host in your environment and pulls together metadata and relevant metrics from across Datadog to help you get the full picture of each one. You can easily filter and sort the list using any host tags, letting you quickly view the status of the parts of your infrastructure you need. We’ve added new features and visualizations to the infrastructure list that make it even easier for teams to navigate their infrastructure via tags, home in on the hosts they care about, and pivot to other parts of Datadog to get more details. In this post, we’ll look at how these optimizations help you build more powerful infrastructure list queries, and we’ll show how each host’s sidepanel gives you even more visibility into your hosts’ health and performance.
Building queries
Being able to query the infrastructure list easily is key for grouping, filtering, and sorting your hosts so you can quickly find the ones you need. When filtering the list by tags, tag values in the search bar are now available with autocomplete, ensuring that you don’t need to double-check your spelling when looking for complex tags. You can also now group the list by tag keys, enabling you to organize your hosts based on a particular attribute, like service, cloud region, or availability zone. Finally, you can now adjust the time range of the infrastructure list, enabling you, for example, to view hosts that are no longer online.
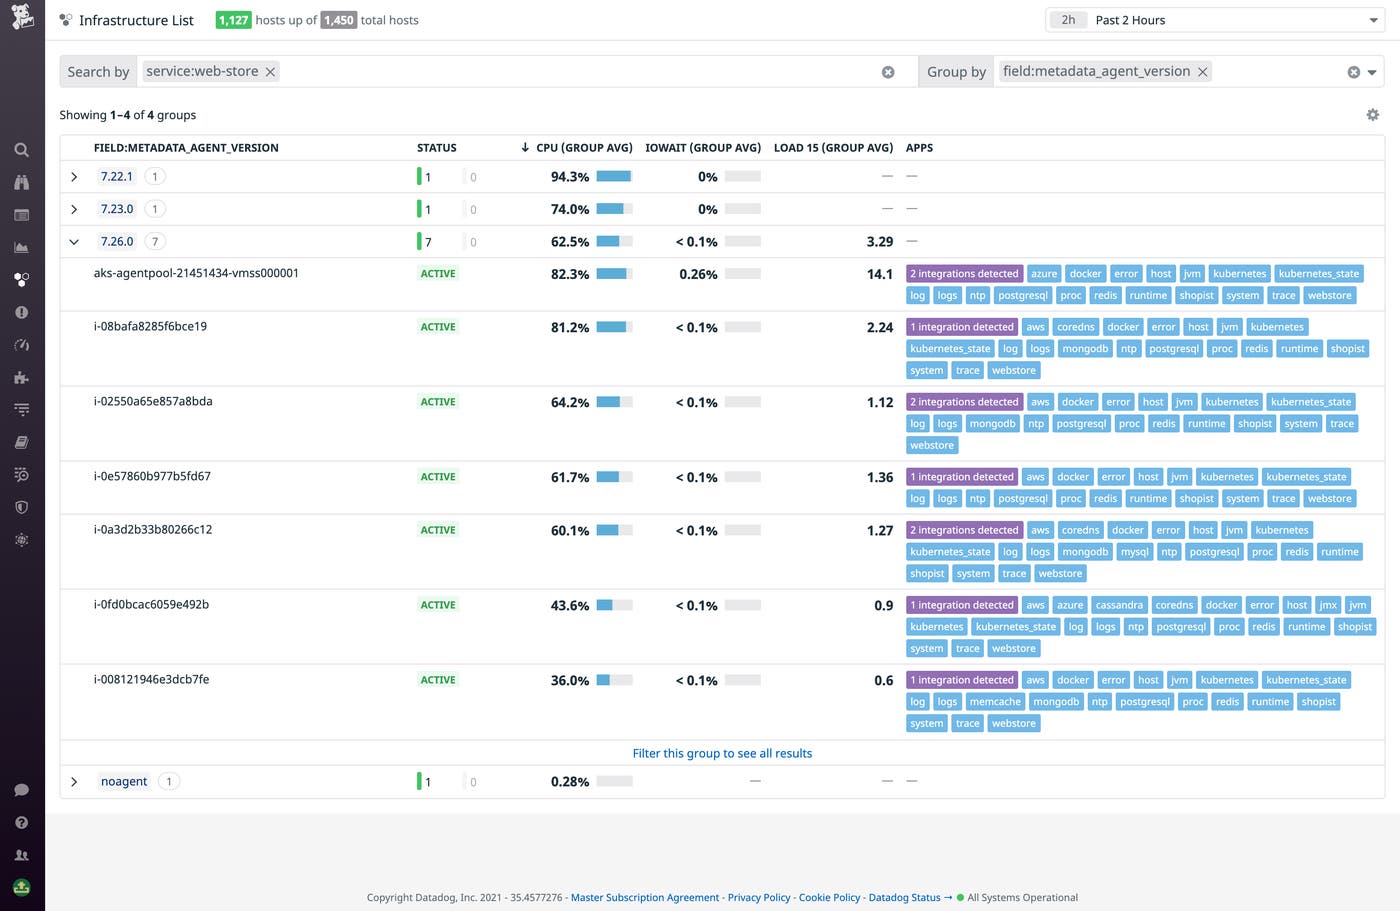
Together, these features let you quickly and easily use tags to sort through and surface key data about all the hosts across your environment. For example, let’s say you run a service on a cluster of AWS EC2 instances that you’re collecting CloudWatch metrics from via Datadog’s AWS integration. Installing the Datadog Agent on your EC2 instances provides higher granularity metrics. You can filter the Infrastructure List query that filters hosts with your service tag. By grouping the resulting hosts by Agent version, you can quickly reveal which of your EC2 instances are running the most current Agent, or which ones don’t have it yet.
Drill into individual hosts
Clicking on a host in the infrastructure list reveals the sidepanel, which brings together relevant metadata, logs, infrastructure metrics, APM traces, network performance insights, security signals, and more from across Datadog, giving you a full picture of that host’s health and performance.
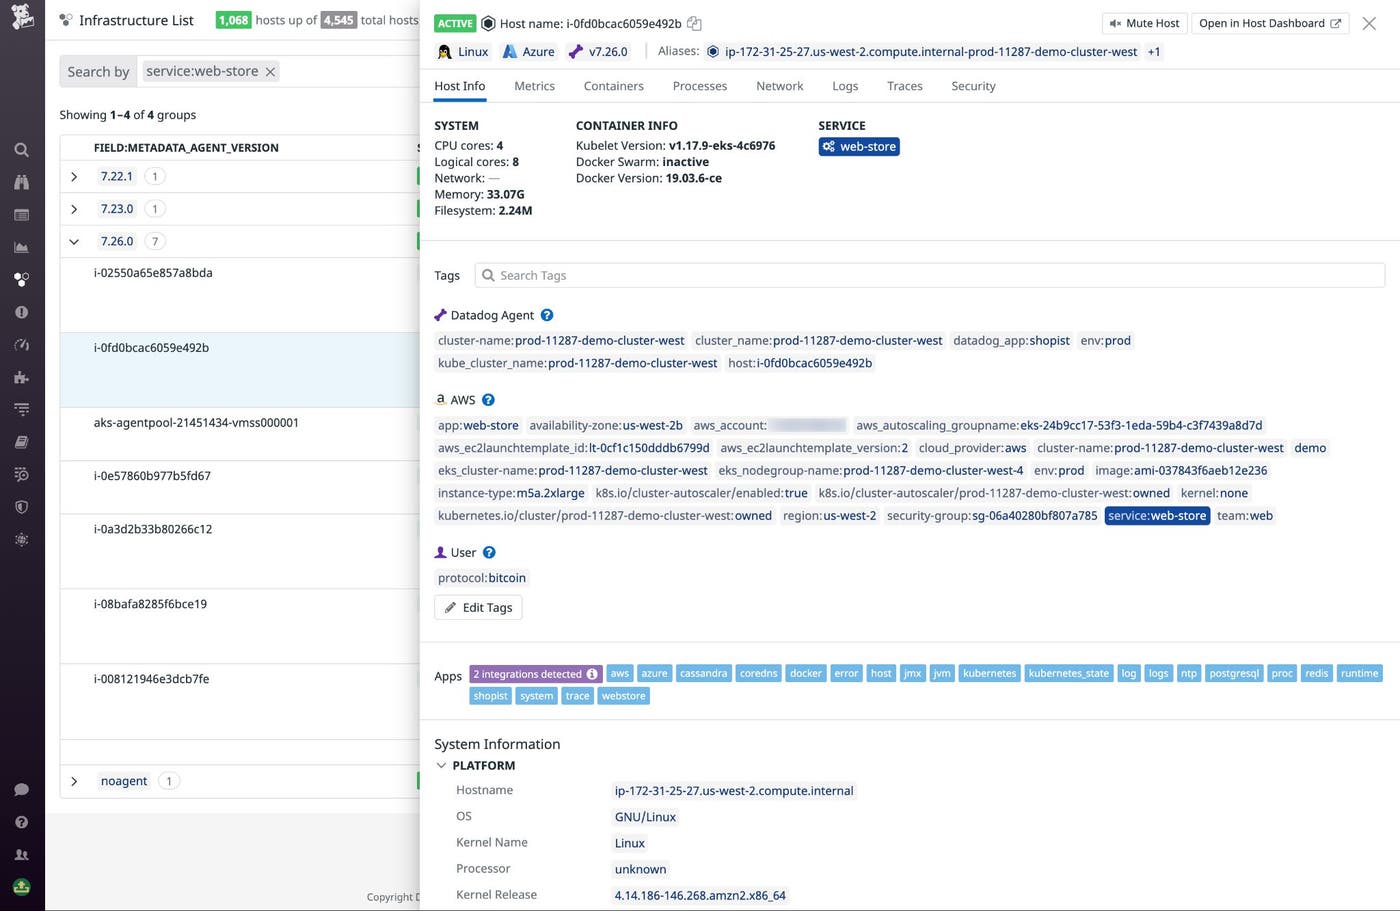
The host info tab, which offers a summary of key metadata and the complete list of tags attached to the host, now includes a tag search function that helps you quickly find other hosts with the tag you’re looking for. You can select a tag from this view and add it to the query to narrow the results to other hosts with the same tag value. This way, you can, for example, quickly look up all the hosts running a particular service to get more context around an observed issue.
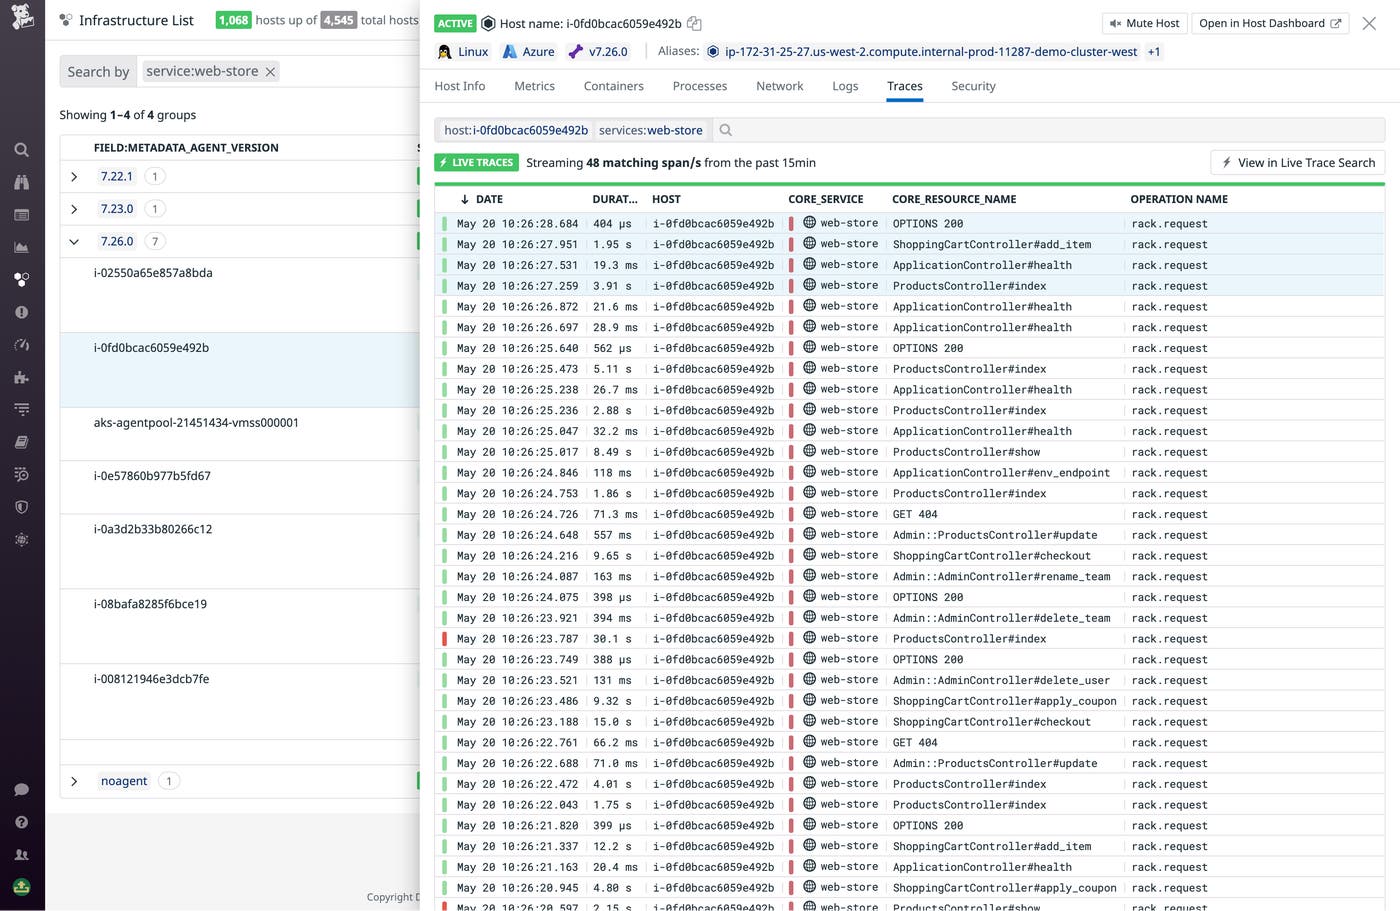
The rest of the tabs pull together telemetry from Datadog’s key features. In the new Traces tab, you get a live view of request traces from services running on that host. Traces containing errors appear in red, so you can quickly spot problems and pivot to Datadog APM to view the full trace to investigate.
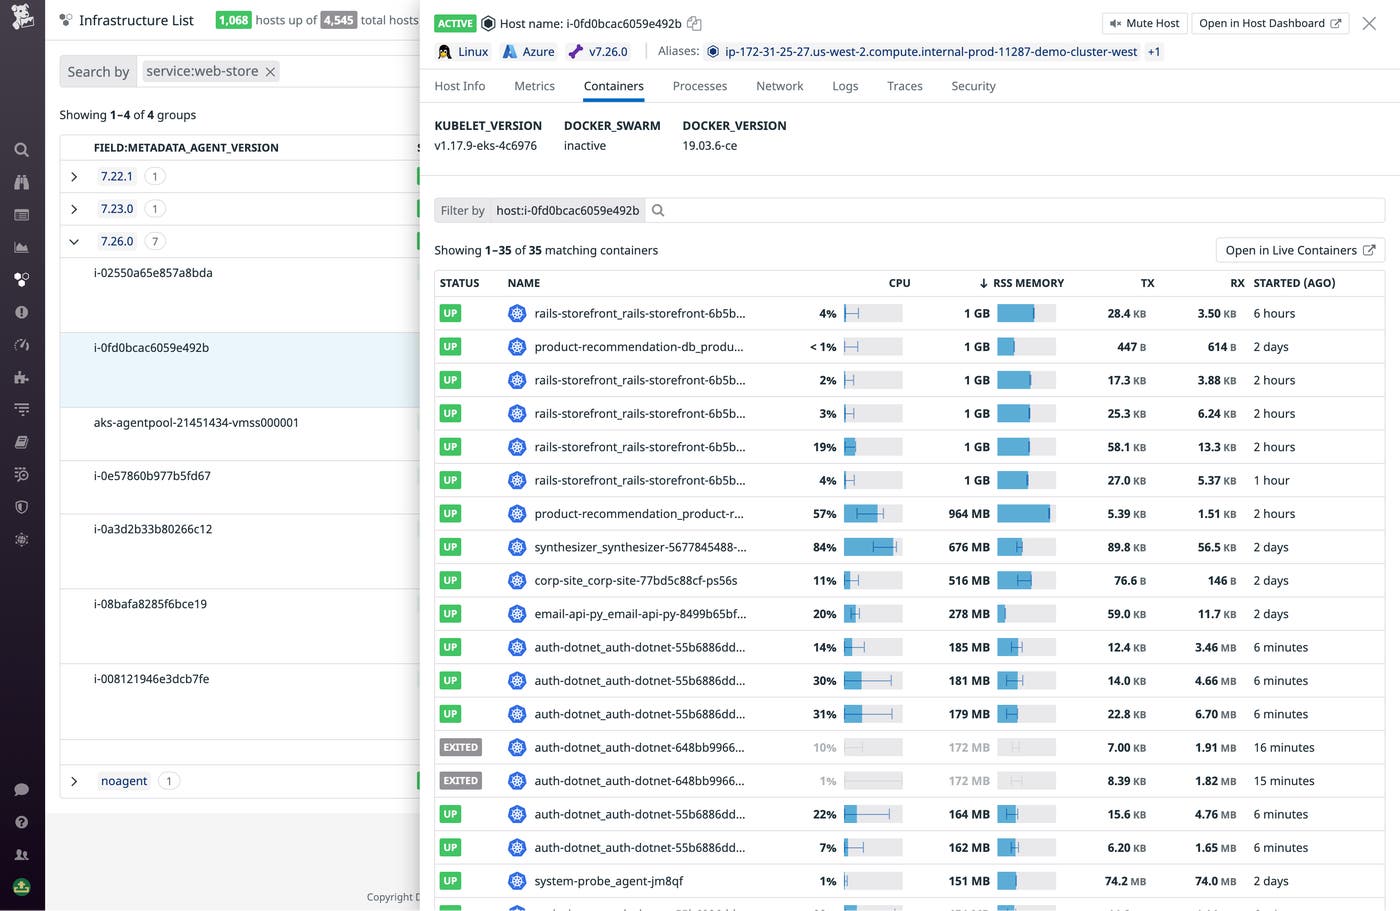
The Containers tab offers a live view of that status and key metrics of any containers running on the host. If you see something that you want to investigate, you can jump directly into the Live Containers page, scoped to the host in question, for the full slate of container resource metrics, as well as that container’s traces and logs.
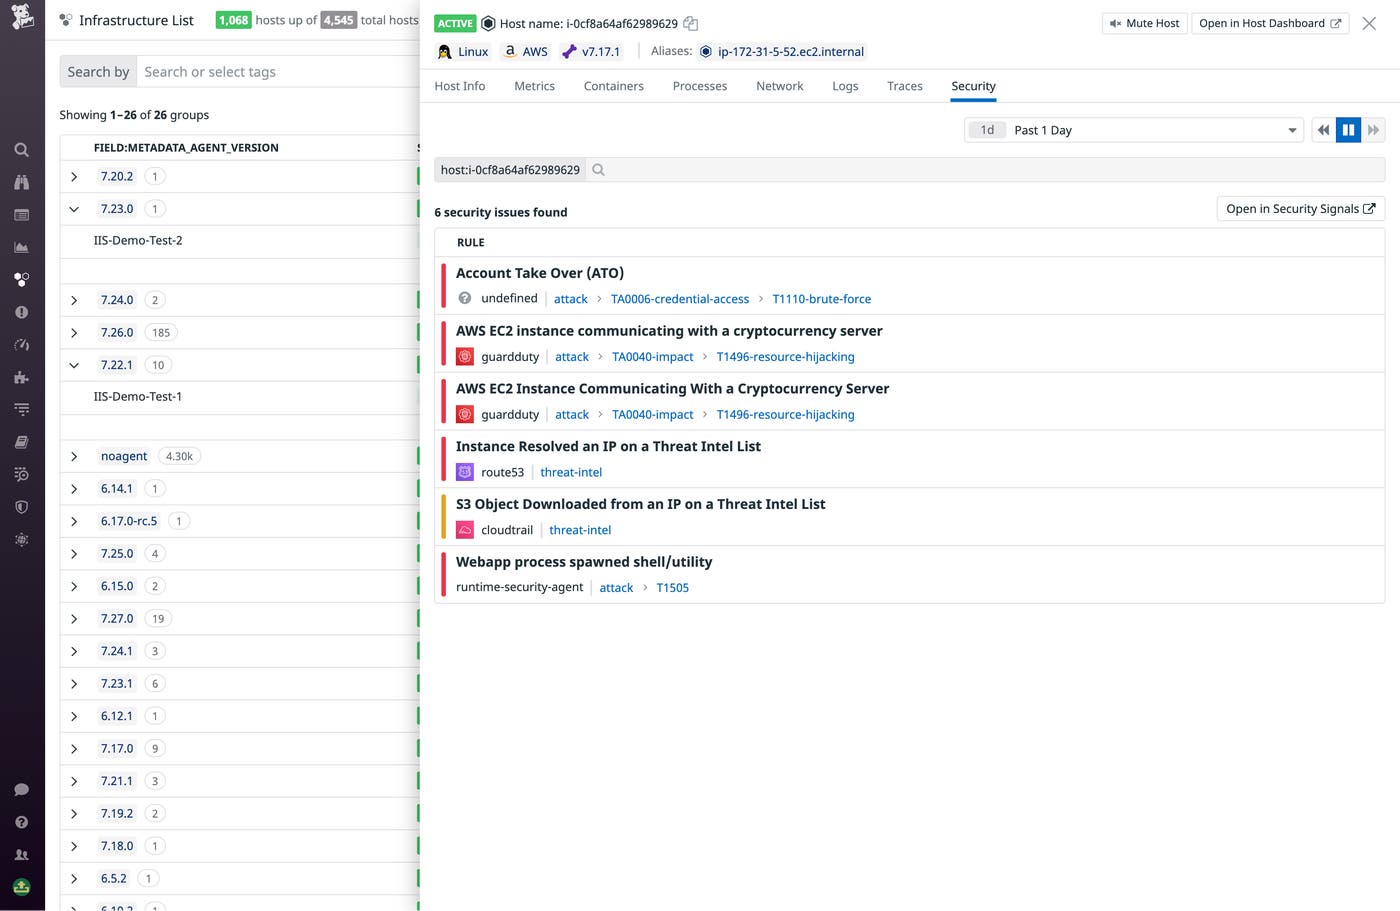
The Security tab collates security signals from Datadog Cloud SIEM—surfacing potential security issues affecting that host. In the example below, we see a signal telling us that an account takeover attack may have transpired. This is triggered by a high number of failed logins—followed by at least one successful one—in quick succession. You’ll want to inspect the logs to verify this happened, and if it did, rotate the user’s credentials and notify them of the breach.
Get a bird’s eye view of your entire infrastructure
With the new, improved infrastructure list, you get a comprehensive and highly customizable view of all your hosts, along with the telemetry you need to understand their health and performance. This feature is currently available for all customers—no additional installation is required. Learn more about this feature in our documentation. To get started with Datadog, sign up for a 14-day free trial.
