Paige Andrews

Roxanne Moslehi
Engineering leaders often struggle to answer critical questions about their teams’ performance and the reliability of the services they manage. Without centralized insights, it’s difficult to assess whether standards are being met, track product reliability across teams, or identify gaps in the software development life cycle (SDLC). Scattered metrics and inconsistent reporting make it hard to understand where to focus, make data-informed decisions, and identify top areas for improvement.
To address these challenges, Datadog’s Internal Developer Portal (IDP) provides customizable, ready-to-use Engineering Reports. These pages provide out-of-the-box visibility into engineering reliability, software delivery performance, and compliance with engineering standards, while offering actionable, personalized views for platform engineers, team leads, and executives. Engineering teams can access these insights directly from the IDP overview page and distribute recurring reports via email or Slack.
This post walks through how these new features help teams:
- Track and improve reliability with a unified view of SLO performance and incident trends
- Monitor adherence to engineering best practices with Scorecards
- Identify delivery inefficiencies using DORA metrics
Track and improve reliability with SLO and incident trends
Engineering teams often rely on fragmented dashboards or manual reporting to monitor reliability, making it difficult to understand how services are performing or which areas are at risk. The Reliability Overview report addresses this by providing a side-by-side view of service level objectives (SLOs) and incident data, enabling teams to better understand how SLOs and incidents intersect. Built on data from Datadog SLOs and Incident Management, this unified perspective helps engineering leaders assess whether teams are meeting goals for uptime and availability, and determine whether incidents correlate with SLO breaches or if additional SLOs need to be implemented to prevent incidents.
For example, a manager can quickly see how teams and services are tracking against key user journeys, then drill down into specific SLOs that need improvement. The report also includes a new SLO score, which distills multiple SLOs into a single performance signal for faster decision-making.
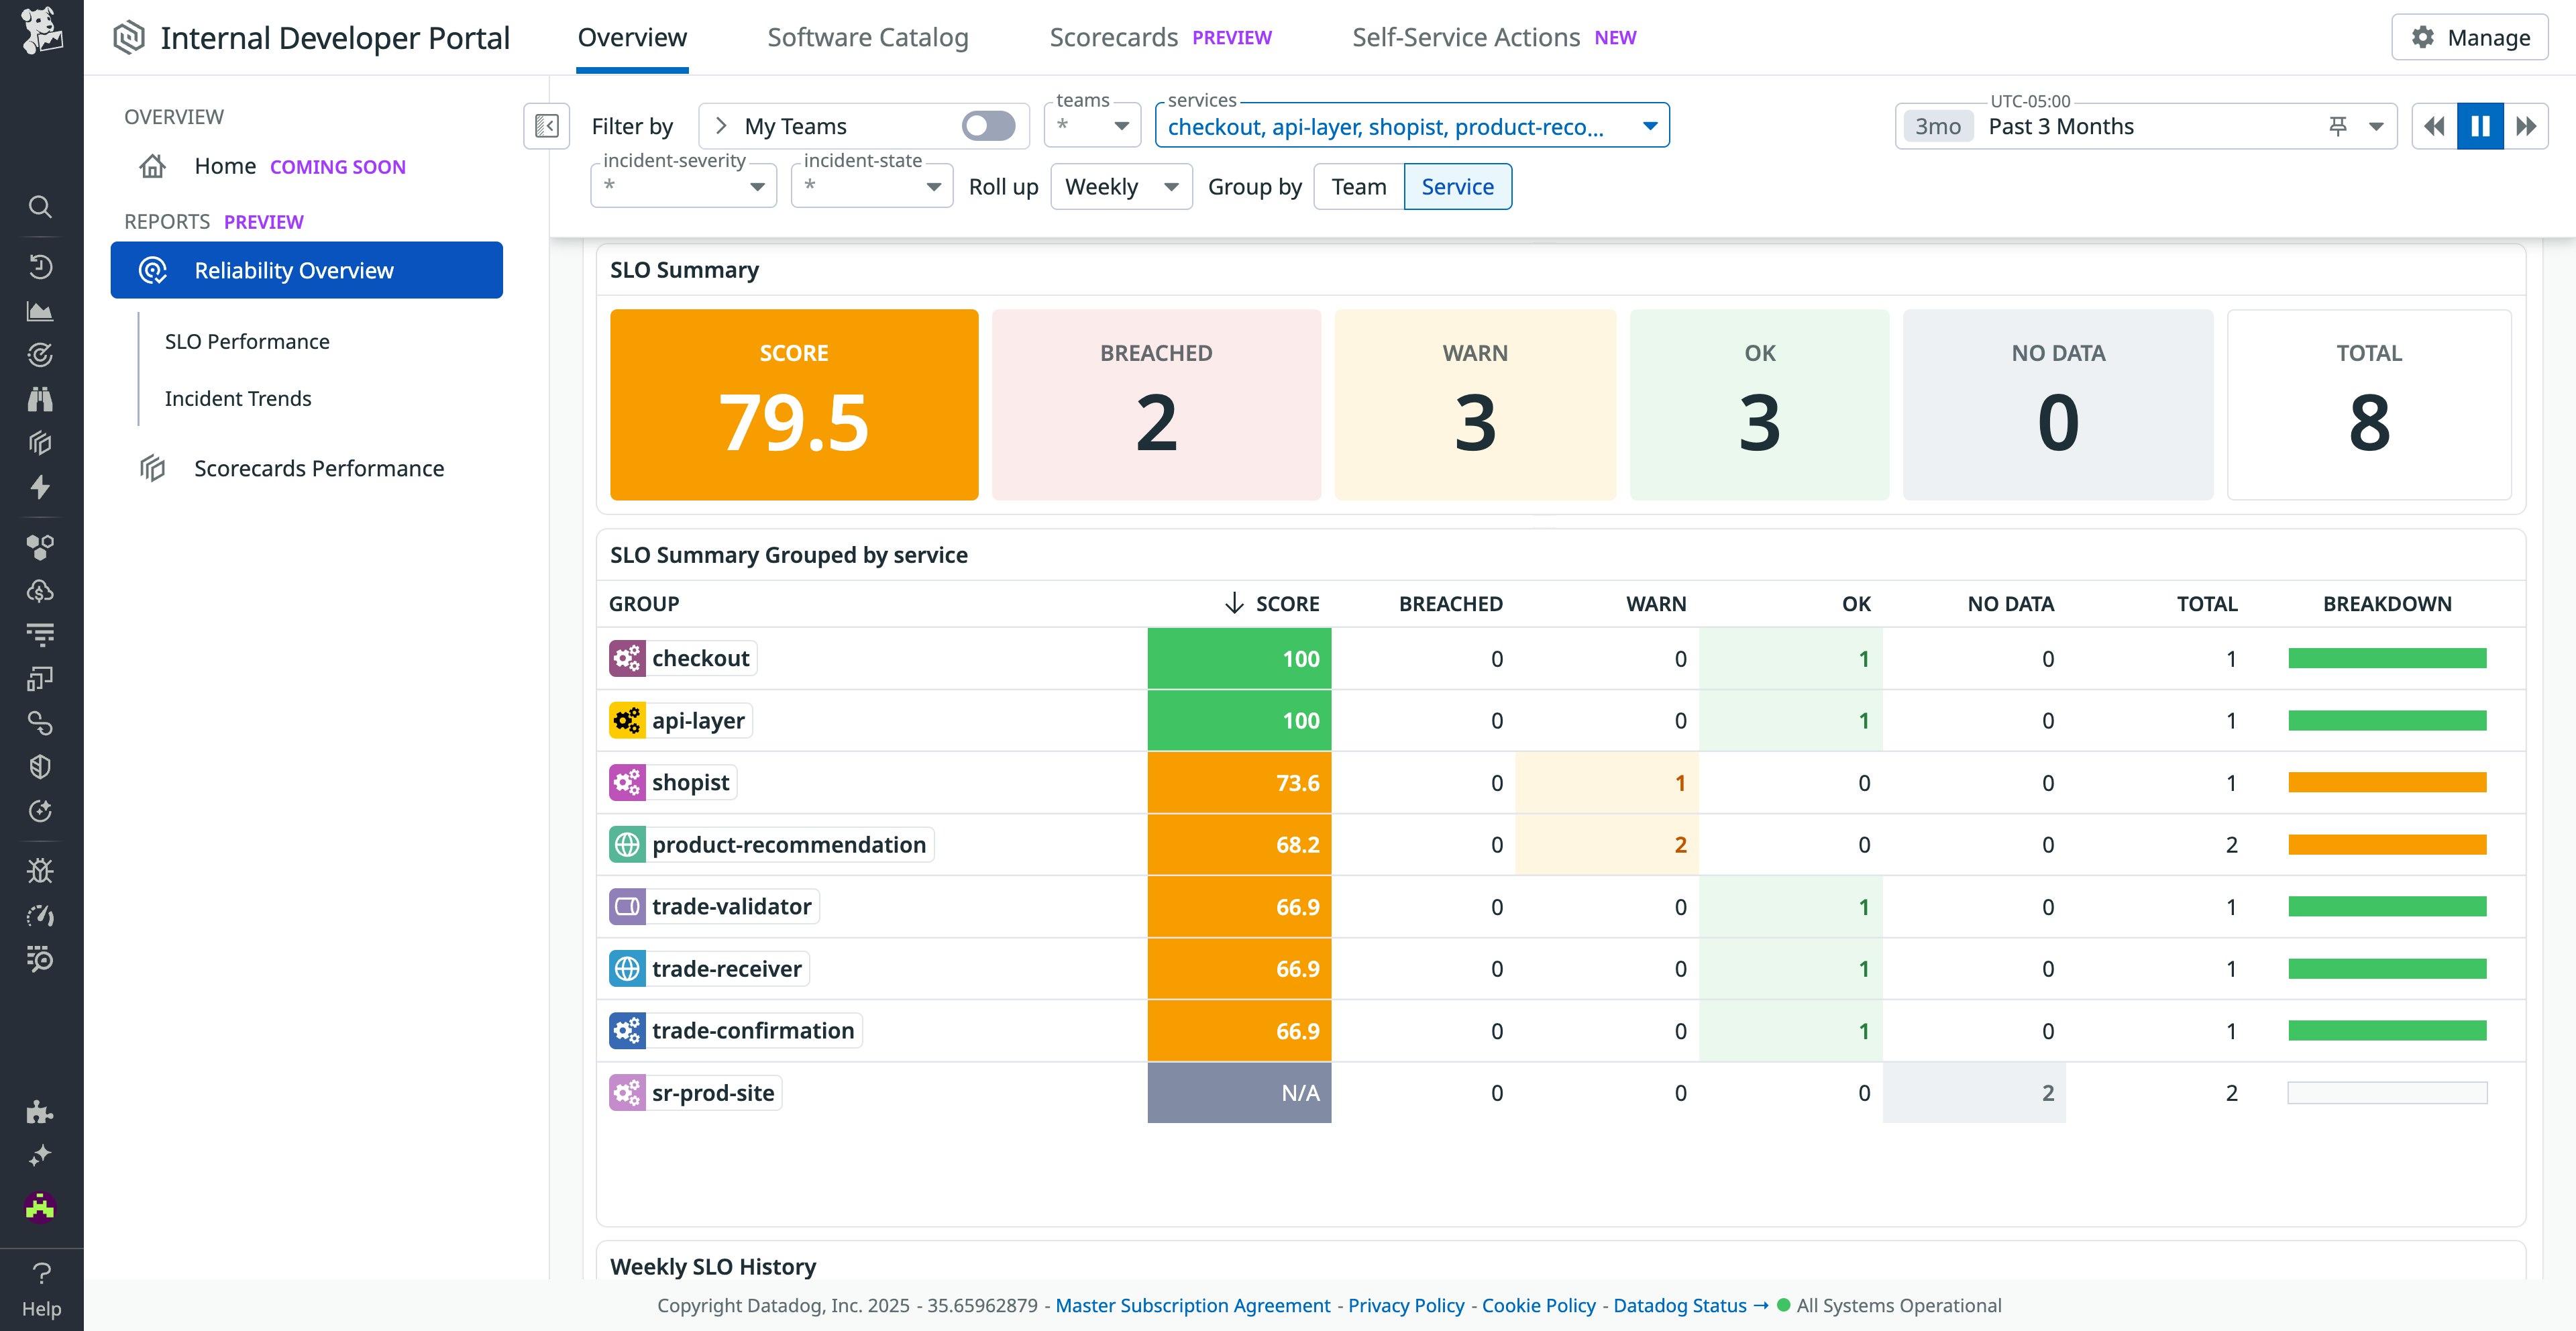
Below these metrics, you can see incident trends—such as mean time to resolution (MTTR), impacted services, and severity—for broader insights into how well your teams are responding to issues.
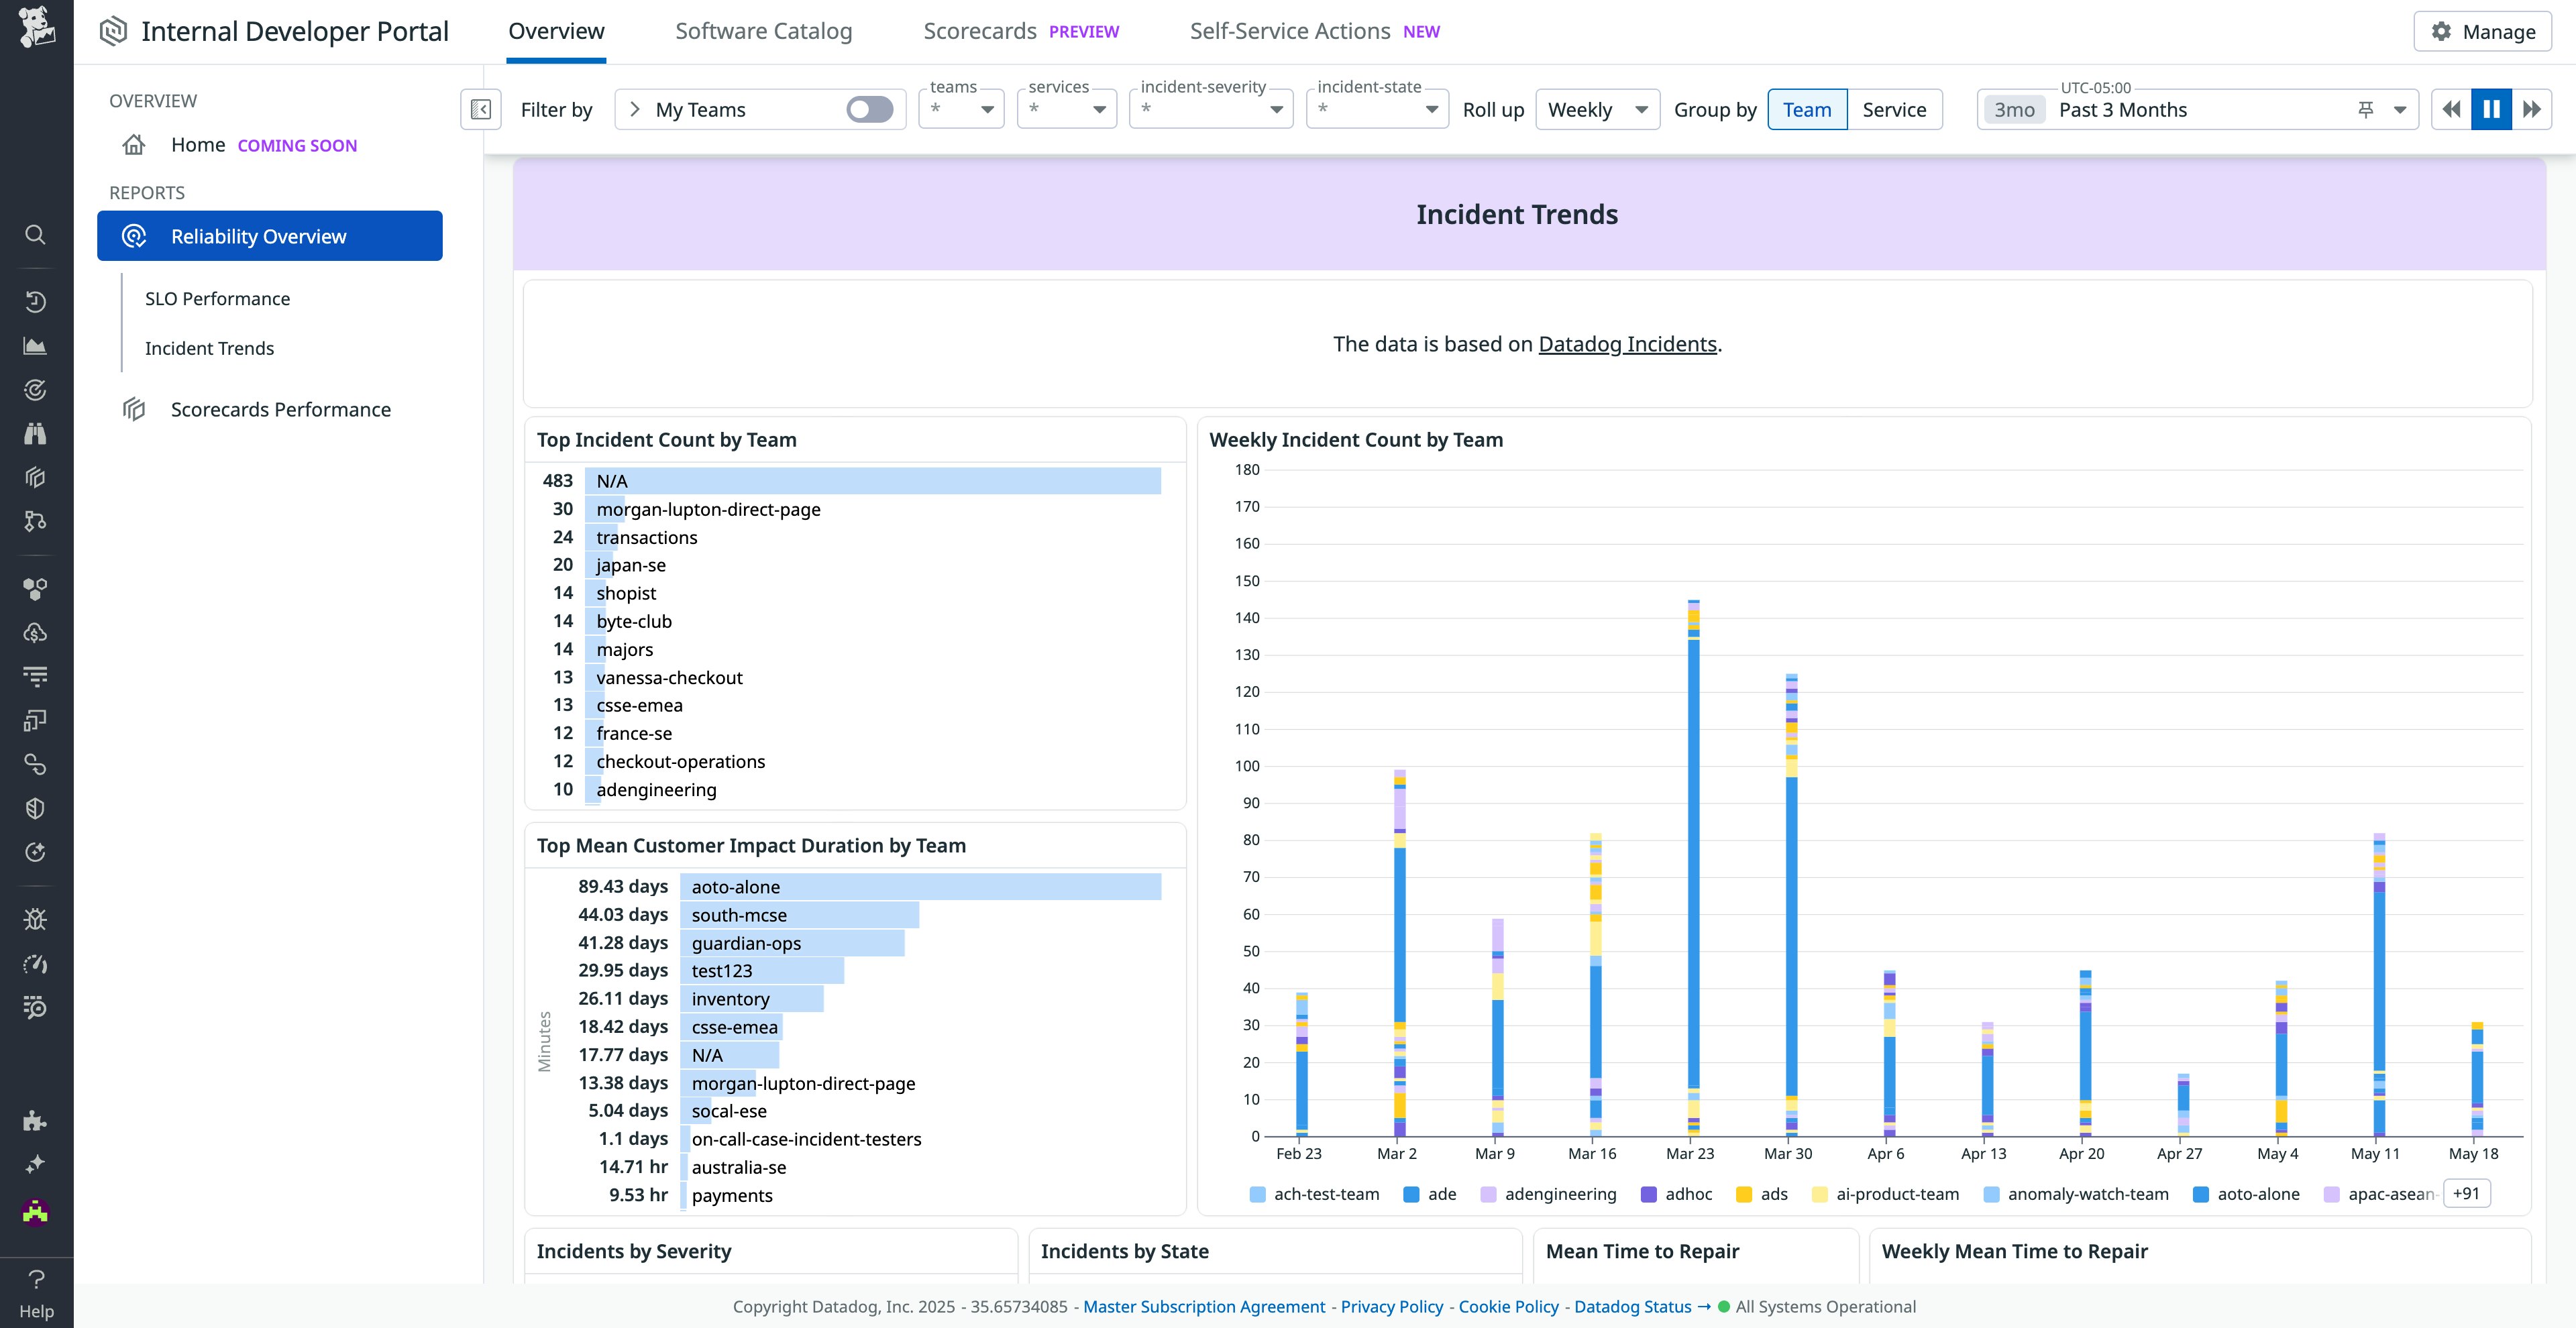
This comprehensive view into team performance provides key insights that help you make critical decisions—such as how to balance reliability work with new feature development, or whether SLOs need to be adjusted—and drive proactive improvements to service health.
Monitor engineering standards with Scorecard adherence
Maintaining consistent engineering practices across teams is a common challenge, especially as organizations grow. The Scorecards Performance report in Datadog’s IDP makes it easy to monitor how well teams are aligning with defined standards. Whether you’re enforcing rules around documentation, observability, or production readiness, this report gives platform teams and engineering managers a structured overview of compliance with these standards.
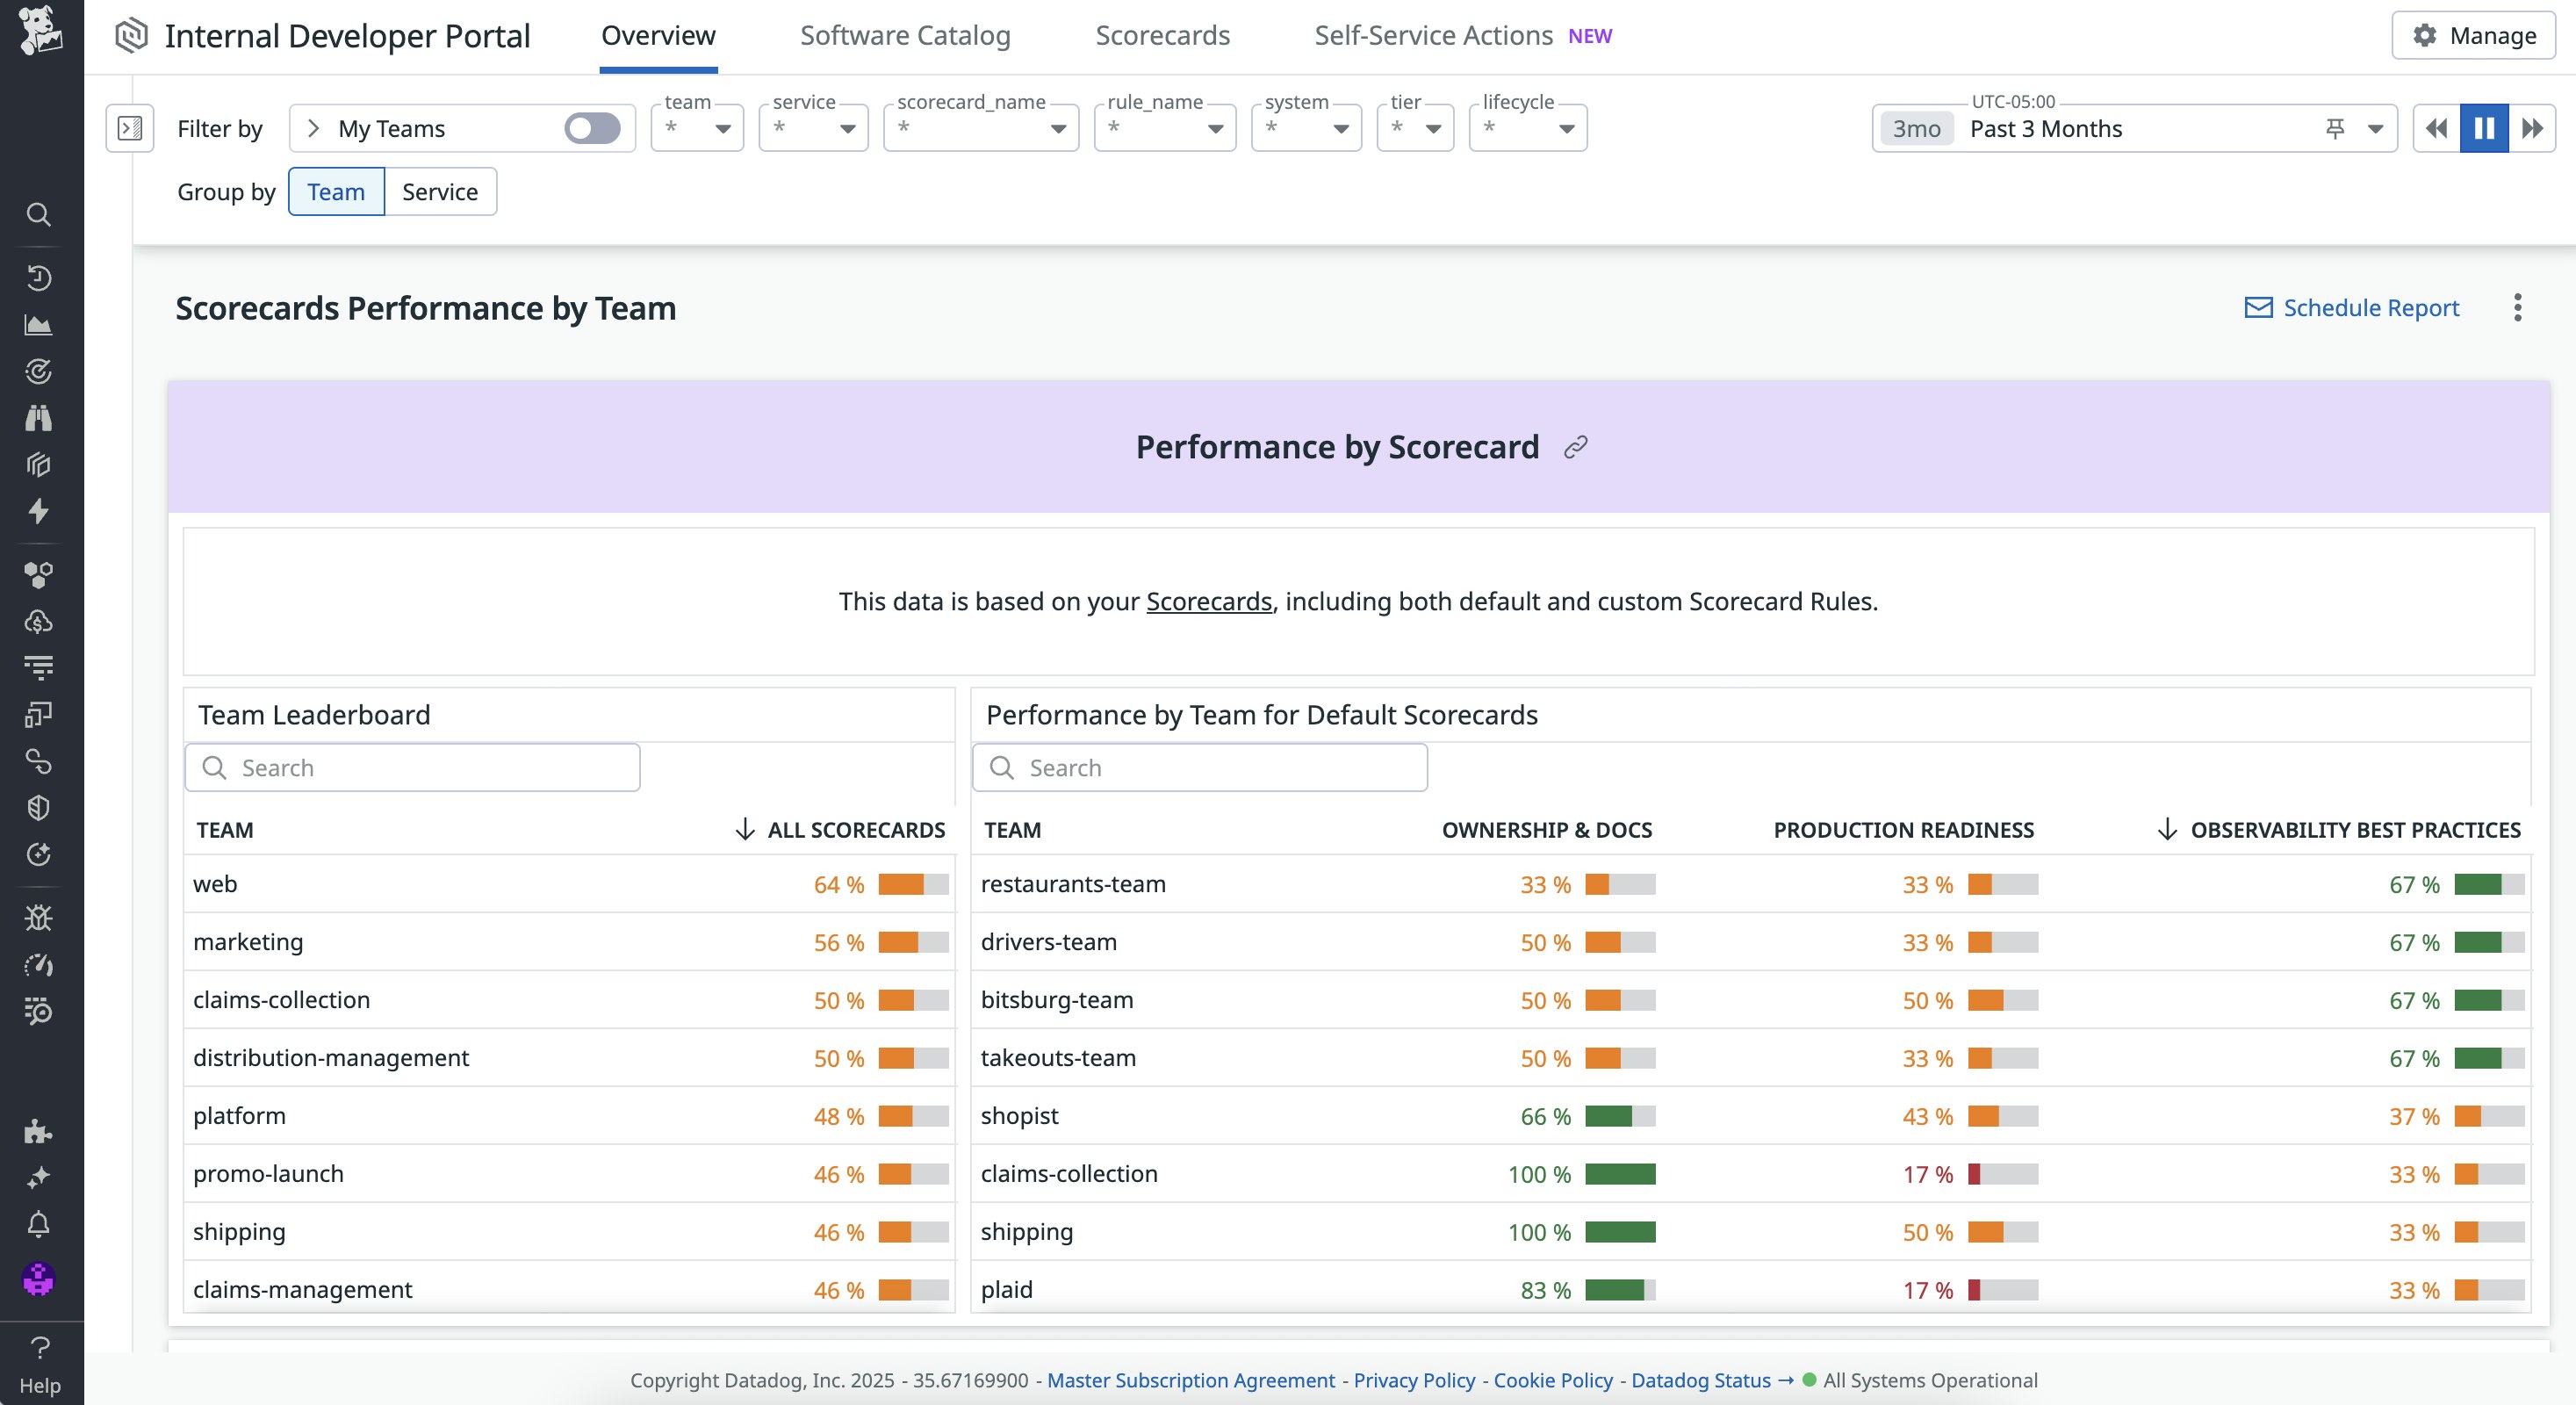
Here, you can view Scorecard adherence by team or service, highlighting areas within your organization that may need additional support. You can also see trends over time, which help you track whether improvements are sticking or if further guidance is needed. This level of visibility empowers leaders to set realistic goals, celebrate teams that are excelling, and work collaboratively with those that may be falling behind.
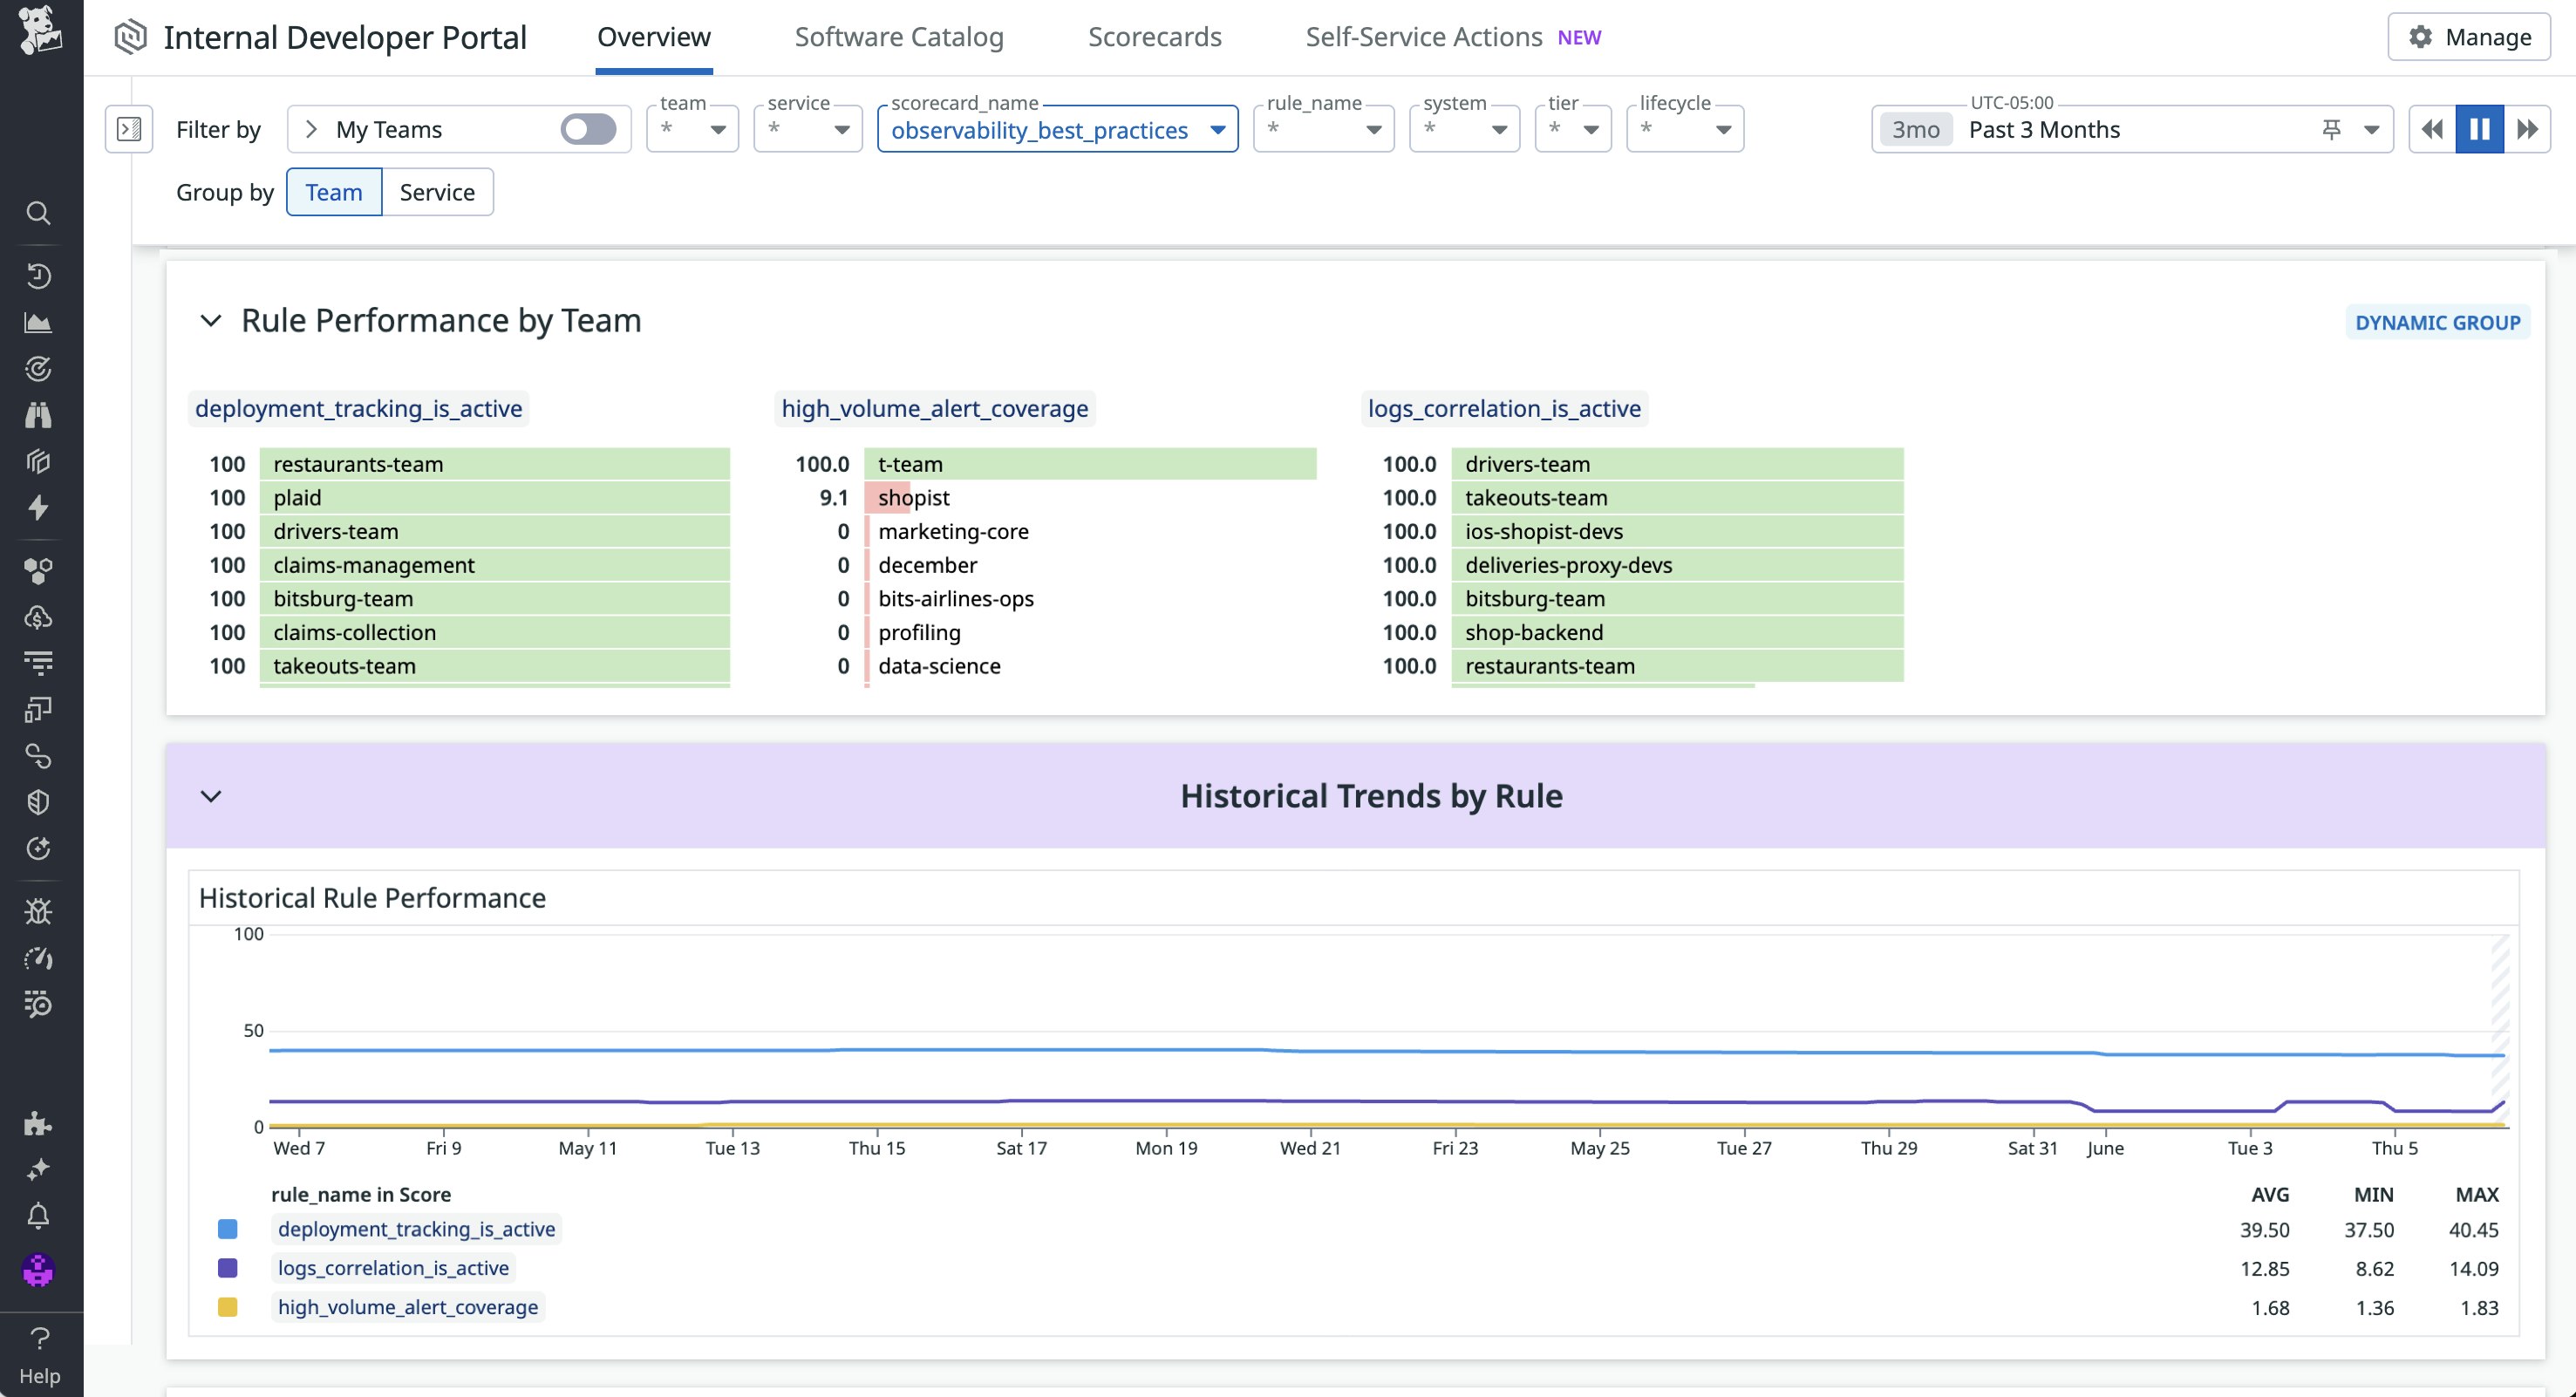
By surfacing these metrics in a single place, the report helps engineering managers understand trends in Scorecard adherence at a glance, without delving into individual Scorecards, so they can make informed decisions about how best to improve engineering health.
Identify delivery bottlenecks with DORA metrics
Speed and stability are key indicators of engineering effectiveness, yet many organizations lack a consistent way to measure them. Building on insights from Datadog DORA Metrics, the DORA Metrics Summary report in Datadog’s IDP brings these KPIs front and center, offering visibility into deployment frequency, lead time for changes, change failure rate, and the time to a restore service. These metrics provide a high-level summary of software delivery performance across services, teams, and environments.
Executives and team leads can compare trends across departments, investigate areas that are underperforming, and identify high-functioning teams whose practices can be replicated. For example, a noticeable spike in lead time may indicate friction in the review process, while low deployment frequency could point to bottlenecks in CI/CD pipelines.
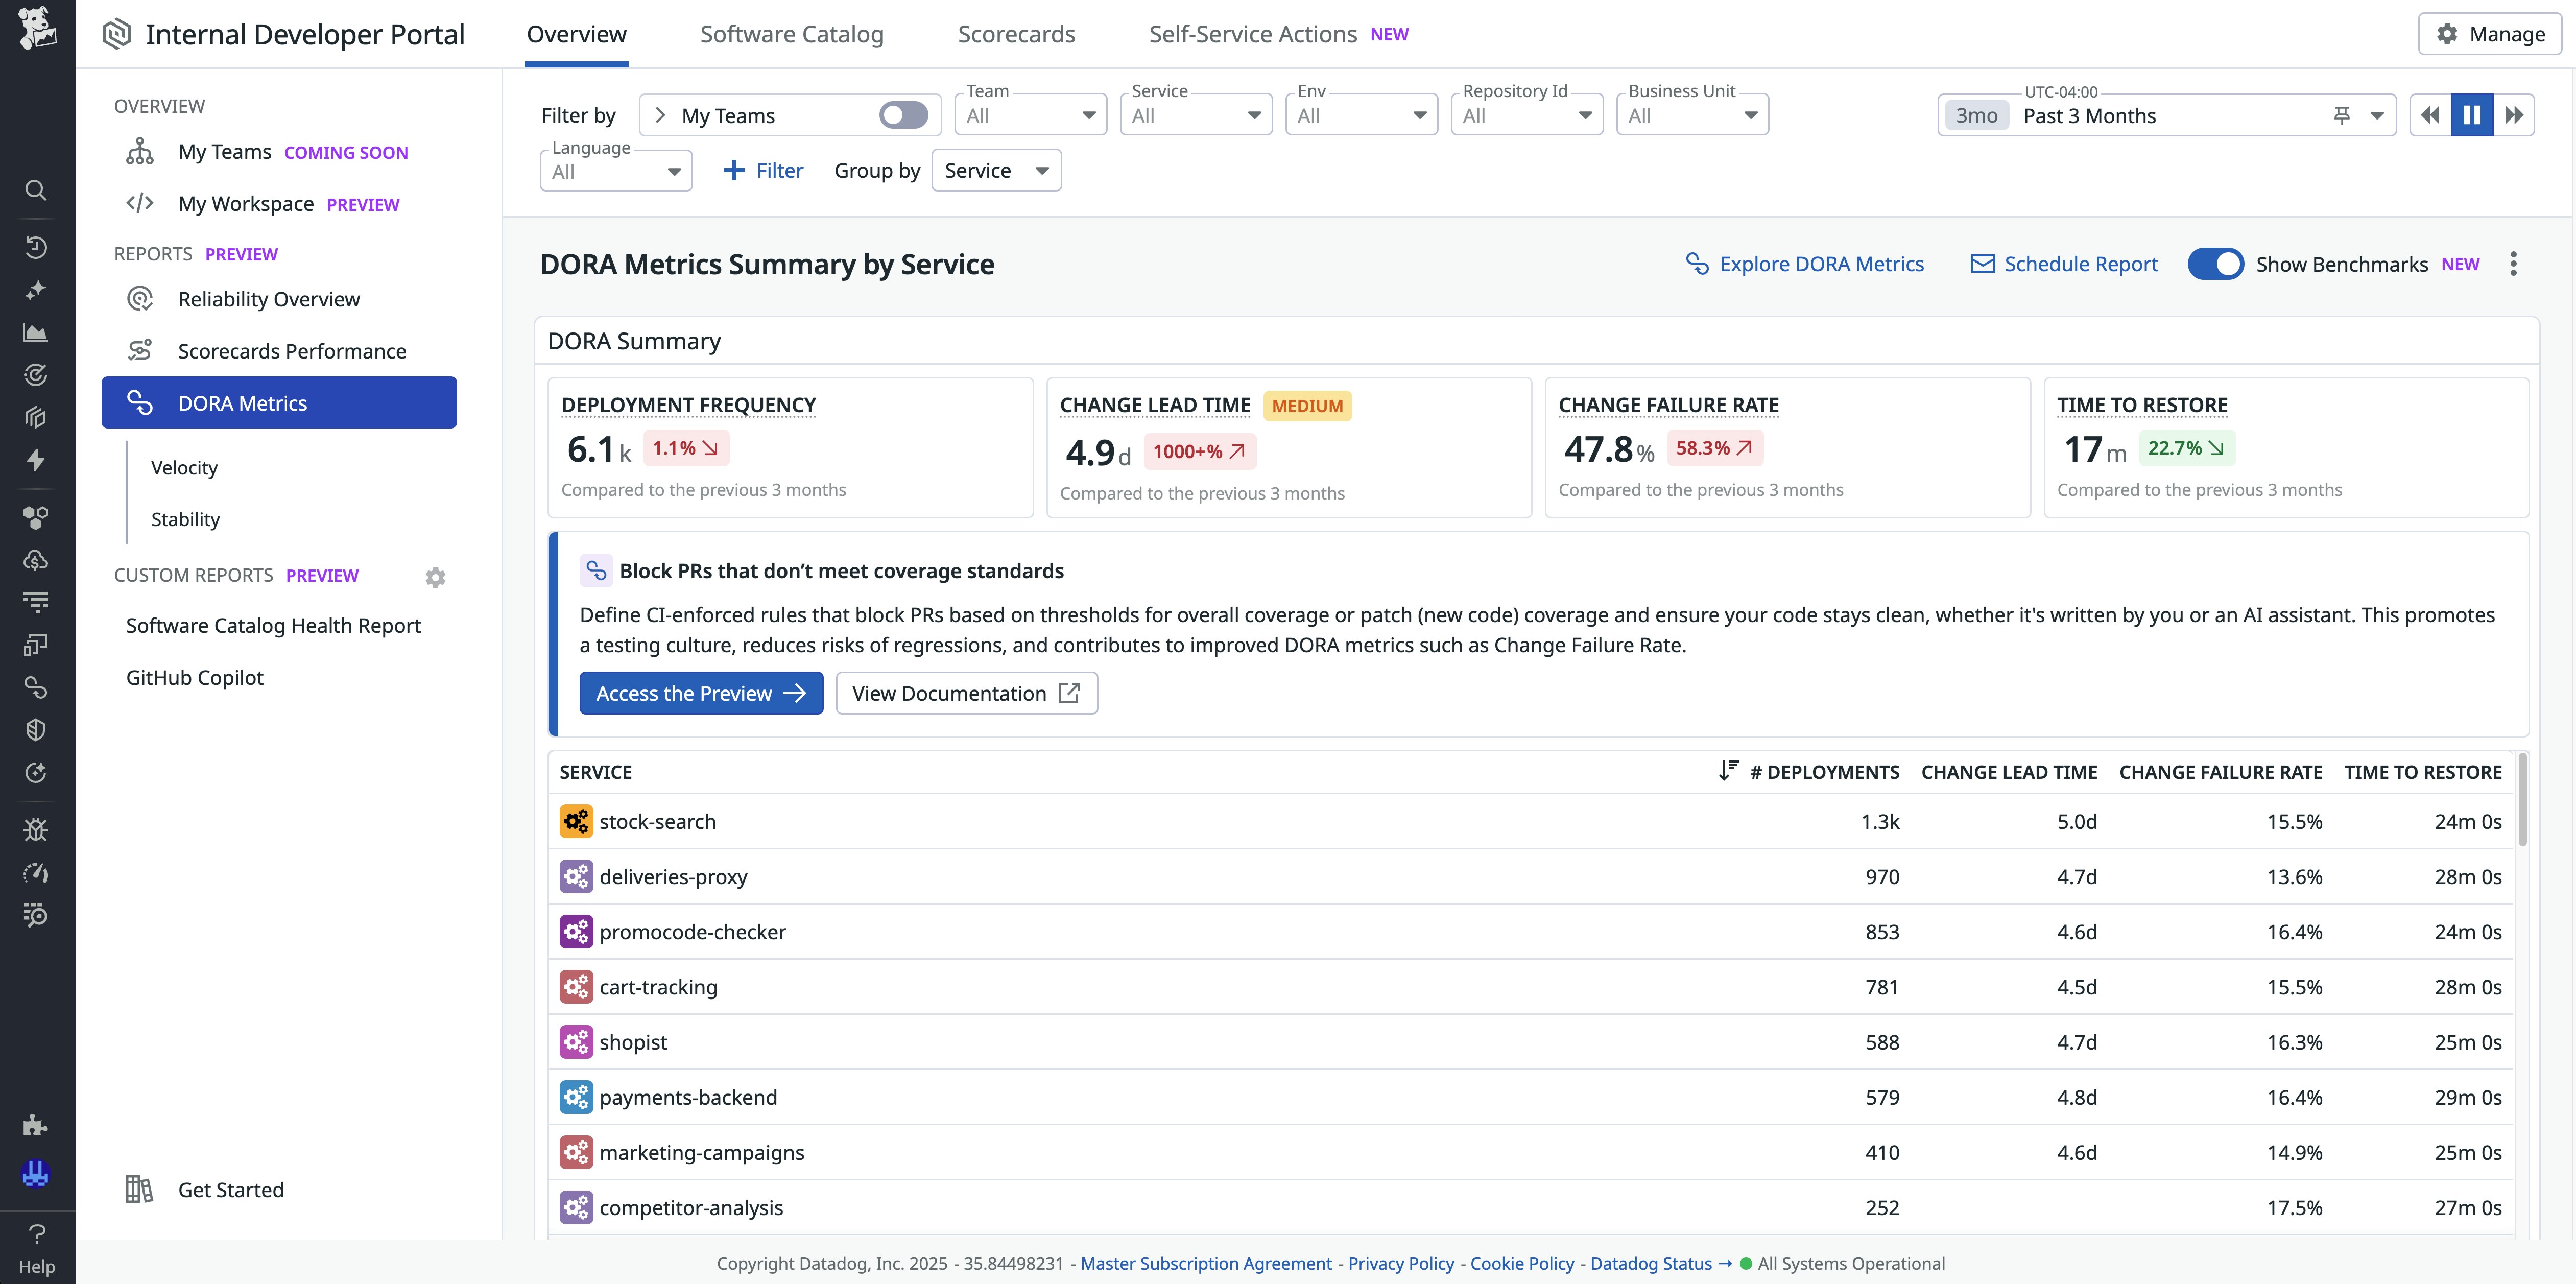
This long-term view helps teams evaluate the business impact of delivery initiatives, identify gaps in the SDLC, and continuously iterate on development workflows.
Improve engineering outcomes with actionable insights
With the addition of Engineering Reports, Datadog’s IDP becomes a central source of truth for engineering organizations. These new capabilities make it easier to measure what matters, including product reliability, compliance with software development standards, and delivery performance. Teams gain insight into long-term trends while being able to act on issues as they arise.
To get started, check out the Datadog IDP documentation. If you don’t already have a Datadog account, you can sign up for a 14-day free trial.
