John Matson
How you go about capturing and monitoring Azure metrics depends on your use case and the scale of your infrastructure. There are several ways to access metrics from Azure VMs: you can graph and monitor metrics using the Azure web portal, you can access the raw metric data via Azure storage, or you can use a monitoring service that integrates directly with Azure to gather metrics from your VMs. This post addresses the first two options (using the Azure web portal and accessing raw data); a companion post describes how to monitor your VMs by integrating Azure with Datadog.
Viewing Azure metrics in the web portal
The Azure web portal has built-in monitoring functionality for viewing and alerting on performance metrics. You can graph any of the metrics available in Azure and set simple alert rules to send email notifications when metrics exceed minimum or maximum thresholds.
Enabling Azure VM monitoring
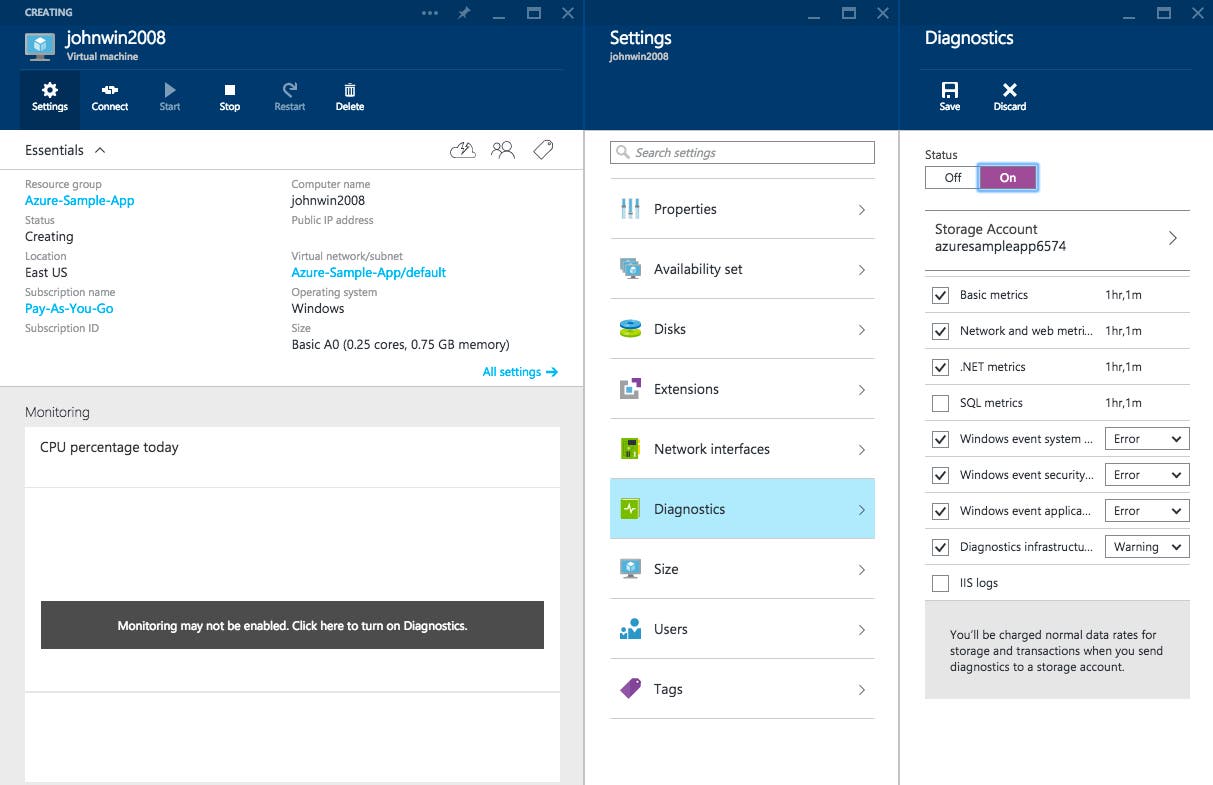
Azure’s Diagnostics extension can be enabled when you create a new virtual machine via the Azure web portal. But even if you disabled Diagnostics when creating a VM, you can turn it on later from the “Settings” menu in the VM view. You can select which metrics you wish to collect (Basic metrics, Network and web metrics, .NET metrics, etc.) in the Diagnostics tile as well. You will have to link the VM to an Azure storage account to store your Diagnostics data.
Viewing Azure metrics in the web portal
Once monitoring is enabled, you will see several default metric graphs when you click on your VM in the Azure portal.
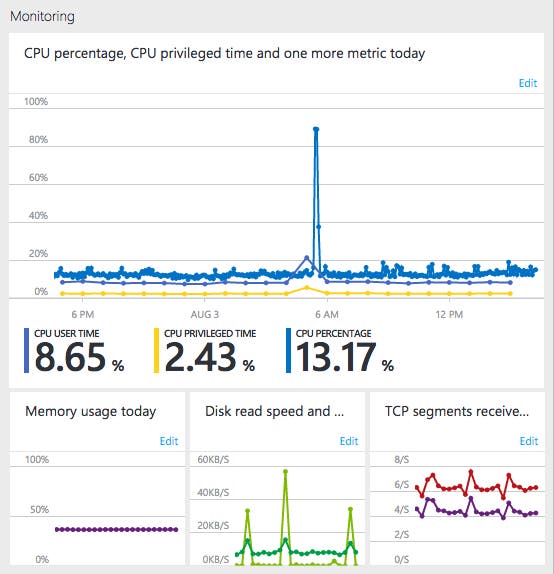
Clicking on any monitoring graph opens a larger view, along with two important settings options: “Edit chart,” which allows you to select the metrics and the timeframe displayed on that graph, and “Add alert,” which opens the Azure alerting tile.
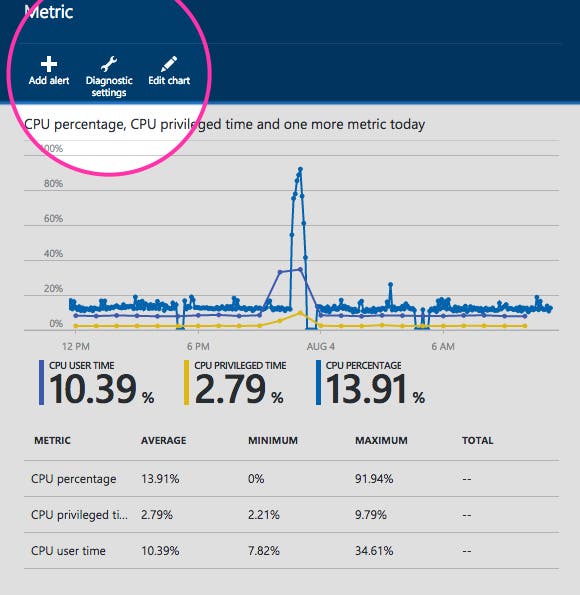
Adding alert rules
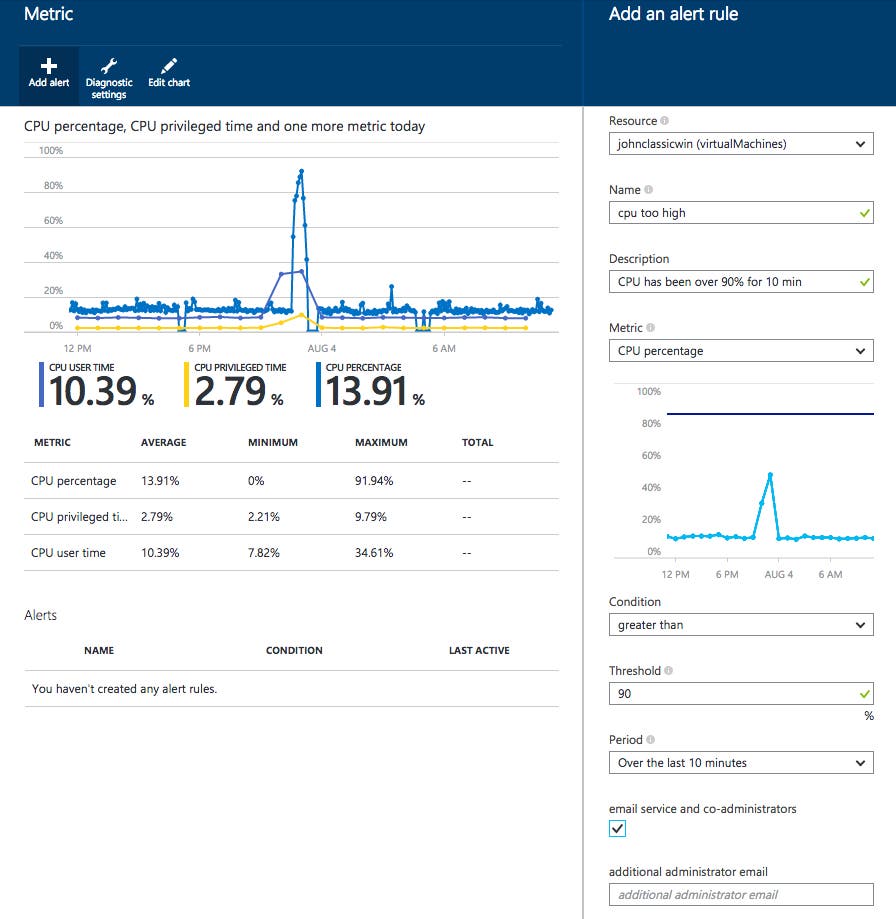
In the alerting tile you can set alerts on Azure VM metrics. Azure alerts can be set against any upper or lower threshold and will alert whenever the selected metric exceeds (or falls below) that threshold for a set amount of time. In the example below, we have set an alert that will notify us by email whenever the CPU usage on the given virtual machine exceeds 90 percent over a 10-minute interval.
Accessing raw metric data in Azure storage
Because Azure metrics are written to storage tables, you can access the raw data from Azure if you want to use external tools to graph or analyze your metrics. This post focuses on accessing metrics via Microsoft’s Visual Studio IDE, but you can also copy metric data tables to local storage using the AzCopy utility for Windows, or you can access metric data programmatically using the .NET SDK. Note that the Azure command-line interface, which is available for Mac, Linux, and Windows, will allow you to view the list of tables in your storage accounts (via the azure storage table list command) but not the actual contents of those tables.
Connecting to Azure in Visual Studio Cloud Explorer
Starting with Visual Studio 2015 and Azure SDK 2.7, you can now use Visual Studio’s Cloud Explorer to view and manage your Azure resources. (Similar functionality is available using Server Explorer in older versions of Visual Studio, but not all Azure resources may be accessible.)
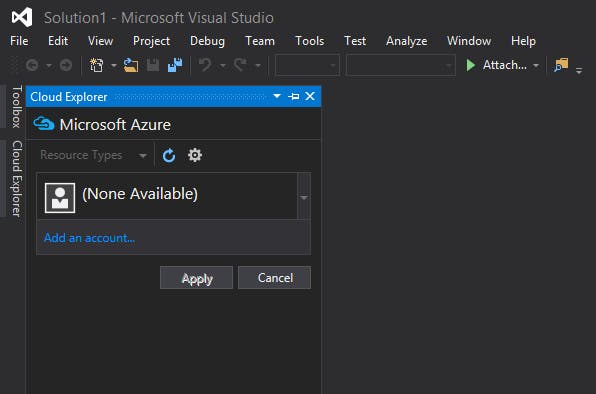
To view the Cloud Explorer interface in Visual Studio 2015, go to View > Other Windows > Cloud Explorer.
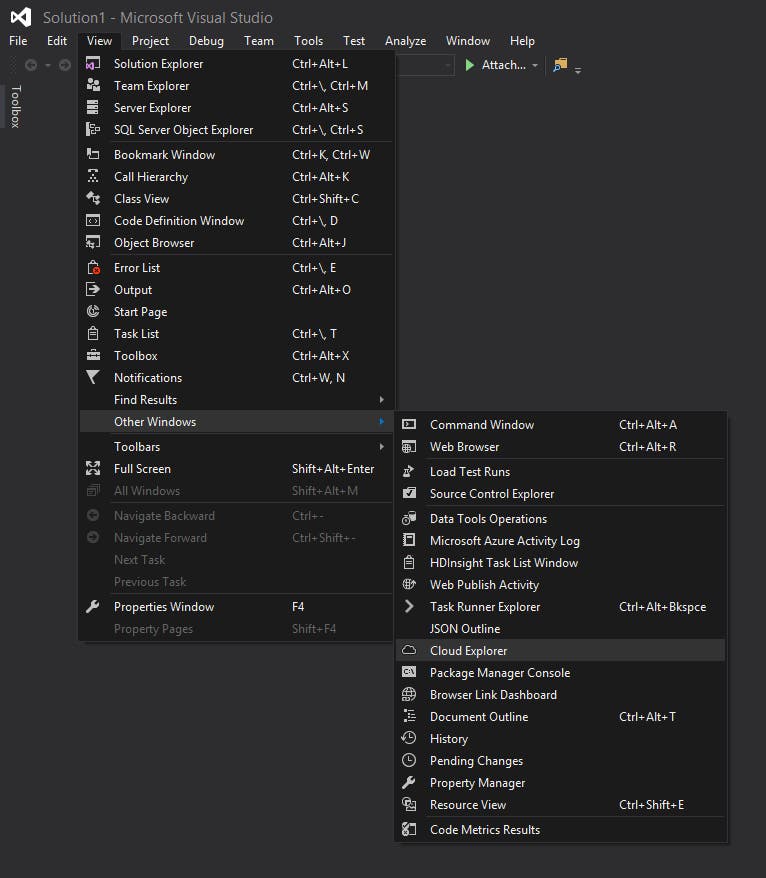
Connect to your Azure account with Cloud Explorer by clicking on the gear and entering your account credentials.
View stored Azure metrics
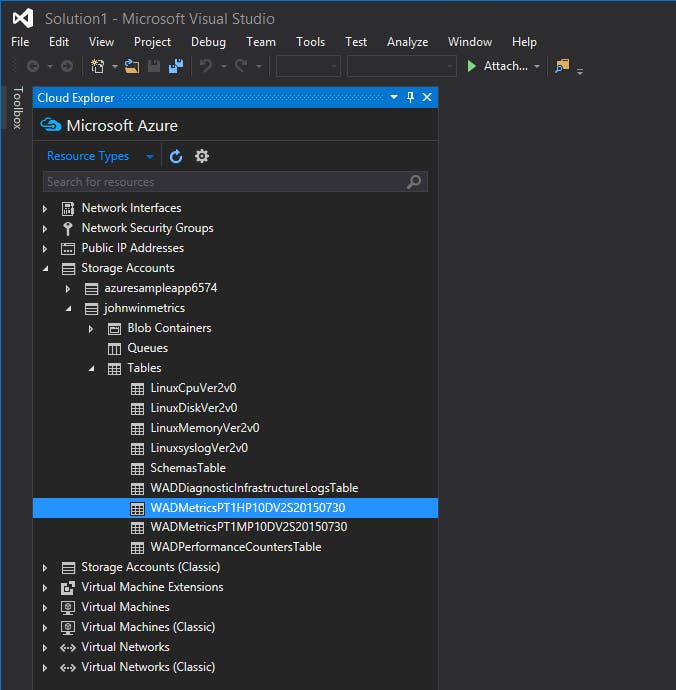
Once you have signed in to your Azure subscription, you will find your metric storage listed under “Storage Accounts” or “Storage Accounts (Classic),” depending on whether the storage account was launched on Azure’s Resource Manager stack or on the Classic Stack.
Metrics are stored in tables, the names of which usually start with “WADMetrics.” Open up a metric table in one of your metric storage accounts, and you will see your VM metrics. Each table contains 10 days worth of data to prevent any one table from growing too large; the date is appended to the end of the table name.
Using stored metrics
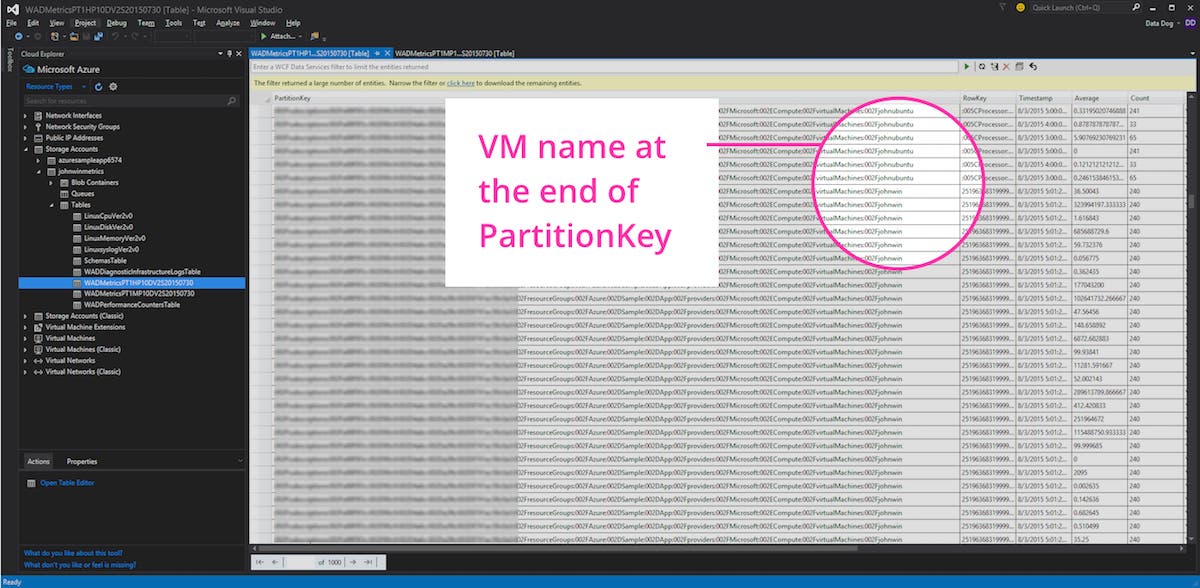
The name of your VM can be found at the end of each row’s partition key, which is helpful for filtering metrics when multiple VMs share the same metric storage account. The metric type can be found in the CounterName column.
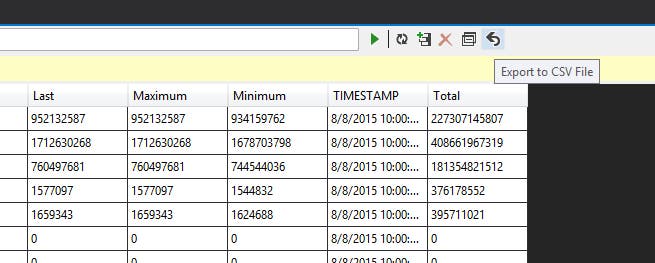
To export your data for use in Excel or another analytics tool, click the “Export to CSV File” button on the toolbar just above your table.
Conclusion
In this post we have demonstrated how to use Azure’s built-in monitoring functionality to graph VM metrics and generate alerts when those metrics go out of bounds. We have also walked through the process of exporting raw metric data from Azure for custom analysis.
At Datadog, we have integrated directly with Azure so that you can begin collecting and monitoring VM metrics with a minimum of setup. Learn how Datadog can help you to monitor Azure in the next and final post of this series.
Source Markdown for this post is available on GitHub. Questions, corrections, additions, etc.? Please let us know.
