Paul Gottschling
Datadog Technical Content Writer
Harbor, developed by VMware and hosted by the CNCF, is an open source registry for container images and Helm charts. Hosting Harbor within your infrastructure gives you a number of advantages over using the default Docker registry, such as role-based access control, security scanning, and replication of resources between registry instances. Since a failed Harbor deployment can spell trouble for your containerized workloads, monitoring your self-hosted container registry is critical. Datadog's new integration for Harbor container registry allows you to track the health and performance of Harbor alongside that of your containerized applications and infrastructure.

Track registry disk usage
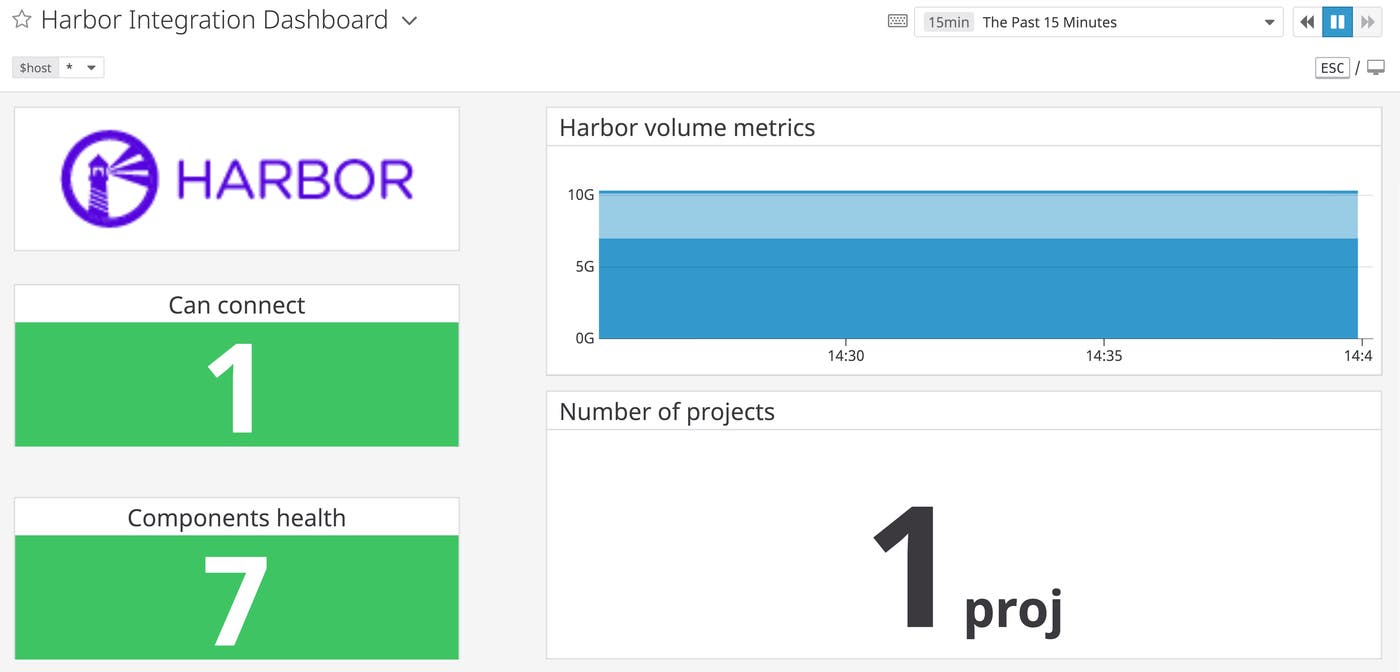
Harbor container registry uses a database to store its critical data, including images and Helm charts. Monitoring Harbor's disk usage allows you to ensure that your containerized services can access the resources they need. With the out-of-the-box dashboard for Harbor, you can track the capacity of Harbor's image database by comparing the total size of its storage volume to the amount of space remaining. As a result, you can tell in real time whether Harbor's storage resources are adequate, and reconfigure your storage backend if not.
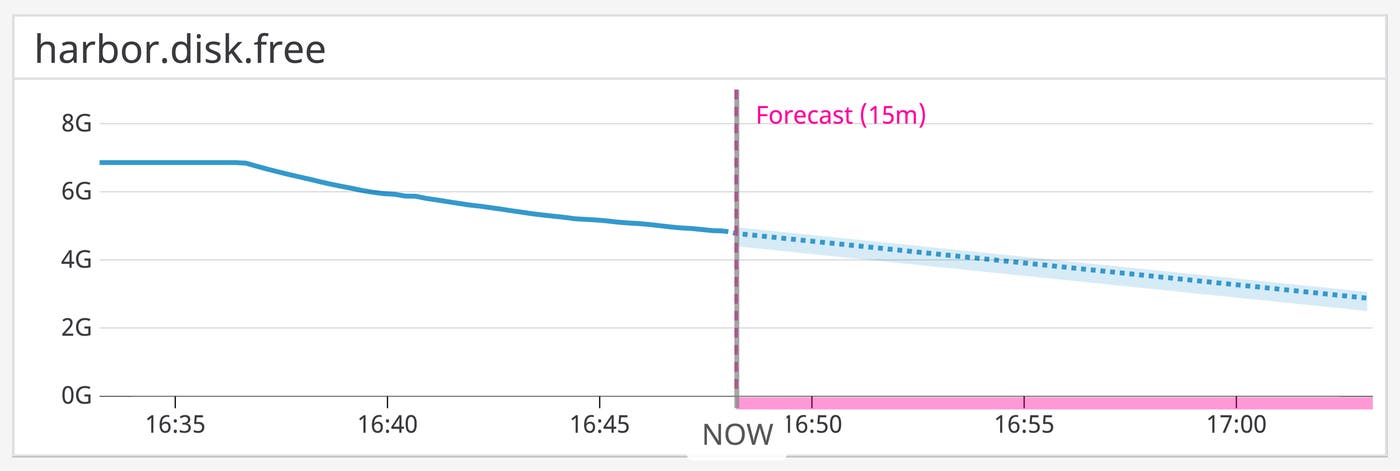
And with Datadog's forecasting algorithms, you can visualize the projected disk usage of your Harbor deployment and get notified when you need to scale Harbor's storage resources. Datadog also tracks the number of projects stored within the database, and you can correlate this metric with disk usage to estimate the storage capacity you'll need to accommodate the demand on your registry.

Get notified if Harbor goes down
If you're using Harbor's HTTP API to manage your registry, you'll want to ensure that your deployment's HTTP backend is running when you need it. The Harbor integration includes a service check for the availability of the API, returning CRITICAL if the API is unavailable. You can configure Datadog to notify you if the Agent can't reach the API within a certain amount of time, e.g., because of a DNS misconfiguration or high CPU utilization on a Harbor host.
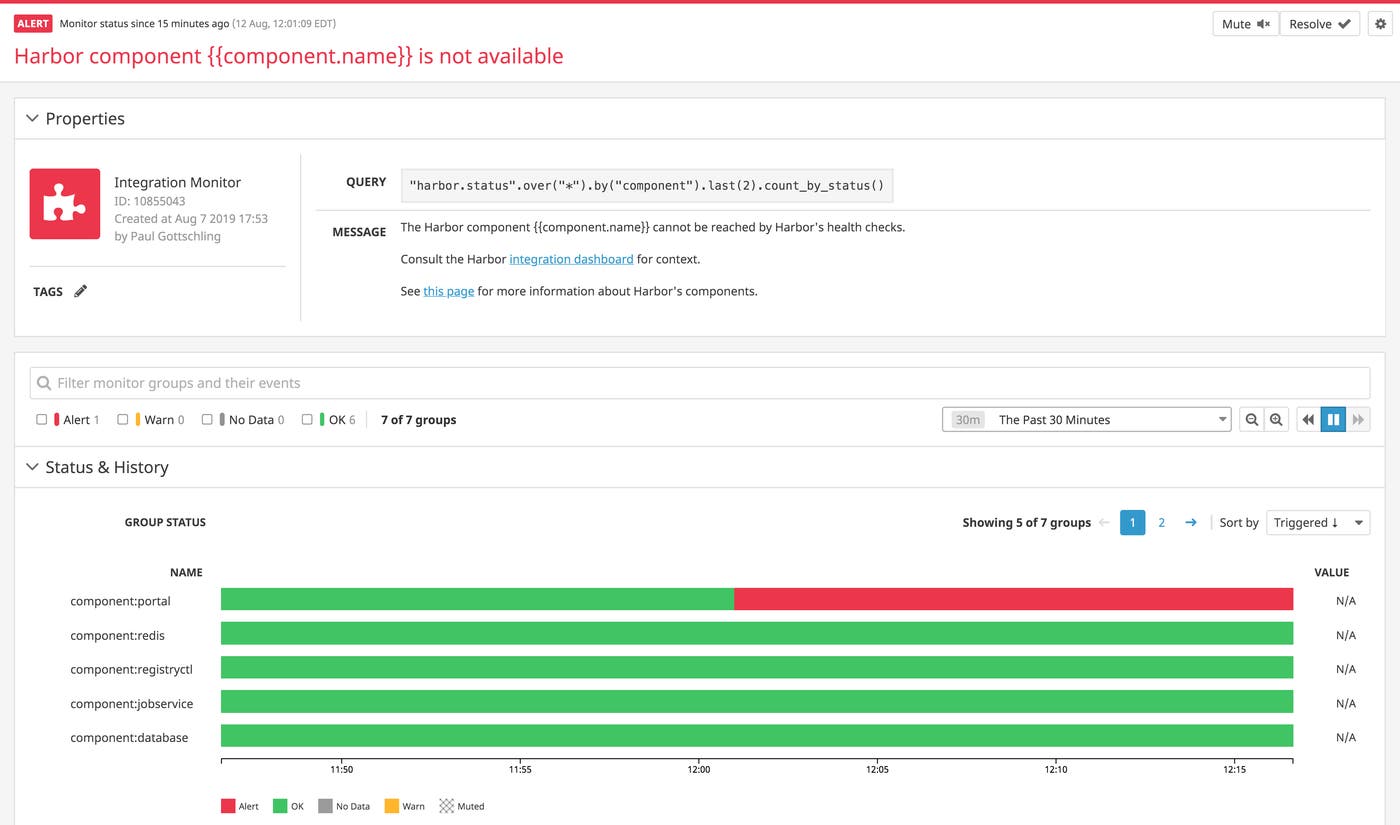
Harbor container registry runs automatic health checks on each of its components, including the built-in database and Redis cache. You can use Datadog to automatically track the status of these health checks, and get notified if they fail. With the component tag, you can configure the alert to trigger a separate notification for each failing component, so you'll know where to start troubleshooting.

Analyze your Harbor logs for faster troubleshooting
Since Harbor runs as a containerized, distributed system, it logs events from multiple components at once. Datadog's out-of-the-box log processing pipeline makes it easier to analyze Harbor logs by extracting relevant attributes from each of Harbor's components. You can investigate issues with the HTTP API, for example, by filtering by URL path, status code, and HTTP method, and investigate database issues by filtering by operation. You can also get a high-level view of your Harbor deployment's health by visualizing aggregate log status by Harbor component, as shown below.

Keep Harbor container registry above water
Now that Datadog integrates with Harbor, you can get the visibility you need to ensure uptime for your self-hosted registry—and the services that depend on it. And since Datadog also integrates with Docker, Kubernetes, and more than 1,000 other technologies, you can monitor all of your containerized services in one place. If you haven't started using Datadog yet, you can sign up for a fully featured free trial.

