Anthony Rindone

Eric Metaj
Modern CI/CD pipelines have automated the hard work of building, testing, and deploying our code. But for many teams, that’s where the automation stops. The most critical part of a release, turning a new feature on for real users, is still a stressful, manual process.
An engineer cautiously ramps up traffic to 5%, then 10%. The whole team stares at dashboards, trying to see if anything breaks. If something does, they scramble to manually roll back. We call this process babysitting a release, and it’s slow, risky, and doesn’t scale. In this post, we’ll look at the challenges of manual rollouts and show you how automating releases with guardrail metrics can save your team time, reduce risk, and eliminate the need to babysit rollouts.
Create an automated safety net with guardrail metrics
Consider a Tuesday afternoon release war room, where three engineers and a product manager huddle in a video call. One engineer has their finger on the feature flag’s traffic slider, while the others have multiple Datadog dashboards open. The rollout begins with the first engineer rolling out to 1% of the users. Slack fills with messages, with one engineer noticing a spike but unsure of the cause. It takes 10 minutes of frantic cross-checking before they realize a bug is causing a small but significant increase in errors. They manually roll back, but the issue has already affected hundreds of users, and the process has consumed over an hour of the team’s time.
The problem with the above example is the lack of an intelligent safety net that makes use of guardrail metrics. A guardrail metric is a specific health indicator that you choose to protect during a release. It acts as a tripwire. If your new feature causes this metric to cross a dangerous threshold, the system automatically takes action. You can use any metric you already have in Datadog to create a guardrail, such as:
- Error rate: Roll back if the 5xx error rate for the new version is higher than the baseline.
- CPU utilization: Roll back if the CPU on the service’s hosts exceeds 80%.
- P99 latency: Roll back if latency increases by more than 20% for the users with the new feature.
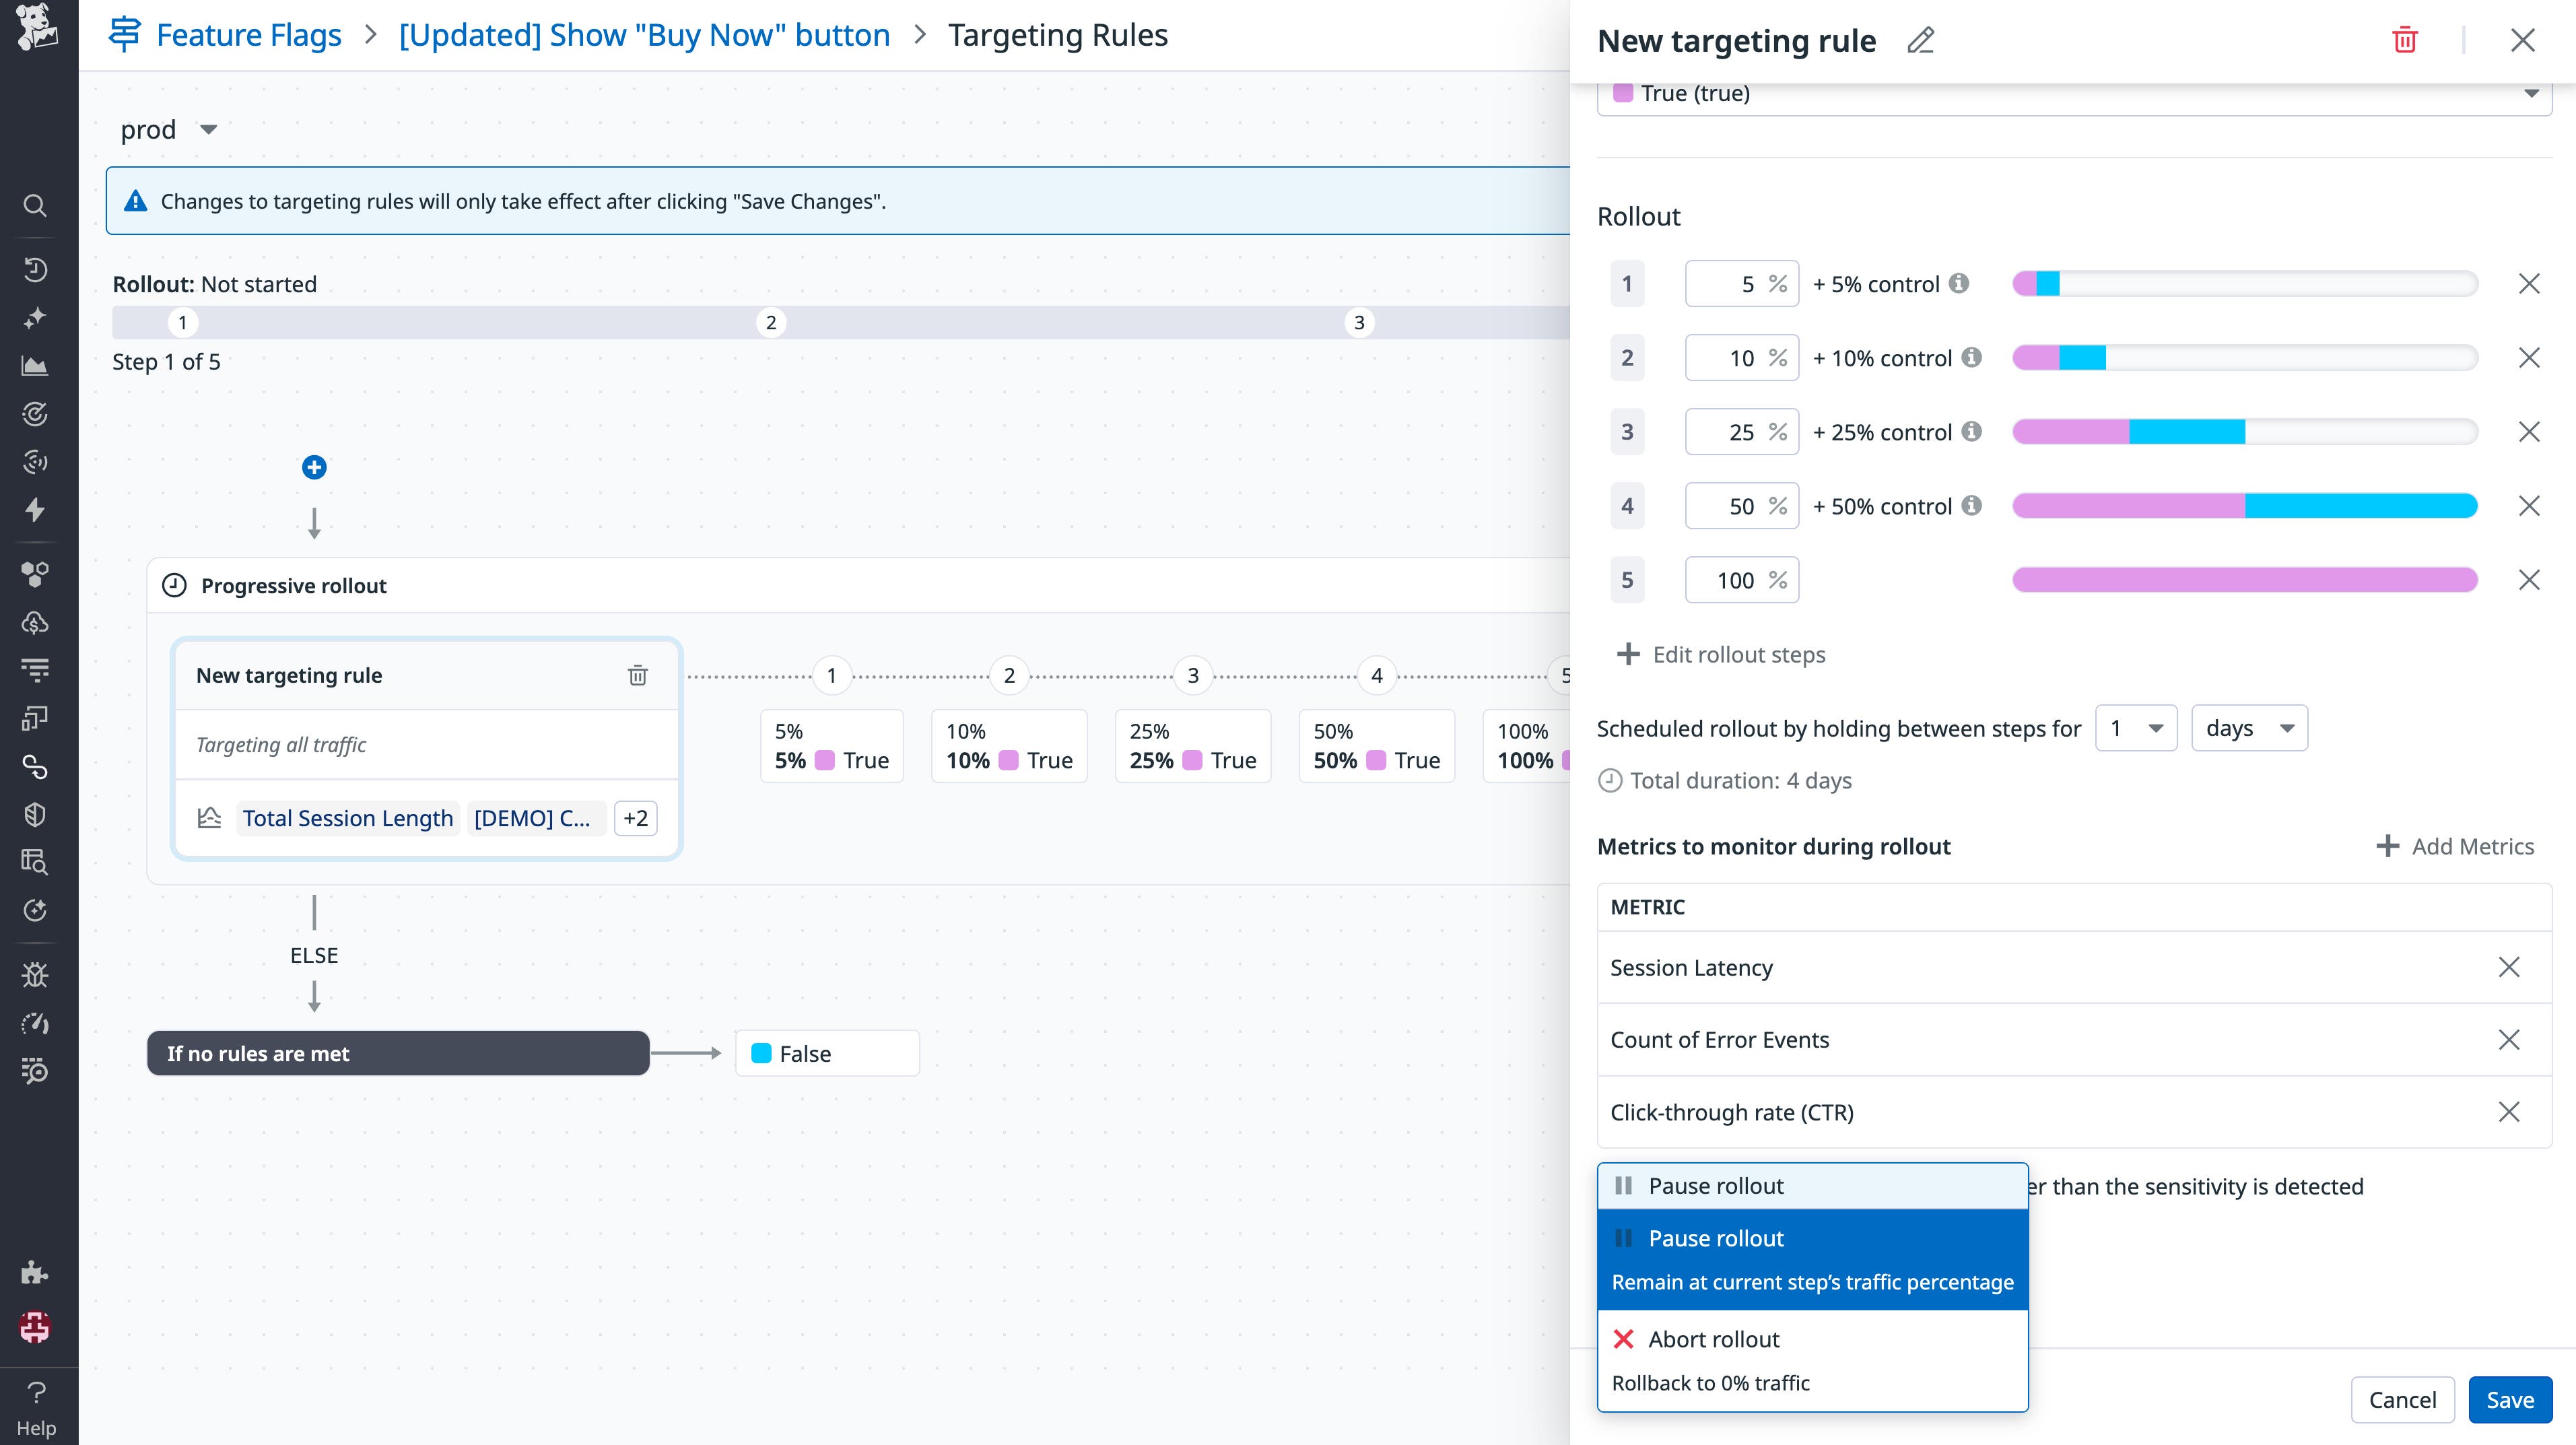
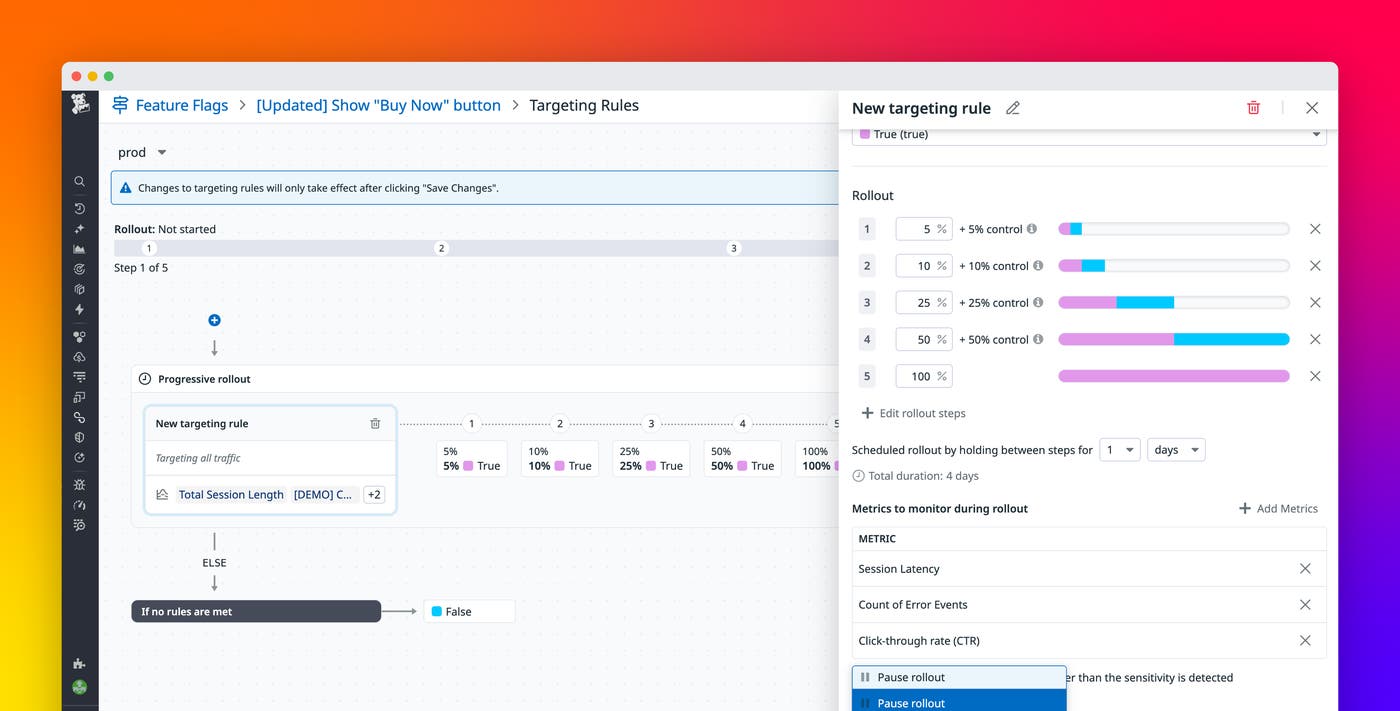
Let’s look at that same Tuesday release using guardrail metrics. A single engineer opens the feature flag, having already configured a three-stage rollout plan and linked it to a guardrail metric for the checkout service’s error rate. She clicks Start Rollout and turns her attention to her next task. Ten minutes later, a Slack alert appears: “Automated Rollback Triggered: ‘New Checkout Flow’ violated the error rate guardrail.” The system detected the error spike, automatically rolled the feature back to 0%, and prevented a wider incident. The entire event was handled in minutes, with minimal user impact and little engineering toil.
When your feature management is built into your observability platform, you can connect a release directly to these guardrails. Instead of manually ramping traffic, you can define a progressive rollout plan that will only advance to the next stage if your guardrail metrics are healthy. The moment a guardrail is breached, the system will instantly and automatically roll back the feature flag to 0%, stopping the incident before it impacts more users.
From guardrails to automated feature management
While defining a guardrail is an important first step, the real value comes from how it is enforced and the data behind it. That’s why Datadog Feature Flags runs on the same metrics foundation teams already use in Datadog. Existing APM service metrics, RUM performance data, and Product Analytics KPIs can be attached directly to a rollout, with no separate integration to maintain and no additional instrumentation required.
When you configure a progressive rollout, each stage is evaluated against live telemetry data before traffic expands. Server-side changes are validated with APM metrics such as error rate and latency, and client-side features are evaluated with RUM and Product Analytics signals such as page load time, frontend errors, and user behavior. This reduces incident risk and limits any potential incident damage.
The feature flag page surfaces real-time exposure and performance by variant, so you can see which cohorts are receiving the feature and how it affects system health. If metrics remain within defined thresholds, traffic increases automatically. If a threshold is breached, the rollout pauses or rolls back immediately. Manual release oversight can be eliminated, with rollouts advancing or reverting based on system health for smaller, safer changes.
Evaluate your release process today
Think about your last release. Was it a calm, automated process, or a manual, all-hands-on-deck event? If your team is still babysitting releases, it’s time to build a safety net. By connecting your releases to live observability data, you can finally stop babysitting them and build a repeatable, automated process that lets your team ship faster and with more confidence. To learn more, see how Datadog Feature Flags can connect your releases to your observability data. And check out our guide on configuring automated rollouts to get started.
If you’re new to Datadog, sign up for a 14-day free trial.
