Alexis Lê-Quôc
Of all days it had to happen on Friday the 13th. Last month, AWS customers experienced a partial network outage that partially severed an availability zone’s connectivity to the rest of the internet. A month before that, there was another gray failure with a very black-and-white impact on a dozen well-known internet services.
The point is not to lament failures of public clouds. Everyone, on-premise, in the clouds or anywhere in-between, experiences failures. Failures are a fact of life. AWS’s just get more publicity. Instead let’s focus on the more interesting question: What can we learn from these failures?
AWS failure incident #1: EBS
At Datadog HQ we saw the announcement pop up that Sunday at 4pm EDT in one of the AWS-centric screenboards. If you’ve turned on the AWS integration on and you have instances in us-east-1, you have seen it too.

Our key metrics were not affected (thanks to our past experience) so we could stay in proactive mode and formulate some hypotheses on what the impact would be, should the outage spread further. For that we relied heavily on our own metric explorer (yes, Datadog eats its own dog food).
Later that day, we received in the event stream more details about the outage (emphasis mine).

AWS failure incident #2: network outage in an EC2 zone
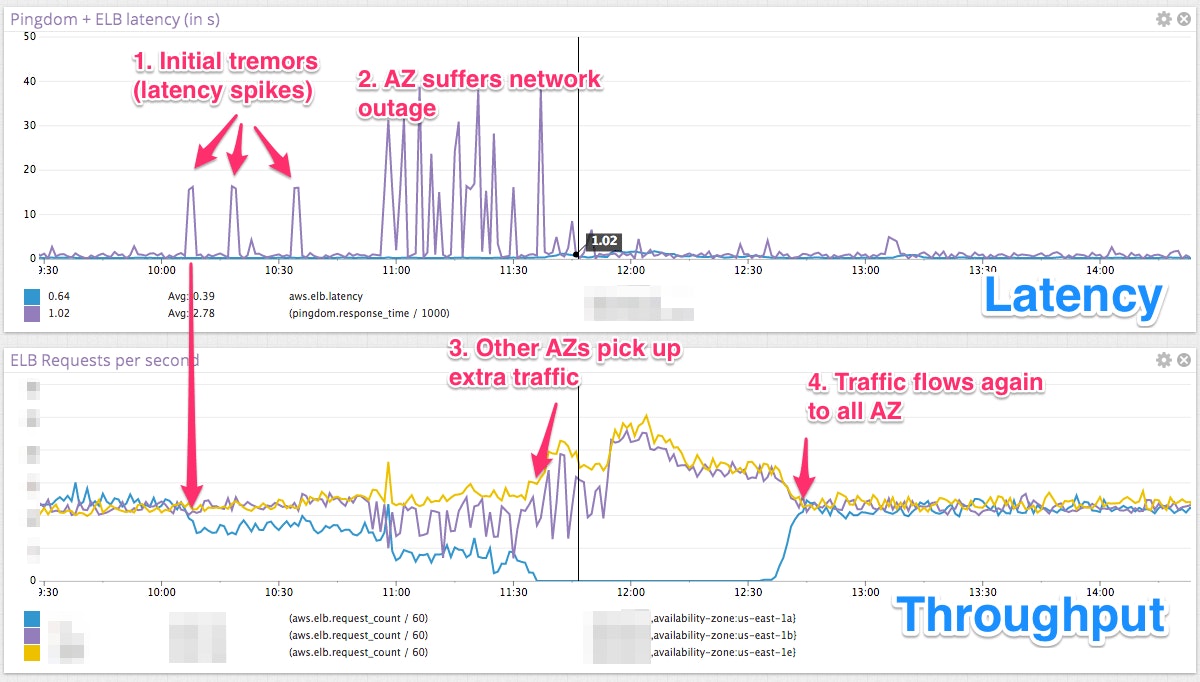
Here is the visualization of the impact of the network outage per zone, in terms of latency and throughput.

The first indicator of an issue is here latency as shown as (1) on the top graph. Throughput in that zone degrades but only to a point. As latency increases, throughput continues to drop until all traffic has been drained from the zone and other zones pick up the slack (3). At that point latency recovers as no traffic is flowing to the affected zone. Eventually the problem is fixed (4) and everything comes back to normal.
And here is the corresponding status message from AWS (emphasis mine):
Between 7:04 AM and 8:54 AM we experienced network connectivity issues affecting a portion of the instances in a single Availability Zone in the US-EAST-1 Region. Impacted instances were unreachable via public IP addresses, but were able to communicate to other instances in the same Availability Zone using private IP addresses. Impacted instances may have also had difficulty reaching other AWS services. We identified the root cause of the issue and full network connectivity had been restored. We are continuing to work to resolve elevated EC2 API latencies.*
Lesson #1: “a grey partial failure with a networking device” can cause serious damage
The “grey” partial failure of just one networking device is likely among the most difficult ones to diagnose. The device or service is seemingly working but its output contains more errors than usual.
How can you tell if you are suffering from a partial failure? There is no magic bullet but one key metric to monitor is the distribution of errors with a particular focus on the outliers. In this case a high latency (greater than 10s) can be construed as an error in the service. The maximum, 95% and median of error metrics are good starting points.
This applies to network metrics, but also to any application-level metric. For instance, tracking the error rate or the latency of the critical business actions in your application will alert you to a potential “grey” failure: when the service seemingly works when you try it, but it does not for more and more of your customers.
If you use StatsD’s histogram you get these for free: here’s how you get can started.
Lesson #2: the API works until it does not
This is one common, second-effect pattern with shared infrastructure: an issue, experienced or just heard of, will cause a lot of people to use the API to run away from the disaster scene. Sometimes so much so that the API gets overwhelmed. In this particular case we can’t say that it was the case but it is risky to assume that the cloud will always have extra capacity.
In our experience any instance/volume in an effected zone should be considered as lost: you will save time by focusing on the healthy part of your infrastructure rather than trying to patch up the broken pieces.
Because you can’t always rely on the API to work reliably, your contingency plan should rely on infrastructure already deployed in another zone or region.
It goes without saying, but we’ll say it nonetheless: build for failure, don’t get attached to your infrastructure. It has a shelf life. The tools are now here to let you treat your infrastructure like garbage when you can’t rely on it.
P.S. If you want to increase the visibility in your infrastructure and operations, why don’t you give Datadog a try?


