Dieter Matzion
This guest blog post is authored by Dieter Matzion, a seasoned cloud practitioner who has operated exclusively in public cloud environments since 2013, with experience at leading technology companies including Google, Netflix, Intuit, and Roku.
Custom metrics play a crucial role in enabling teams to monitor their applications and businesses. The flexibility of these metrics allows engineers to measure what matters most to their domain. However, as organizations scale, it becomes increasingly important to apply proactive governance. Establishing cost awareness and standardization across teams helps ensure that custom metrics deliver real business value within expected budgets.
In this guide, we’ll walk through how I approach managing custom metrics in Datadog by using data-driven insights, automation, and collaboration between engineering and finance teams.
Building a cost-conscious culture
The foundation of any cost optimization initiative is the alignment between finance and engineering. Although centralized FinOps teams can drive strategic direction, everyone in the organization needs to see themselves as a stakeholder in managing cloud costs.
To achieve this alignment, it’s essential to establish mutually agreed-upon cost targets tied to measurable business outcomes. One effective way to do this is through unit economics, linking custom metrics usage to revenue-driving or cost-saving activities. This technique not only aligns incentives across teams but also creates a shared language between technical and financial stakeholders.
Understanding Datadog spend
For Datadog, the cost of custom metrics is driven by cardinality, i.e., the number of unique timeseries generated by tag value combinations across all metrics. One effective governance practice is adopting standardized metric-naming conventions. Embedding hierarchical context into metric names helps ensure clarity and traceability across teams. Consider the following example:
ACME.data_activation.lambda.lat_setter.aerospike_read.meanACME.data_activation.lambda.lat_setter.aerospike_read.medianACME.data_activation.lambda.lat_setter.aerospike_read.p99ACME.data_activation.lambda.lat_setter.aerospike_read.stddevEach segment of the metric name provides specific contextual information:
- The ACME segment identifies the application.
- The data_activation segment refers to a module within the application.
- The lambda segment designates the serverless function responsible for executing the module.
- The lat_setter segment represents a latency histogram bucket setter used internally to track and classify operation latencies.
- The aerospike_read segment specifies the type of database operation being monitored—in this case, a read from Aerospike, a high-performance, distributed NoSQL database.
- The mean, median, p99, and stddev segments indicate the specific statistical measurements being collected for the latency metric.
When paired with relevant tags, this type of naming convention provides additional context that helps engineers efficiently organize, filter, and analyze metrics. But since tags influence cardinality, and therefore spend, it’s important to review tags and ensure they’re adding value.
Tracking overall spend trends
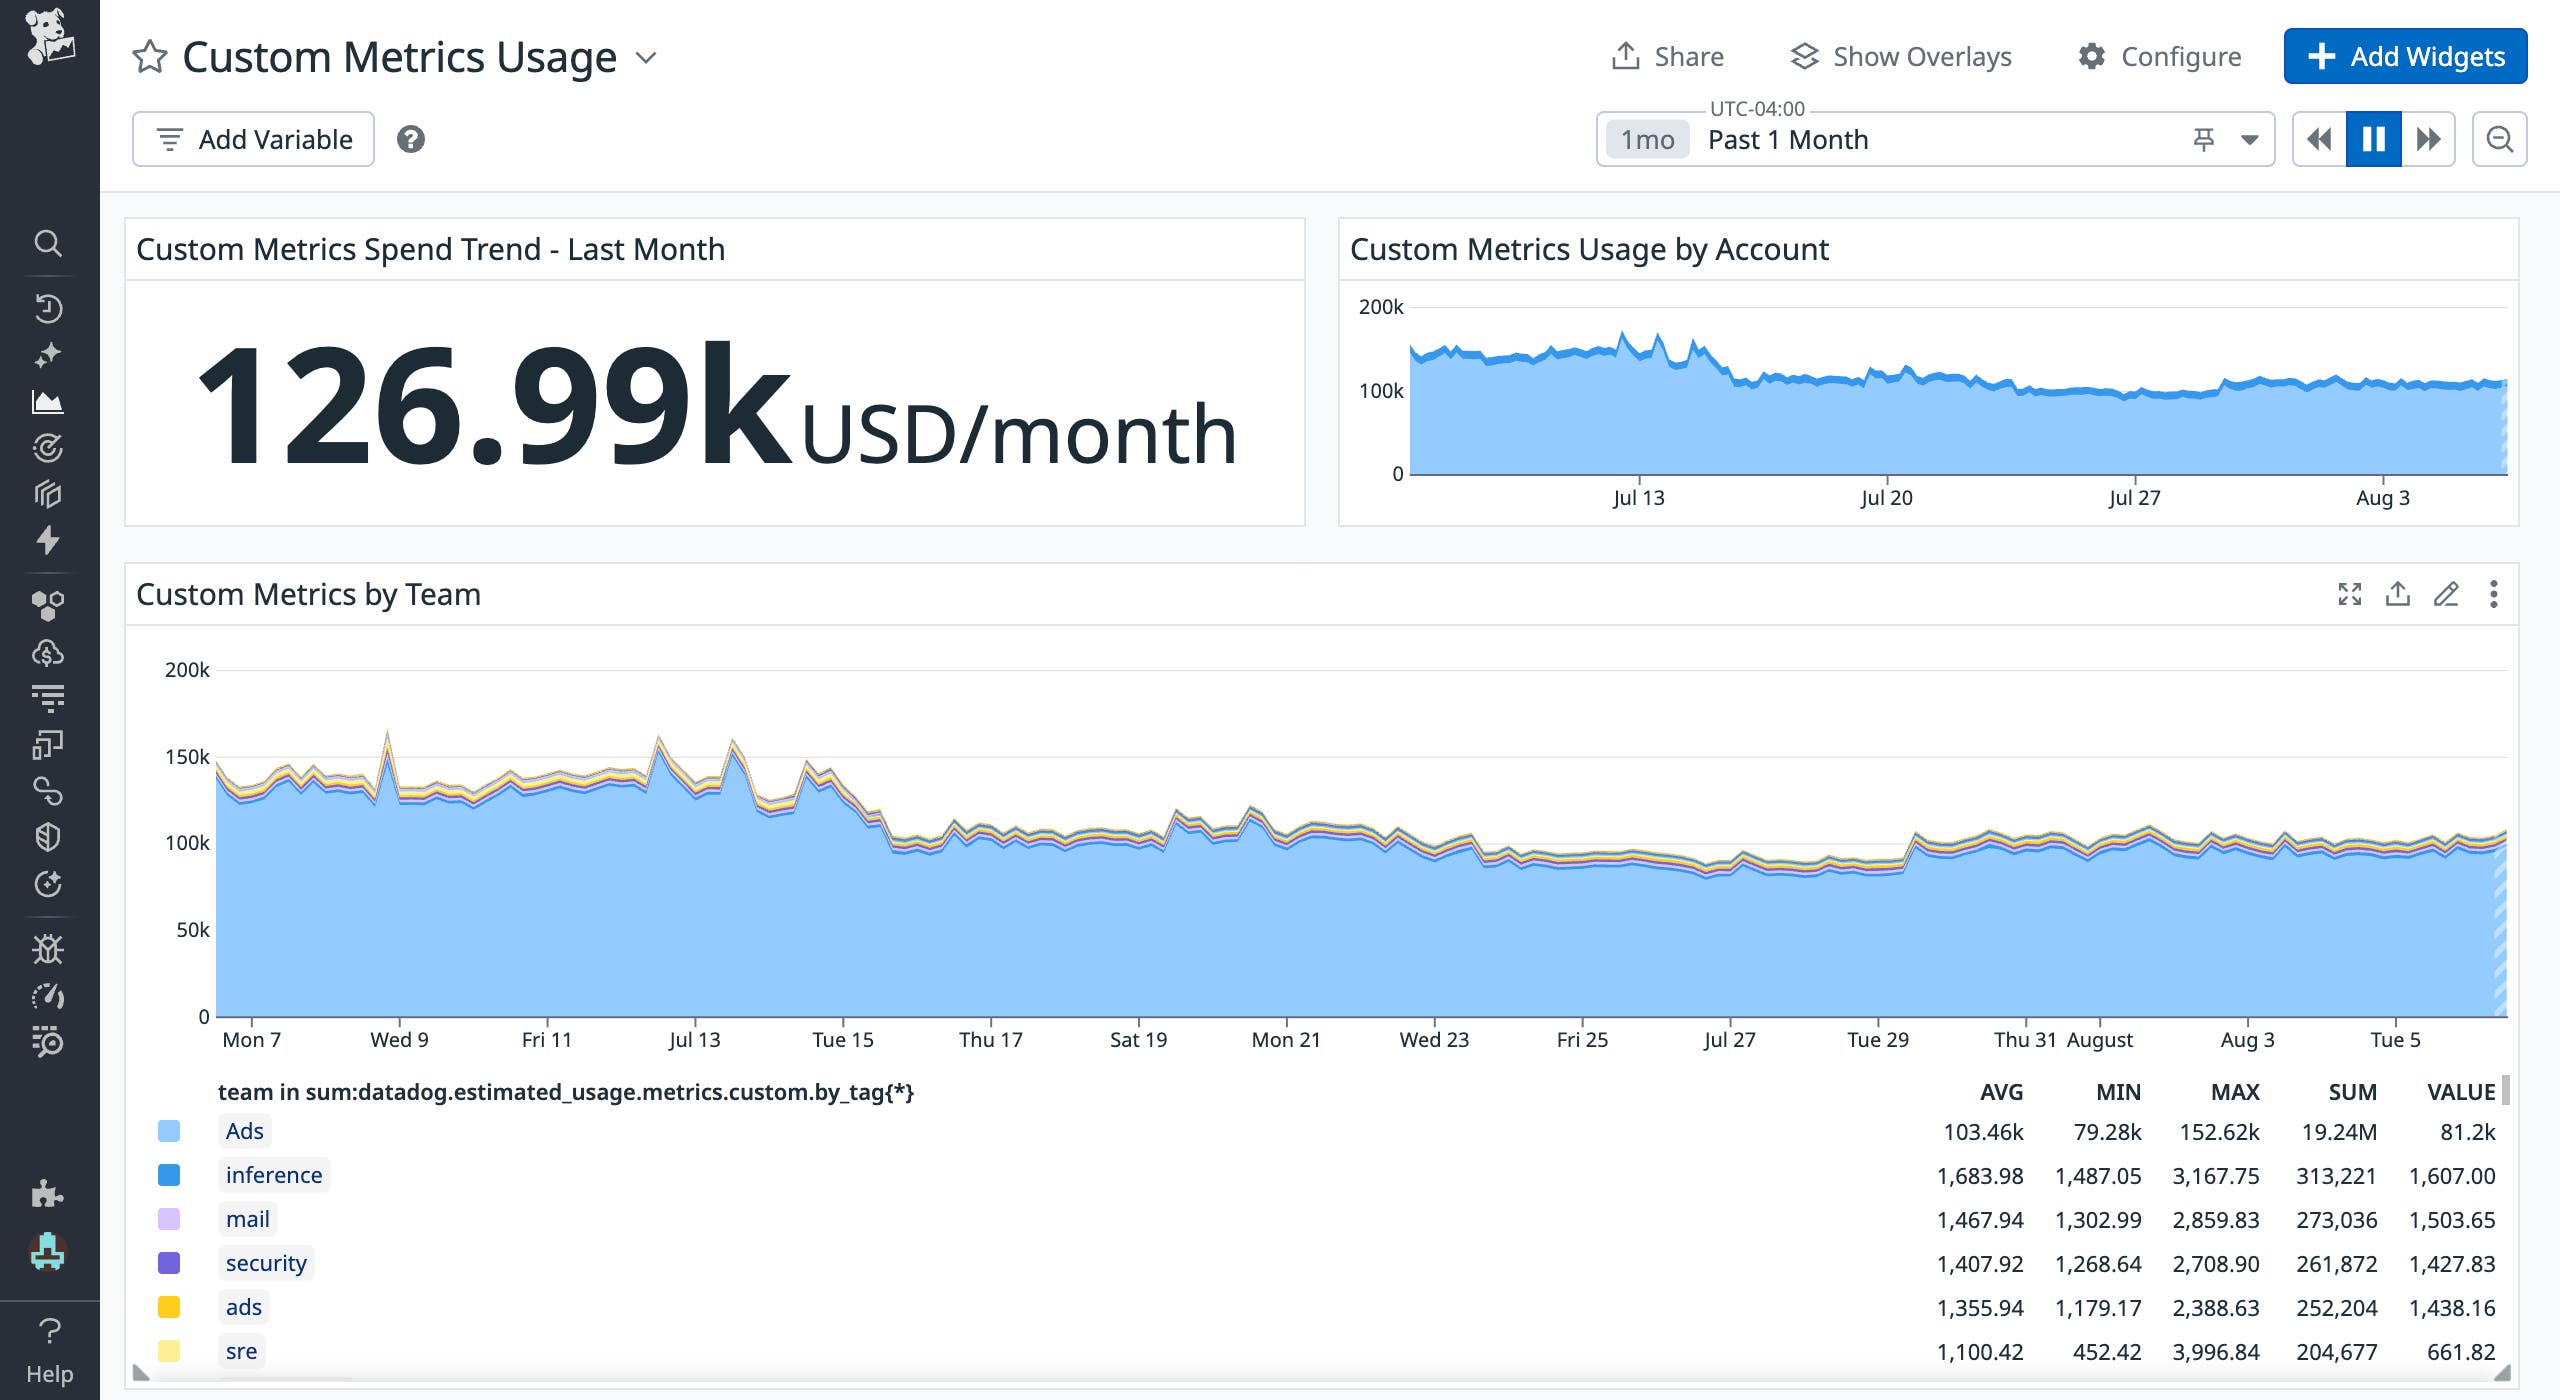
Datadog provides a number of tools to help with optimization initiatives—from visibility and attribution to value-based governance. Using Datadog’s out-of-the-box usage metrics, I created a dashboard that tracks overall spend, monthly usage trends, and usage broken down by team. I review this dashboard weekly so that I can catch any abnormalities early on and notify responsible teams to take action. I also hold monthly finance reviews with only the teams who are grossly under or over budget.
Identifying metrics for optimization
Besides notifying teams to optimize their metrics, I was able to safely optimize them myself since Datadog provides visibility into a metric’s relative utility. During my investigation into opportunities for optimizing custom metrics, I discovered that the many had not been queried within the past 90 days. Engineering teams across the organization had been proactively provisioning custom metrics for a wide range of potential scenarios—often with the intention of supporting future debugging or incident analysis. But in practice, these custom metrics weren’t being used.
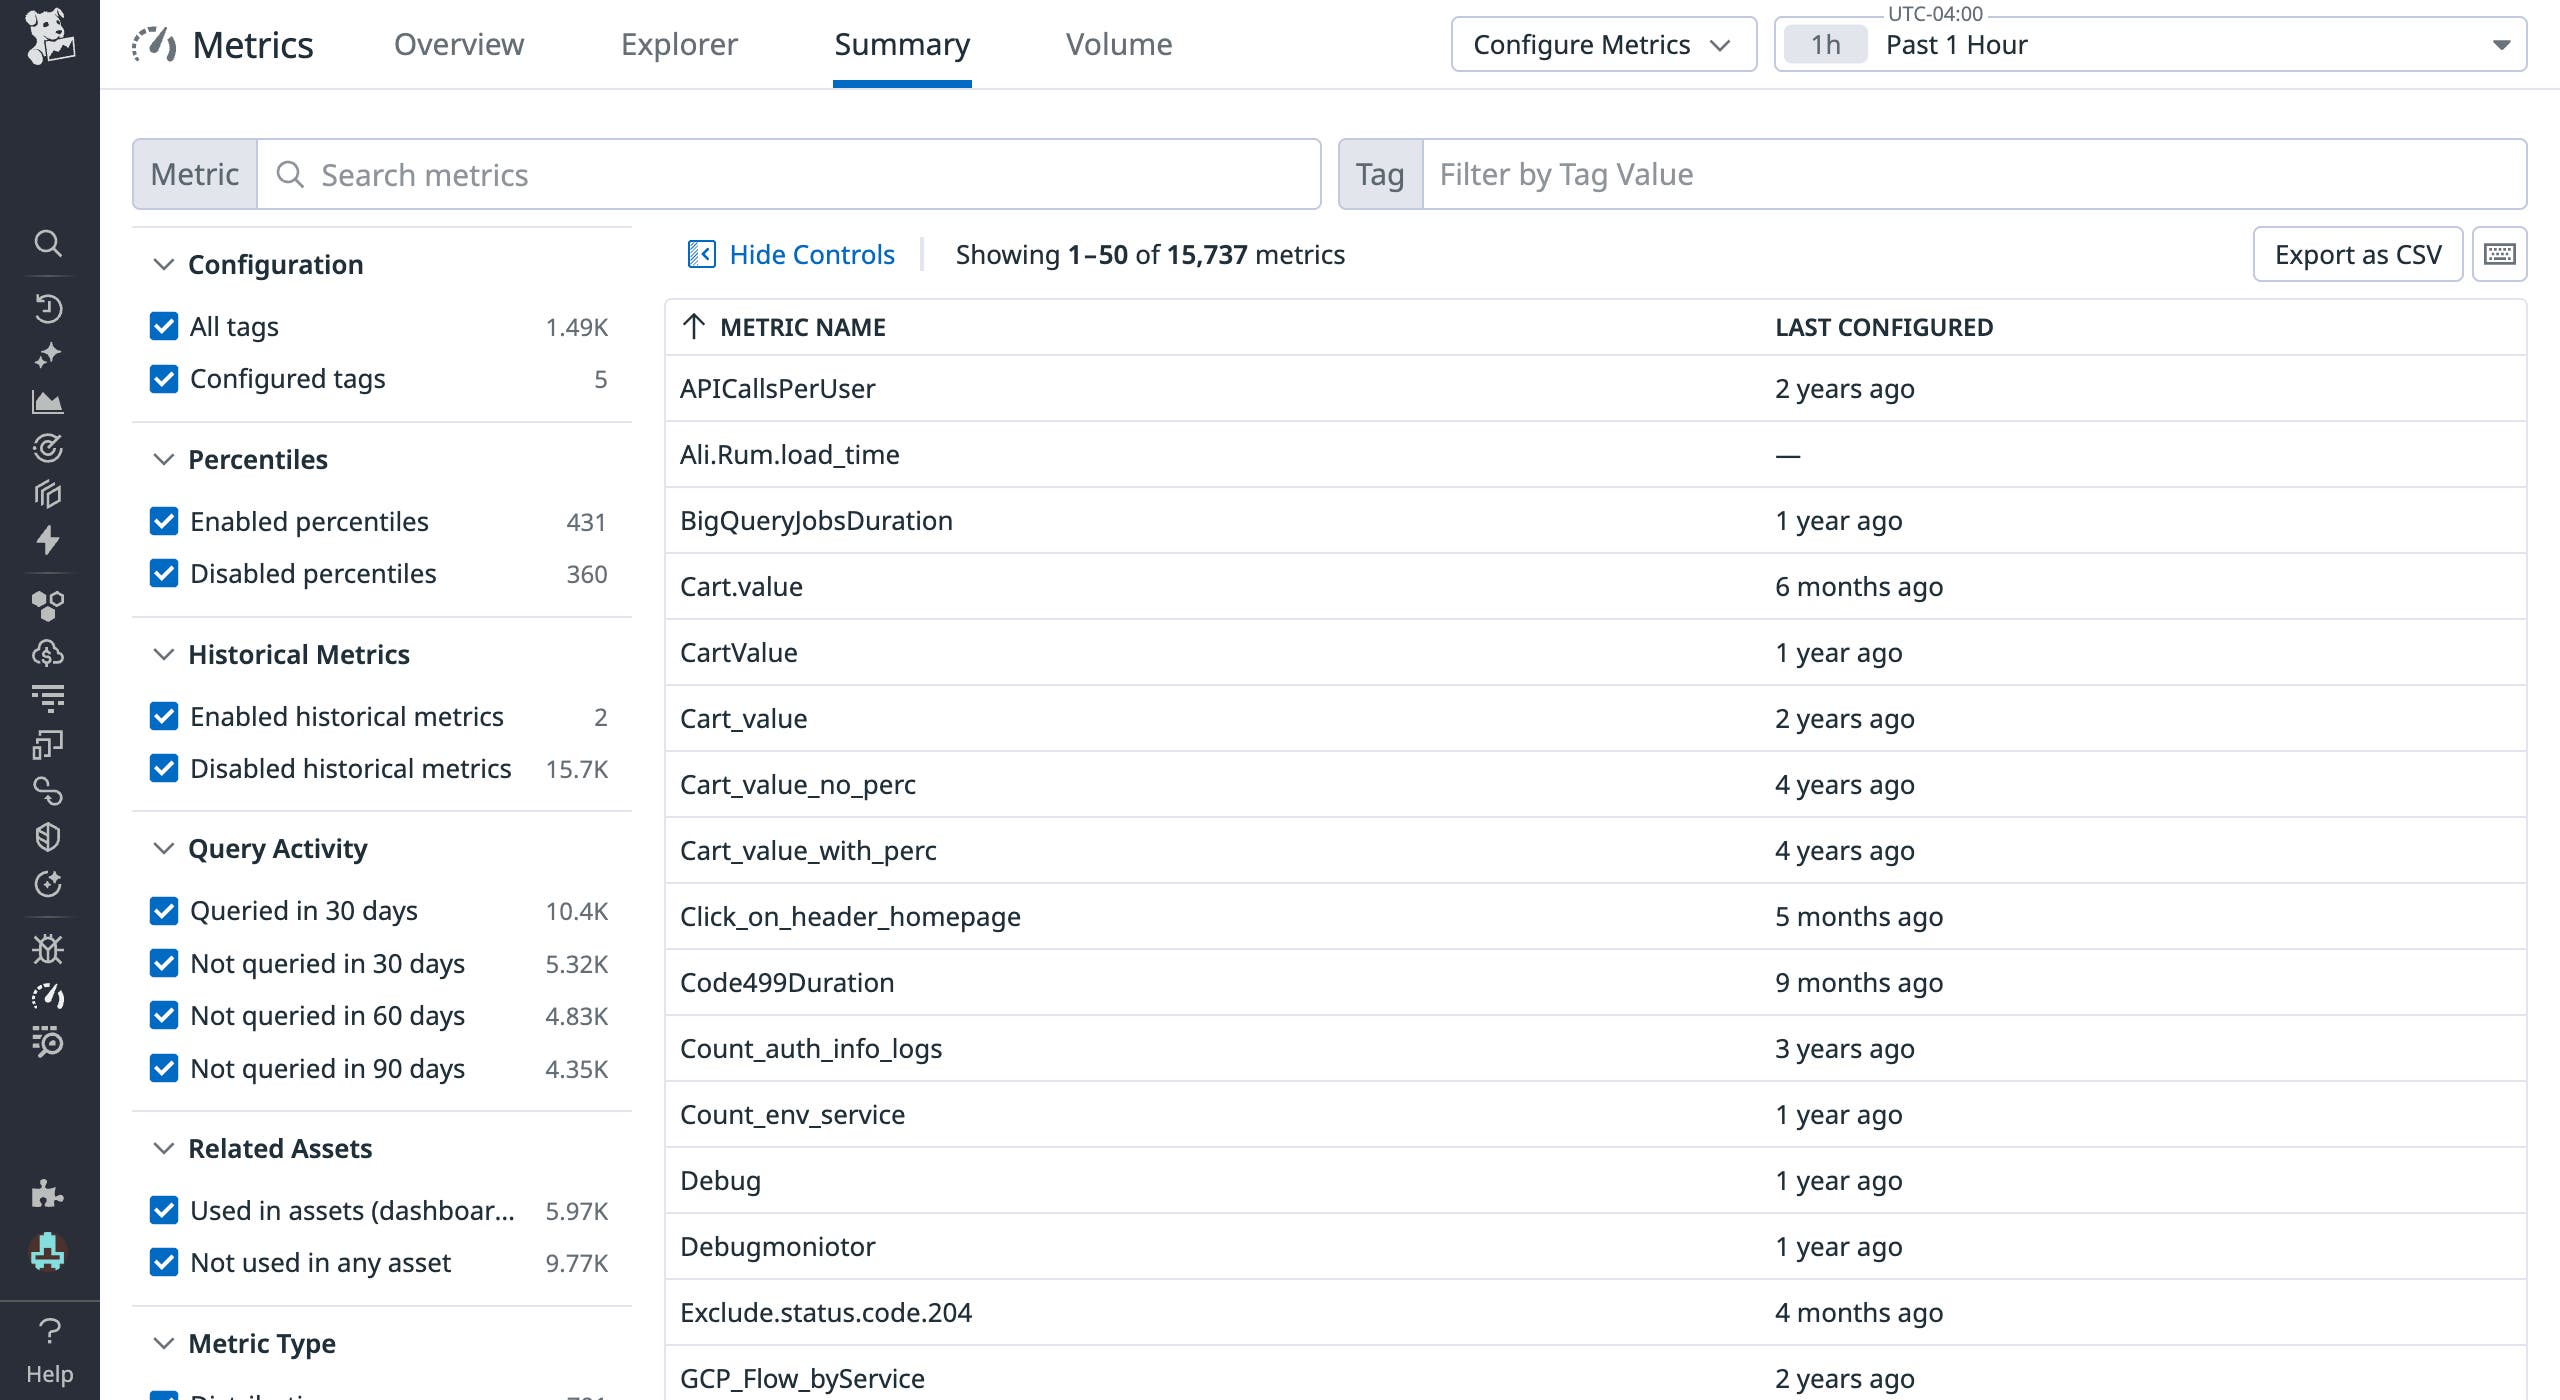
Analysis revealed that only a subset of these metrics were actually being used in practice. After confirming low-usage patterns, I worked with engineering teams to either deprecate those metrics or remove unnecessary tags, reducing unnecessary volumes while preserving the observability needed for effective operations and troubleshooting.
Optimizing custom metrics by using Metrics without Limits™
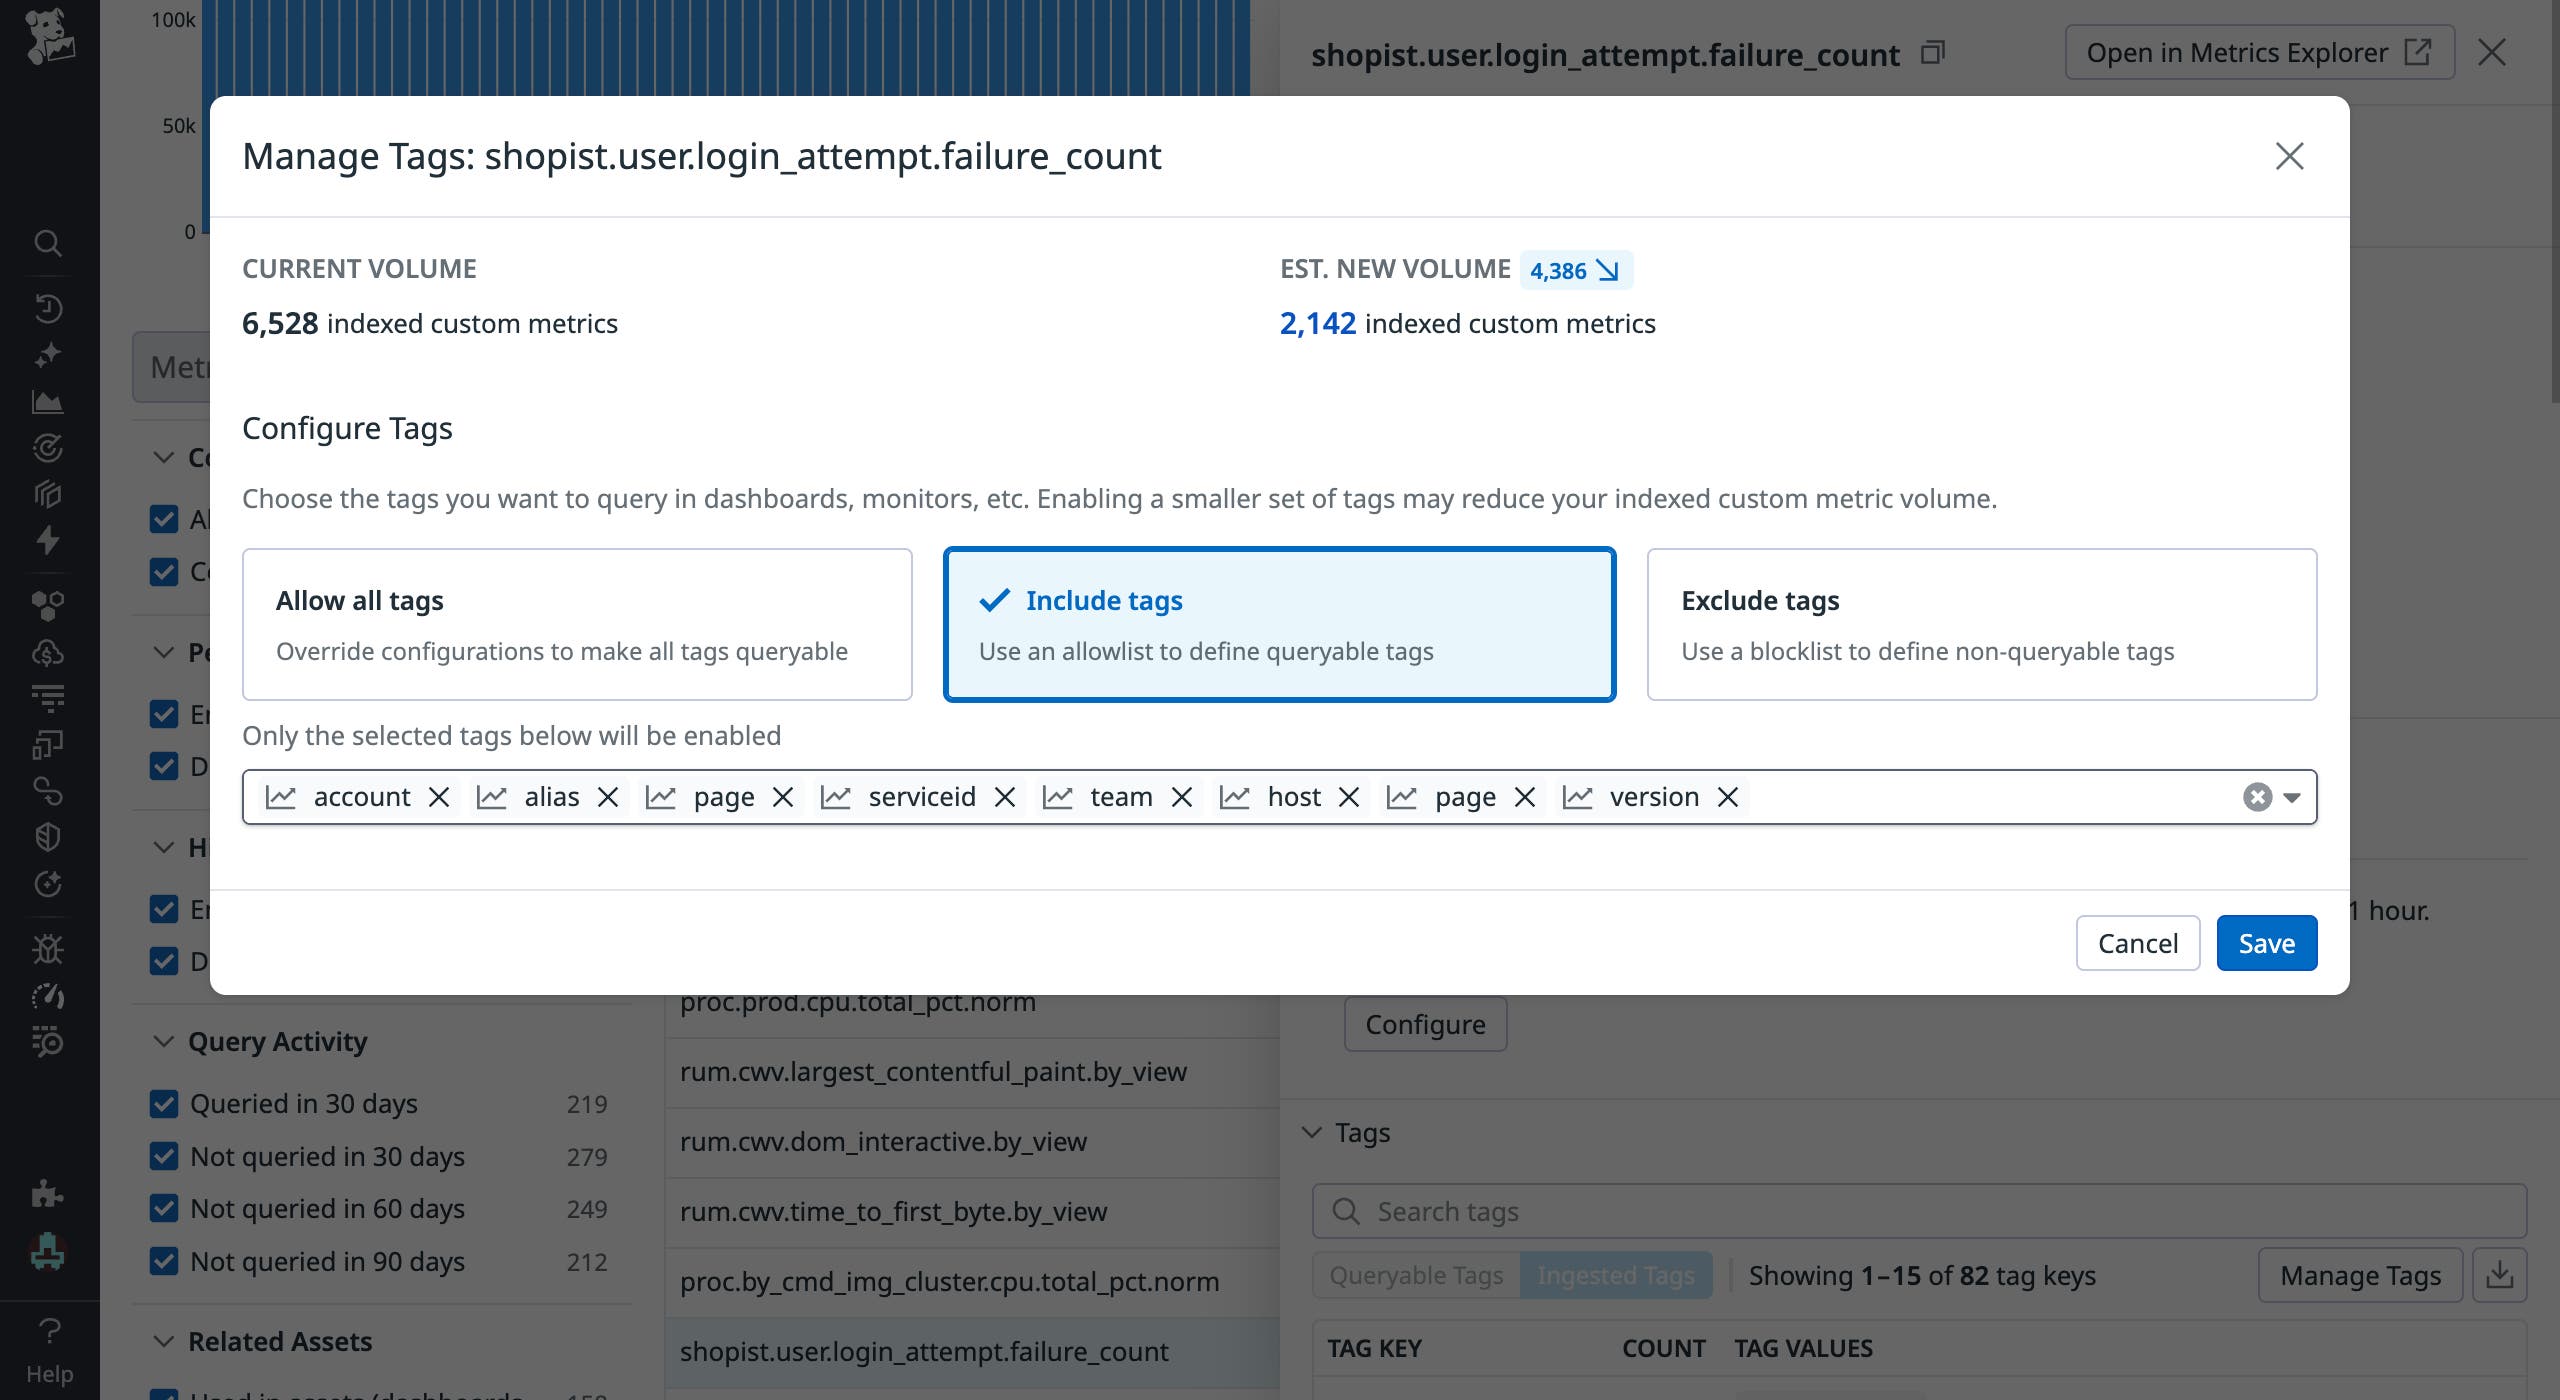
Using Metrics without Limits enables you to choose which tags to include and exclude for indexing. In particular, when you select the option to include tags, Datadog automatically suggests tags that have been queried recently, helping you focus on what’s actively used. This feature enabled me to exclude unused tags from indexing, significantly reducing the volume of indexed custom metrics.
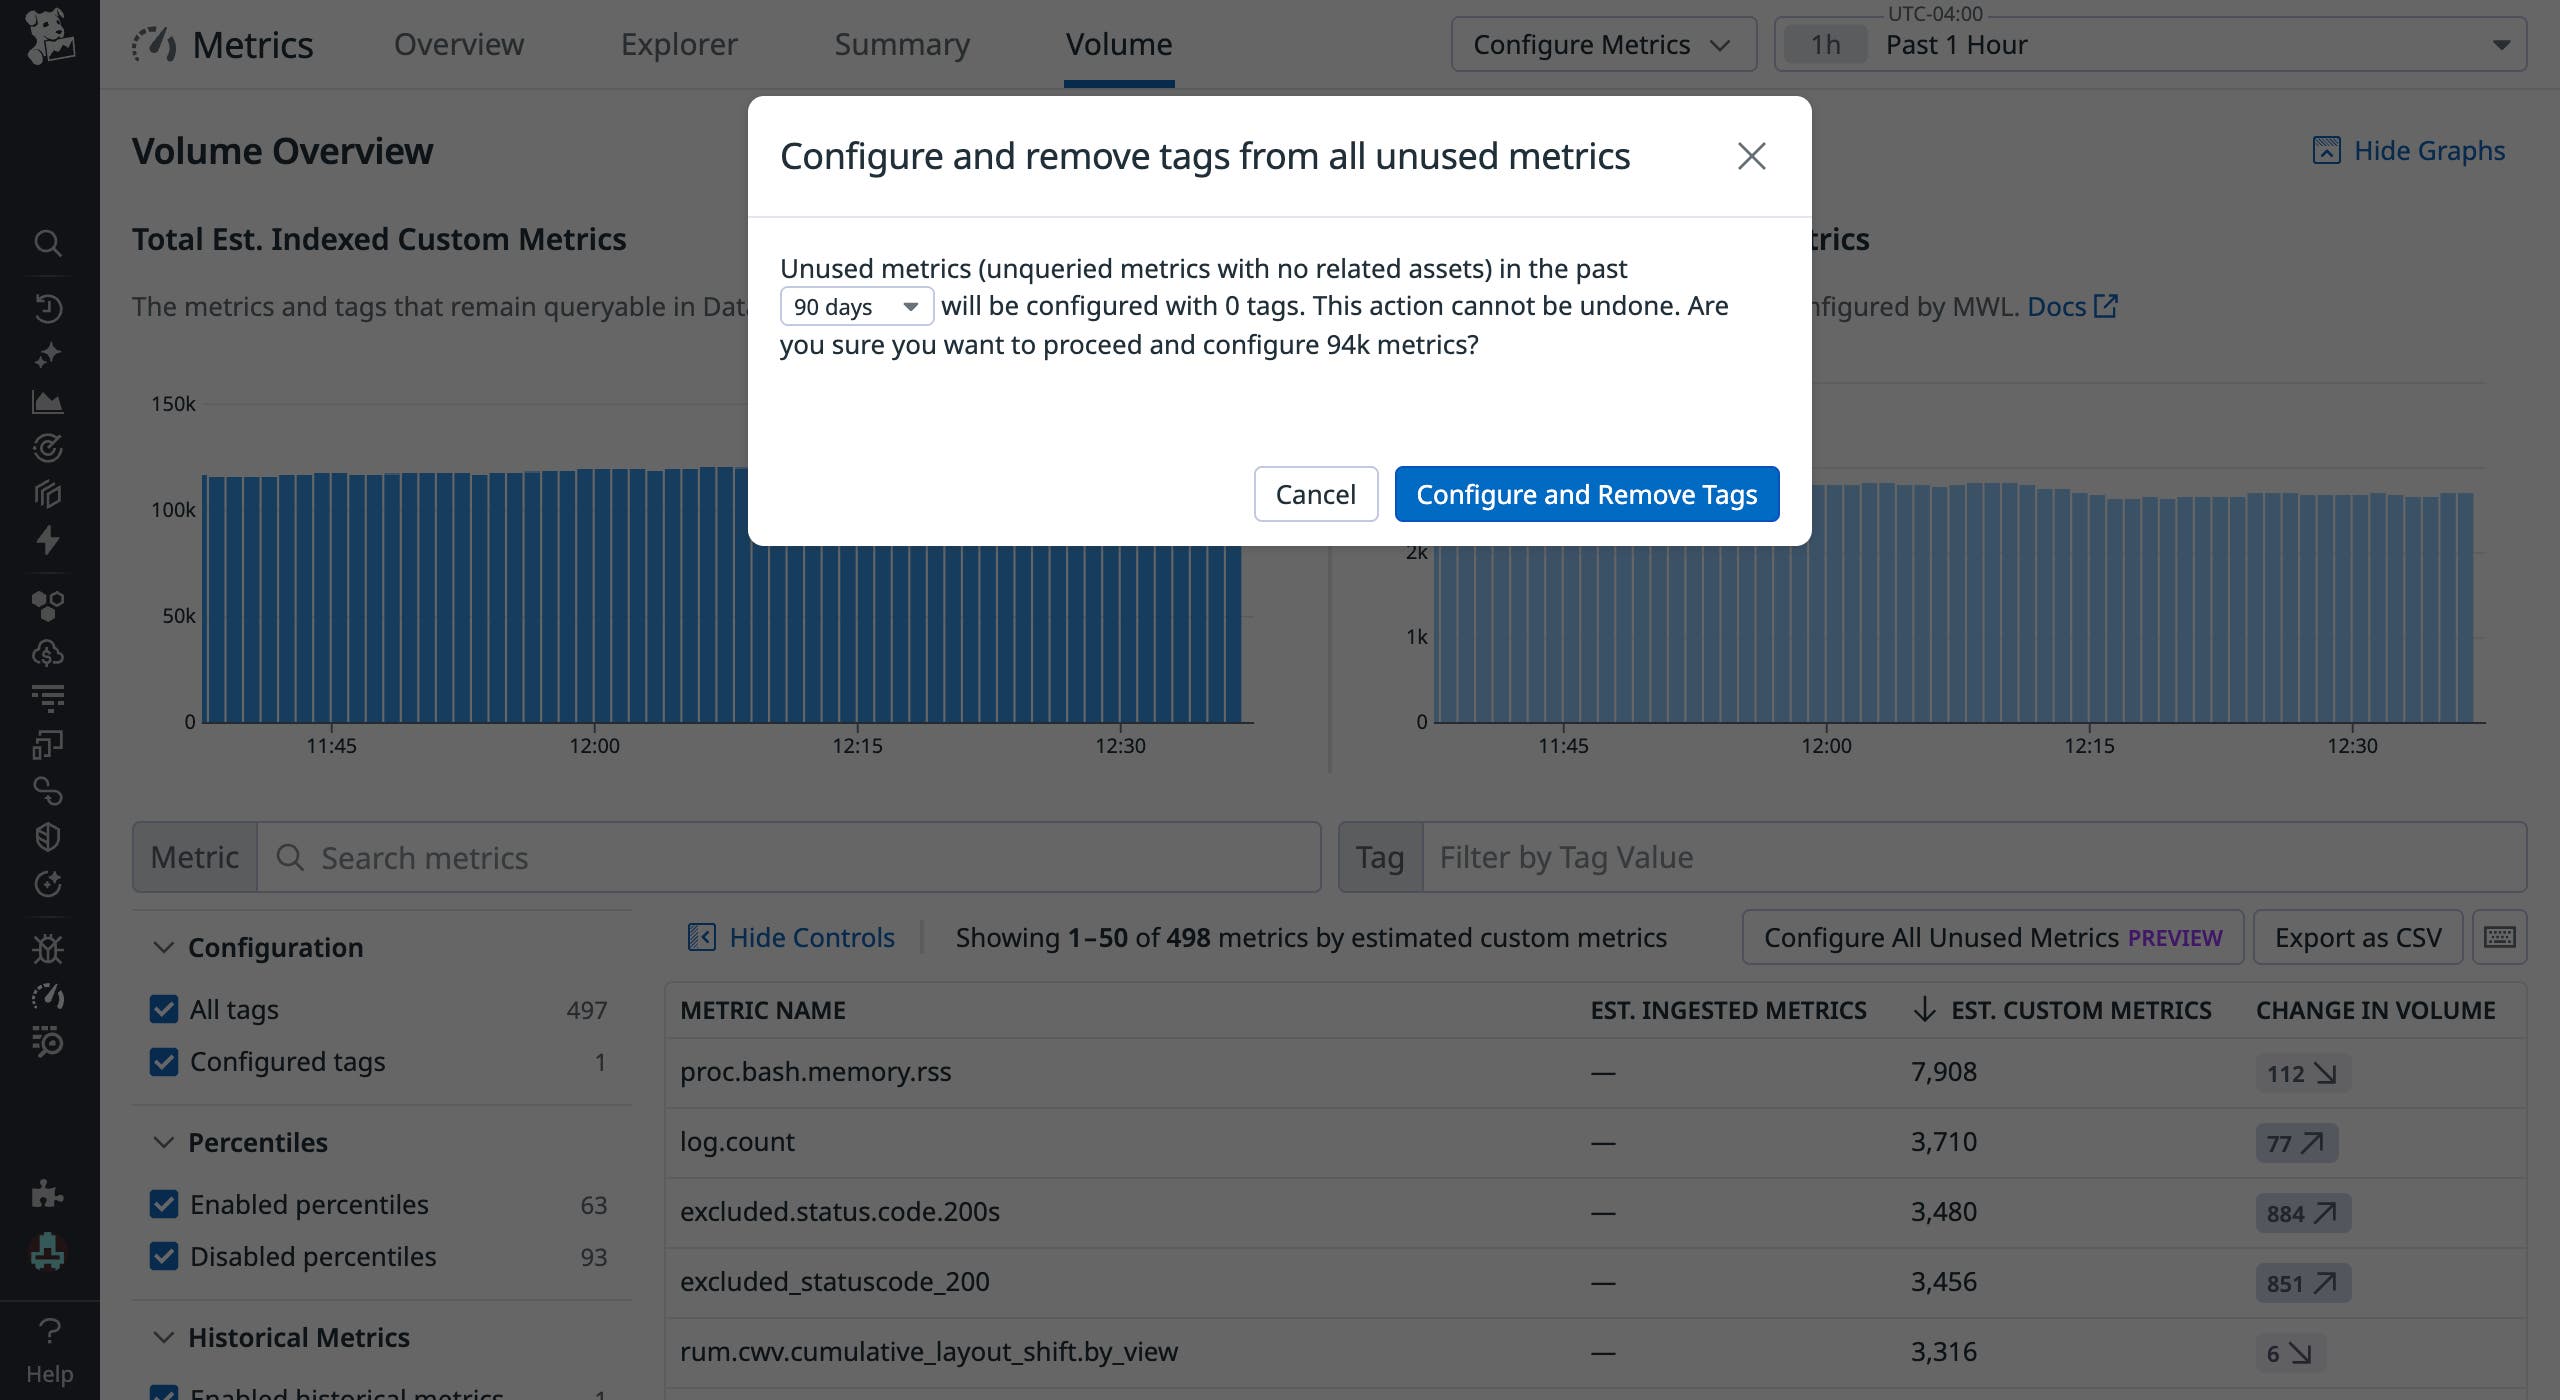
Another option I used was Configure and Remove Tags. When this option is selected, Datadog automatically removes unused tag combinations from indexing across all metrics. This significantly reduces manual effort and makes large-scale tag optimization more efficient and scalable. In my case, the option lowered the number of indexed metrics from over 900,000 to just above 100,000.
Govern your custom metrics today
By aligning engineering and finance, adopting naming and tagging standards, and using Datadog’s optimization features, FinOps teams can create more efficient, sustainable monitoring practices for custom metrics. Whether you work in finance or engineering, Datadog makes it easier to achieve these goals and manage your observability spend.
To learn more, check out Datadog’s Best Practices for Custom Metrics Governance guide. And if you’re new to Datadog, sign up for a 14-day free trial.


