Natasha Goel
Google Cloud Platform is growing quickly, providing solutions for everything from cloud storage to managed Kubernetes to serverless computing. Since Google App Engine launched in 2008, Google’s suite of serverless products has expanded to help enterprises accelerate application development without having to manage or scale their own infrastructure.
To provide comprehensive visibility into serverless applications running on Google Cloud, we are excited to announce that we have enhanced our Google Cloud Functions, Google Cloud Run, and Google App Engine integrations. In addition to new out-of-the-box dashboards, we’ve also added enhanced latency and resource utilization metrics (p95 and p99) across these integrations, allowing you to effectively troubleshoot performance issues before they impact your users.
Track Google Cloud Functions performance and usage
Google Cloud Functions is an event-based, asynchronous compute solution that allows you to create small, single-purpose functions. Companies can use Cloud Functions with services like Google Pub/Sub and Google Cloud SQL to automatically scale their systems without provisioning, managing, or upgrading servers.
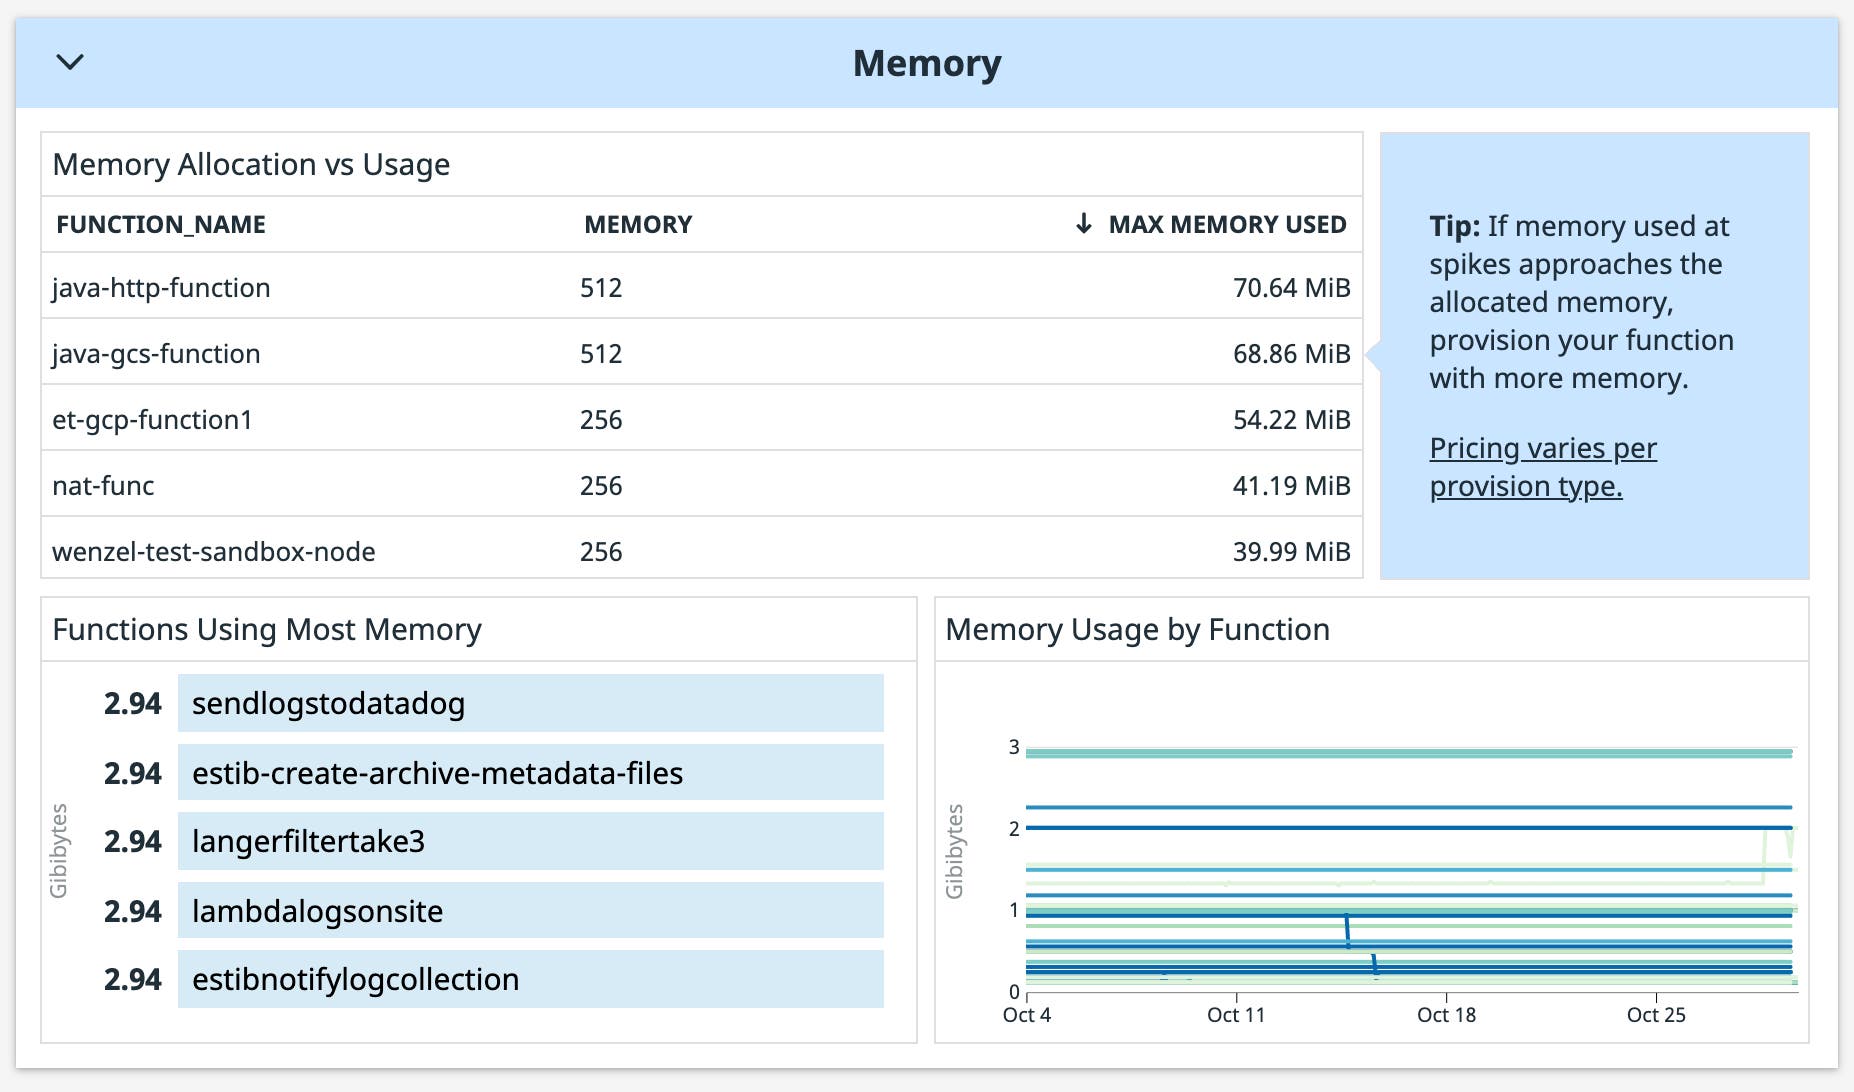
Datadog’s new Google Cloud Functions dashboard provides a high-level overview of key performance metrics from your functions, including error rate, total invocations, and execution time.
The dashboard also displays function-level metrics that can help you optimize your Cloud Functions usage. For example, if you notice that a function’s memory usage frequently approaches its memory allocation, you may need to provision more memory to those particular functions. Or if certain functions consistently underuse their allocated memory, you can decrease their memory allocation to cut costs.
Debug Google Cloud Run errors across revisions
Google Cloud Run is a managed compute platform that enables you to run stateless containers that are invocable via HTTP requests. You can deploy Cloud Run as a fully managed service or run it in an Anthos GKE cluster. Both options allow you to write your code in any language or binary you want while abstracting away infrastructure management and enabling portability of your containerized applications. You can also split user traffic across different Cloud Run revisions to test new functionality.
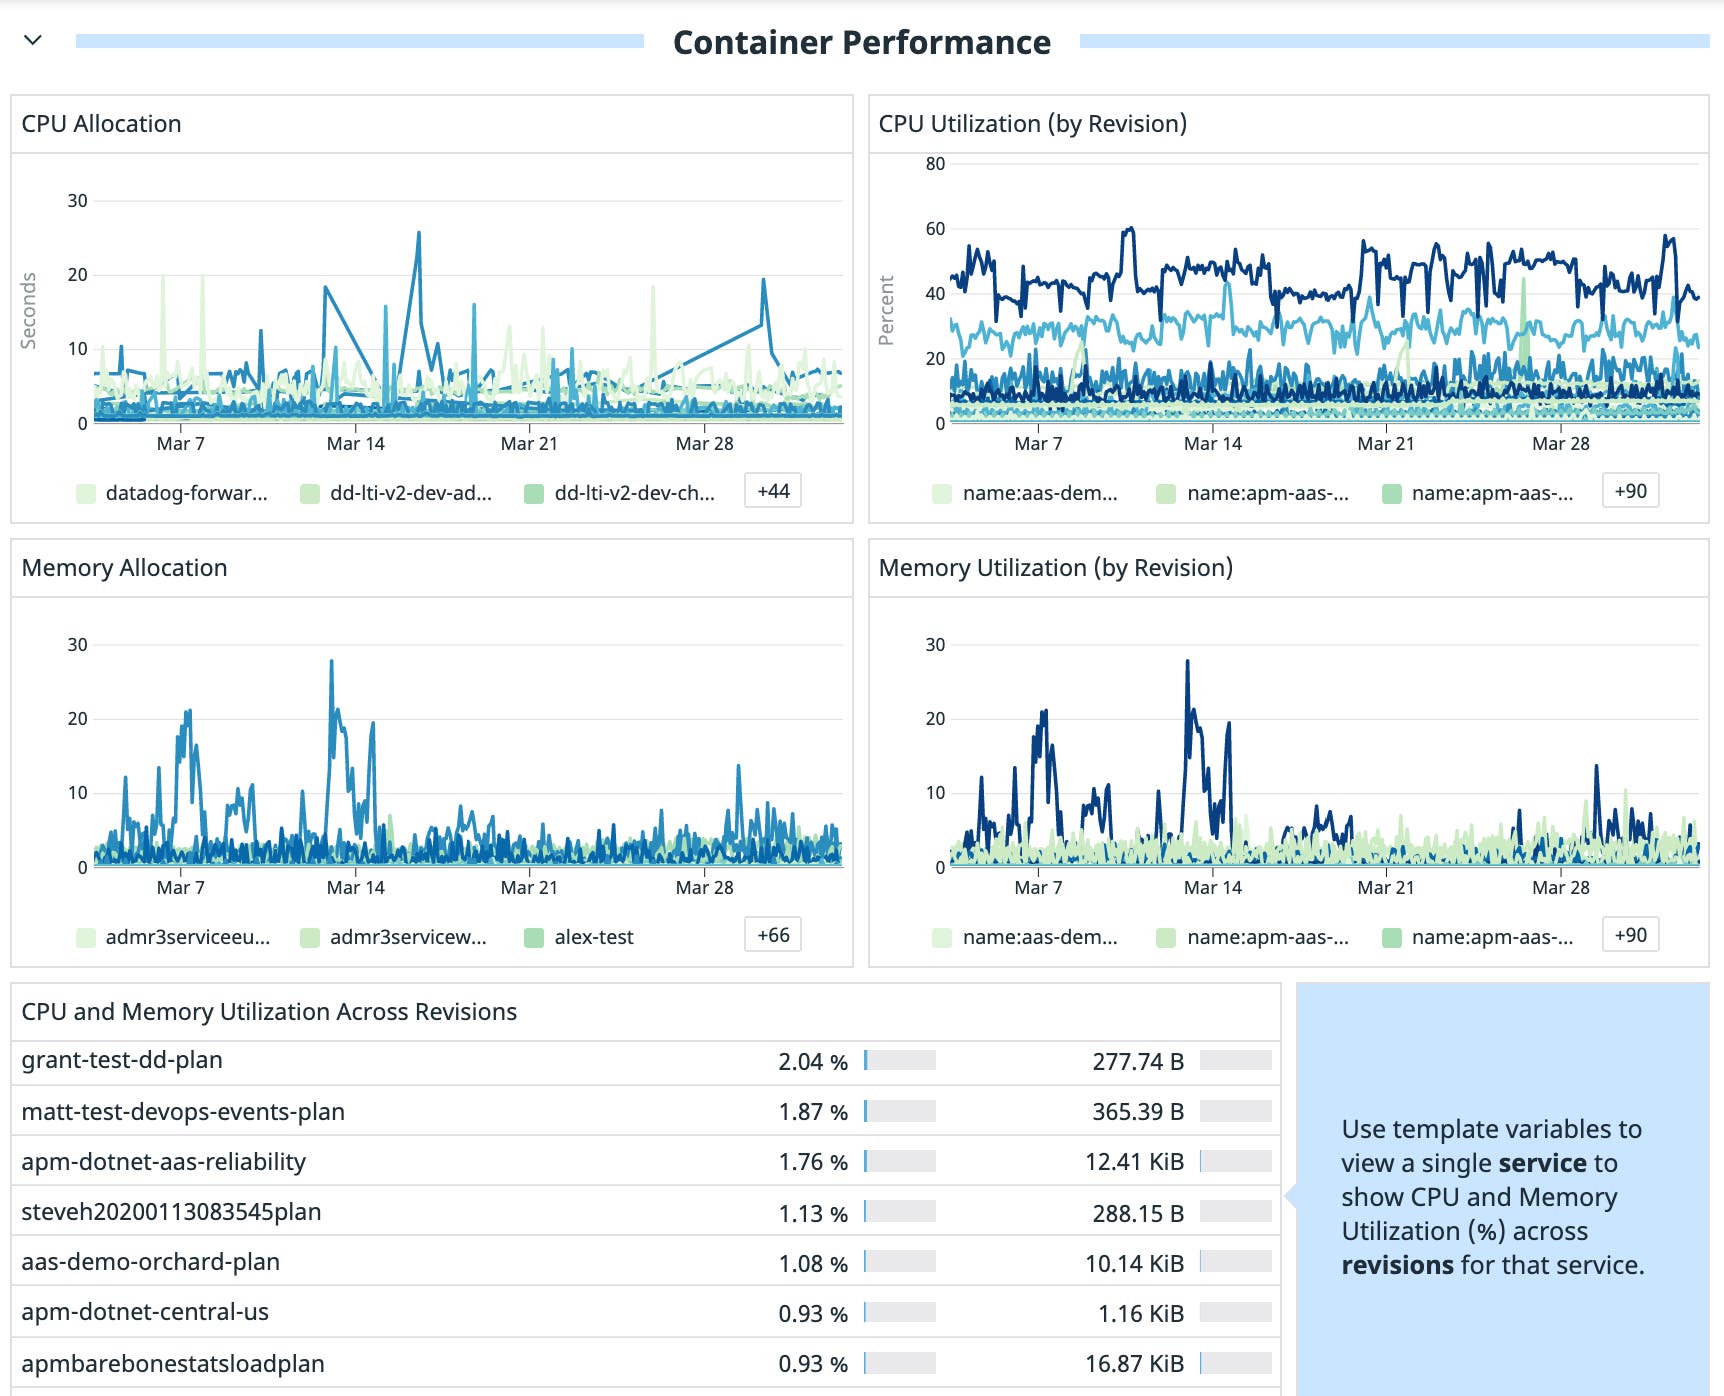
Our new Cloud Run Fully Managed dashboard allows you to get a bird’s-eye view of the performance of your services, as well as resource utilization metrics from your containers. You can also use this dashboard to reduce your bill by checking which services have the most billable instance time and the highest number of idle containers.
Datadog automatically tags Google Cloud Run metrics by service name and revision, so you can quickly spot where errors are occurring and drill deeper to investigate. For example, if you notice a higher rate of errors in a new revision, you can click the graph to view related logs. You can also compare CPU and memory utilization across revisions of the same service to better understand how your code changes are affecting end users—and quickly determine if you need to revert a problematic deployment.
Monitor Google App Engine standard and flex environments
Google App Engine is a platform-as-a-service (PaaS) offering for developing and hosting web applications, especially those on a microservice architecture. App Engine users have the option to run their applications in a flexible or standard environment. The flexible environment is best suited for instances running within Docker containers, while the standard environment allows for scale to zero and has a shorter instance startup time.
Our new Google App Engine dashboard provides insights into both types of environments, so you can get complete visibility into all your App Engine applications, wherever they run. At a high level, you can see information about your responses, errors, billable instances, Memcache, and more.
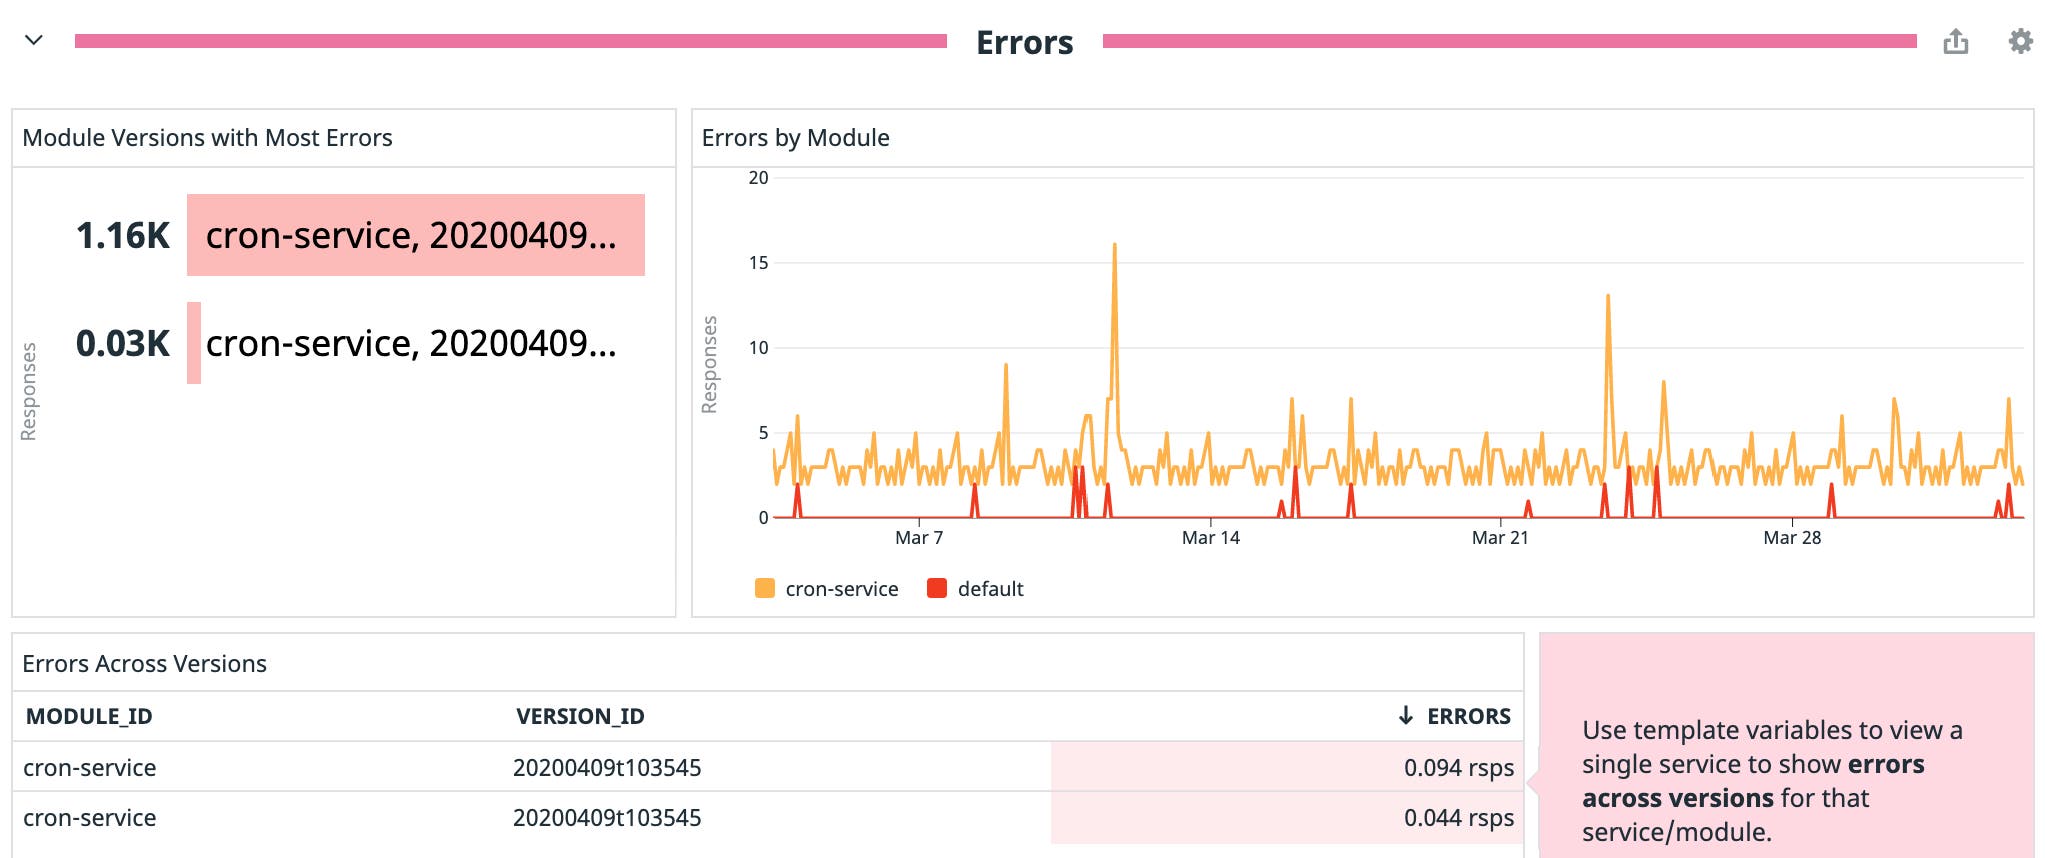
As you deploy updates to your App Engine applications, you can also use this dashboard to track any changes in performance or errors across versions. The screenshot below shows how you can compare errors across modules and versions to quickly spot potential regressions. To dig deeper, you can click any graph to see logs and other telemetry data collected from the affected modules or versions.
Enhanced metrics for Google serverless applications
Monitoring the latency of your serverless applications is crucial, but the average values of these metrics often don’t reveal enough about your users’ experience. To provide the level of granularity you need to spot user-facing issues quickly and accurately, we have enhanced our latency metrics to include percentile aggregations (p95 and p99) across all three GCP serverless offerings: Cloud Functions, Cloud Run, and App Engine. These enhanced metrics are displayed in our new out-of-the-box dashboards, so you can immediately start monitoring your Google serverless applications.
We have also added p95 and p99 aggregations for CPU and memory utilization metrics in Cloud Run, as well as memory usage in Cloud Functions, allowing you to make more informed decisions about how many resources to allocate to your serverless applications. See the Google Cloud documentation for details on how percentile values are calculated.
Start monitoring your Google serverless apps today
If you’re already monitoring your Google Cloud environment with Datadog, you can immediately start using these out-of-the-box dashboards and enhanced metrics to get deeper visibility into your serverless applications. For more information on how to get up and running with Datadog’s Google Cloud integration, check out our documentation. If you’re not yet using Datadog but you’d like to get comprehensive insights into the performance and health of your serverless applications, sign up for a 14-day free trial.
