Mallory Mooney
Fluent Bit is a lightweight, multi-platform tool that can collect, parse, and forward log data from several different sources. Because Fluent Bit has a small memory footprint (~450 KB), it is an ideal solution for collecting logs in environments with limited resources, such as containerized services and embedded Linux systems (e.g., IoT devices). If you already use Fluent Bit (v1.3.0+), you can start using our new output plugin to forward all of your collected logs to Datadog for visualization and analysis.
Monitor all of your logs with Fluent Bit and Datadog
As applications and environments grow in complexity, managing the flow of log data becomes increasingly difficult. Logs come from a wide range of sources—with different formats and destinations—so centralizing them becomes a critical part of monitoring application activity.
Once you’re centralizing your logs with Fluent Bit and Datadog, you can gain valuable insights by monitoring and correlating that data with application metrics and traces, all in one platform. Datadog’s output plugin helps you route logs from all your services, regardless of whether they’re running in containers, cloud environments, on-prem servers, or all of the above.
You can also archive your Fluent Bit logs if you need to store them long-term. And, if you need to investigate old events for an audit or postmortem, you can quickly pull archived logs back into your account.
Add the Datadog plugin to your Fluent Bit configuration
To start forwarding your Fluent Bit logs with Datadog’s new plugin, add a new output section to your Fluent Bit configuration file:
[OUTPUT] Name datadog Match * Host http-intake.logs.datadoghq.com TLS on apikey <DATADOG_API_KEY> dd_service web-server dd_source apache dd_tags project:fluent-bit, env:stagingAs a part of its workflow, Fluent Bit will collect log data from one (or several) inputs and route them directly to Datadog through the available http-intake.logs.datadoghq.com logging endpoint. The TLS parameter allows Fluent Bit to send those logs over a secure, SSL-encrypted TCP connection.
The plugin also includes an API key parameter (which you can find in the settings section of your Datadog account) and parameters for linking your logs to a service and source so you can see the service and underlying technology that generated the logs in Datadog. Additionally, the tags parameter allows you to easily filter and aggregate log data.
By adding a service to Datadog’s output plugin, you can associate your logs with related traces (collected by the Datadog Agent) from the same application. This enables you to easily pivot from one datapoint to another when you need to troubleshoot an issue.
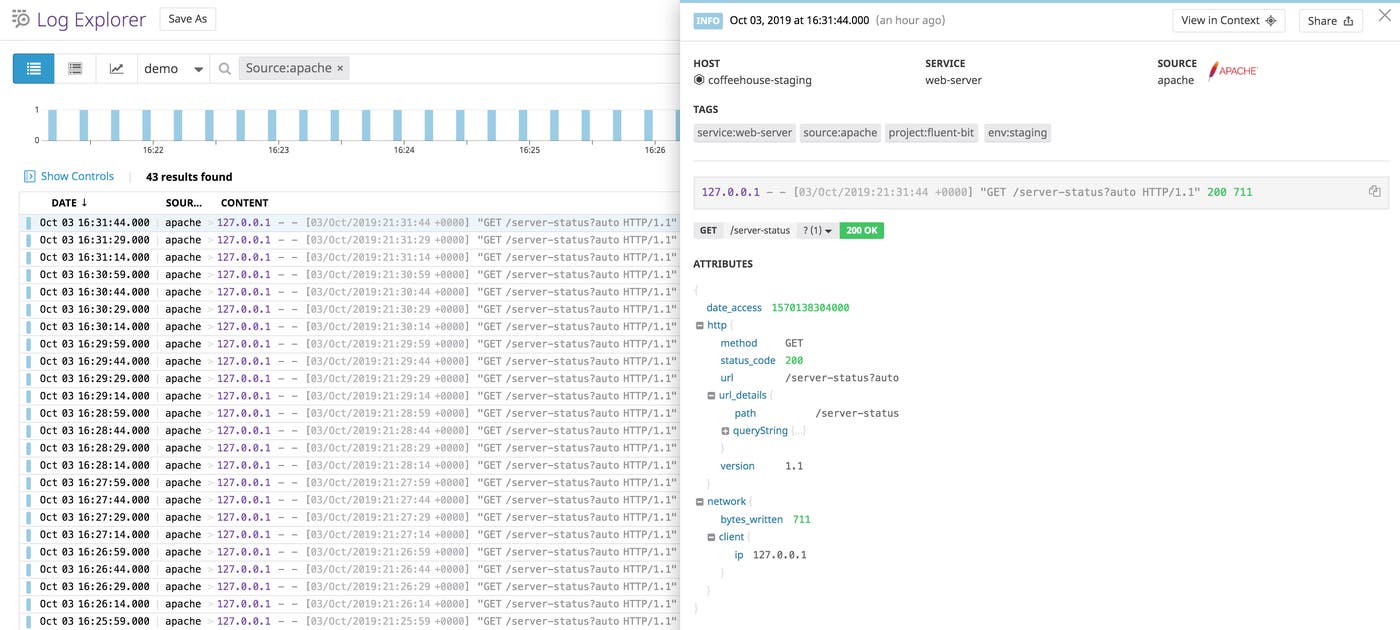
Datadog provides built-in log processing pipelines for many technologies (e.g., Apache, Docker, AWS Lambda). If your Fluent Bit configuration’s source parameter specifies that the logs come from one of these sources, Datadog’s pipeline will automatically extract key attributes, such as http.method, http.status_code, and timestamp. In the example below, we are filtering logs by source:apache so we can view all of the Apache logs routed by Fluent Bit.

Explore and analyze your logs in one place
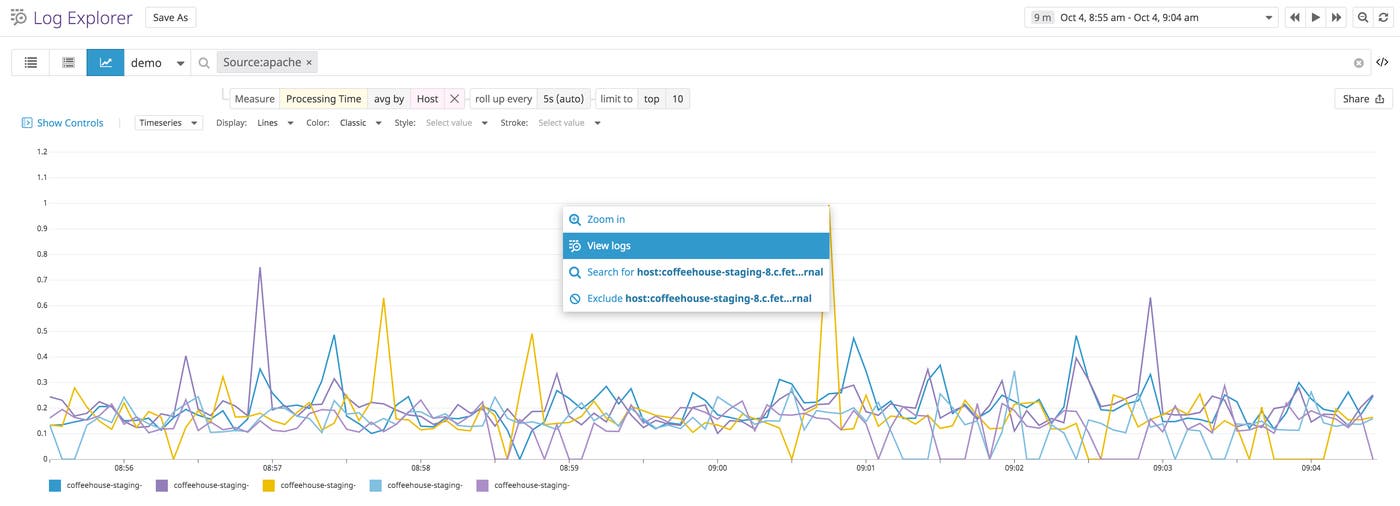
You can use attributes from your logs to analyze trends in your applications. For example, if the Apache access logs you collect with Fluent Bit include processing time then you can monitor how long it takes for each of your instances to process requests. If you notice a spike in processing time for one of your servers, you can click on a datapoint to quickly view the logs that host generated within the same timeframe.

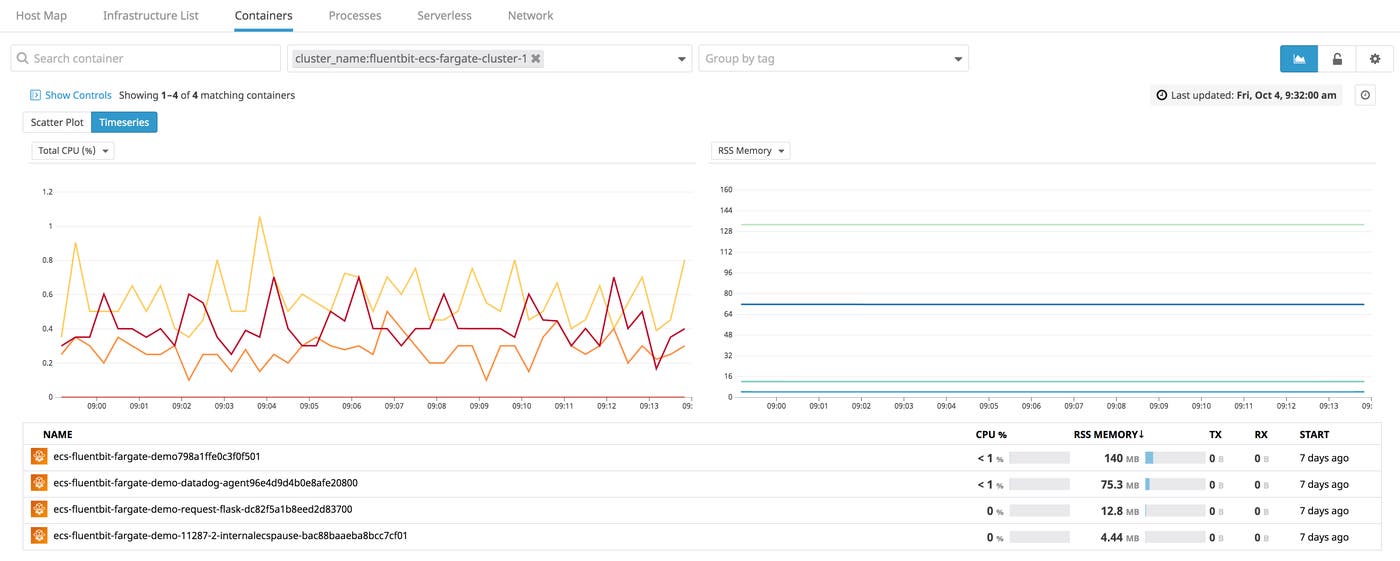
For services running in containerized environments, you can also pivot from your Fluent Bit logs to the Live Container view, where you can monitor resource metrics for each of your containers. You can filter by tags from your Fluent Bit configurations—such as cluster_name—in order to quickly drill down to the containers generating the logs, as seen in the example below.

This helps you quickly view the status of all of your containers and identify which containers are consuming the most resources.
Route your logs to Datadog
With Datadog’s output plugin for Fluent Bit, you can instantly begin monitoring, analyzing, and storing all of your logs in Datadog. Check out our documentation to learn more about our Fluent Bit integration and how you can start routing your logs to Datadog. If you don’t have a Datadog account, you can sign up for a free 14-day trial.


