Candace Shamieh

Brooke Chen

Ryan Lucht

Aaron Silverman

Galen Pickard
Modern engineering teams face competing priorities. Developers are expected to deliver new features faster than ever, but users expect rock-solid reliability with every release. Shipping quickly can feel like you’re gambling with user trust. If you move too fast, you risk outages, but if you move too slowly, innovation stalls.
Progressive delivery offers a way to escape this tradeoff. Techniques like feature flags, canary releases, and blue-green deployments give teams control over when and how code reaches users. By enabling safe experimentation in production and decoupling releases from deployments, these techniques naturally minimize risk and help teams ship with confidence. However, progressive delivery can only succeed when supported by feedback loops that incorporate observability and automation to accelerate engineering response. When feedback loops include real-time signals about performance and user impact, teams can detect problems early, decide whether to continue or roll back, and gain the assurance they need to release at a faster cadence.
The benefits of a feedback loop extend beyond developers. For platform engineers, they provide a foundation for safe, repeatable rollouts at scale. With the right safeguards in place, platform teams can improve the developer experience and enable faster, more reliable releases across the organization. The result is fewer reactive fixes and less manual oversight during releases.
In this post, we’ll discuss how feedback loops enable faster, safer progressive delivery, including:
- How data-driven feedback improves rollout outcomes
- Why observability makes rollouts effective
- How automation builds trust in rollouts
- How to operationalize feedback loops with Datadog
Data-driven feedback loops enable reliable rollouts
A rollout strategy works best when it’s informed by a data-driven feedback loop. Without reliable signals and a clear path from data to action, techniques like feature flags, canary releases, and blue-green deployments control feature exposure, but offer limited insight into how changes affect performance and users. You’re sending code to a smaller audience but aren’t learning anything useful from the process.
The anatomy of a feedback loop
Every feedback loop follows the same fundamental pattern: signal → decision → action → new signal. The following diagram visualizes how data moves through each stage of a feedback loop.
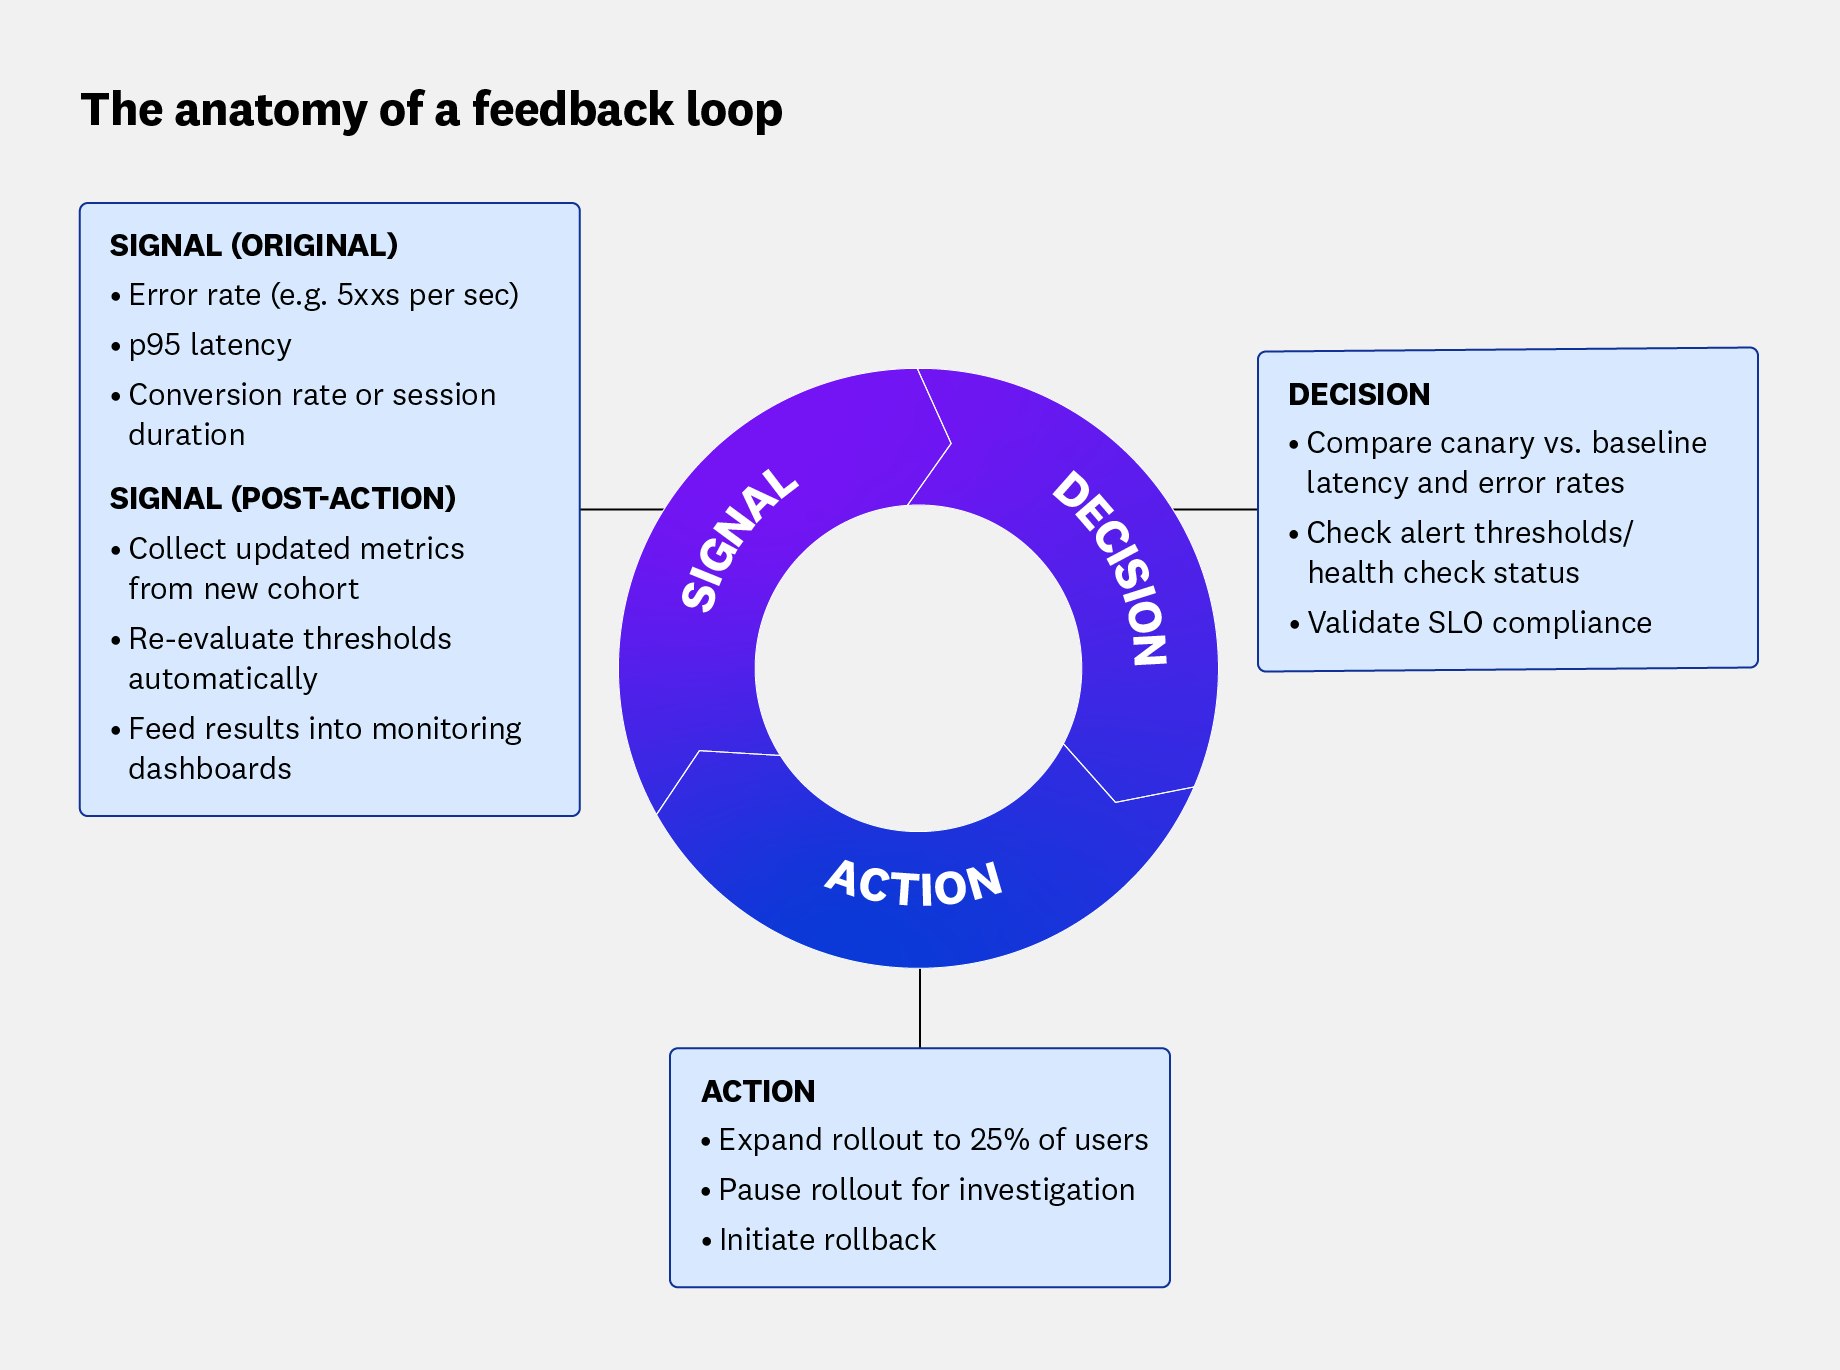
A signal is the data you collect as the rollout progresses. This can include error rates, latency, throughput, or even product-level outcomes like sign-ups and conversion rates.
Decisions describe how you interpret the signal, which helps you choose what to do next. A decision can be made manually or through predefined rules that automatically trigger a response on your behalf. For example, if there’s a significant spike in errors, your system can automatically pause the rollout while you investigate.
An action is whether you expand, pause, or roll back. Healthy metrics may prompt expansion to a larger group of users, while unhealthy metrics can trigger an automated rollback or remediation effort.
Each action generates fresh data that feeds back into the system. These new signals close the feedback loop, turning rollouts into a continuous learning cycle.
Effective feedback loop signals are clear, timely, and actionable
For a feedback loop to be effective, its signals must be clear, timely, and actionable.
Clarity ensures that every signal maps directly to rollout outcomes. Let’s say you deploy a new version of your service to a subset of your infrastructure and notice that latency has increased. Is that change caused by your deployment, normal random variance, or an unrelated issue that originated elsewhere in the system? By comparing the canary group’s performance to a baseline and applying statistical tests to rule out random variance, you can confirm whether the difference is meaningful. Clear signals reveal issues while the blast radius is still small, enabling teams to act before a regression spreads or delays the rollout.
Timeliness determines a signal’s value. Data needs to arrive quickly enough for teams to act without delaying the rollout. When metrics lag, teams can’t confirm whether it’s safe to expand, forcing them to wait and slowing the pace of delivery.
Actionability ensures that insights lead to concrete actions. Predefined thresholds, health checks, or SLO-based guardrails remove ambiguity so teams don’t waste time debating whether to continue, pause, or roll back.
Clear, timely, and actionable signals create a self-sustaining feedback loop where each decision informs the next. Rollouts can evolve from isolated events into an iterative learning process that sharpens team decision-making and shortens the time between idea, validation, and production.
Observability as the backbone of rollouts
Observability data generates the signals that power feedback loops. When metrics, traces, logs, and user-level analytics are tied to rollout cohorts, teams gain a real-time view of performance and user experience.
Let’s say you deploy a new version of your user-management service to a small percentage of traffic. Everything looks fine at first, but soon you notice that sign-ups are trending down. Because you’re already tracking the rollout’s performance metrics, you know that latency has increased for the canary group, which could explain the drop. Reviewing the traces for requests served by the new version, you find that one downstream service is introducing unexpected delays. To finish your investigation, you analyze the logs for the high-latency requests and isolate the issue to a specific API endpoint affecting a subset of users within the canary group.
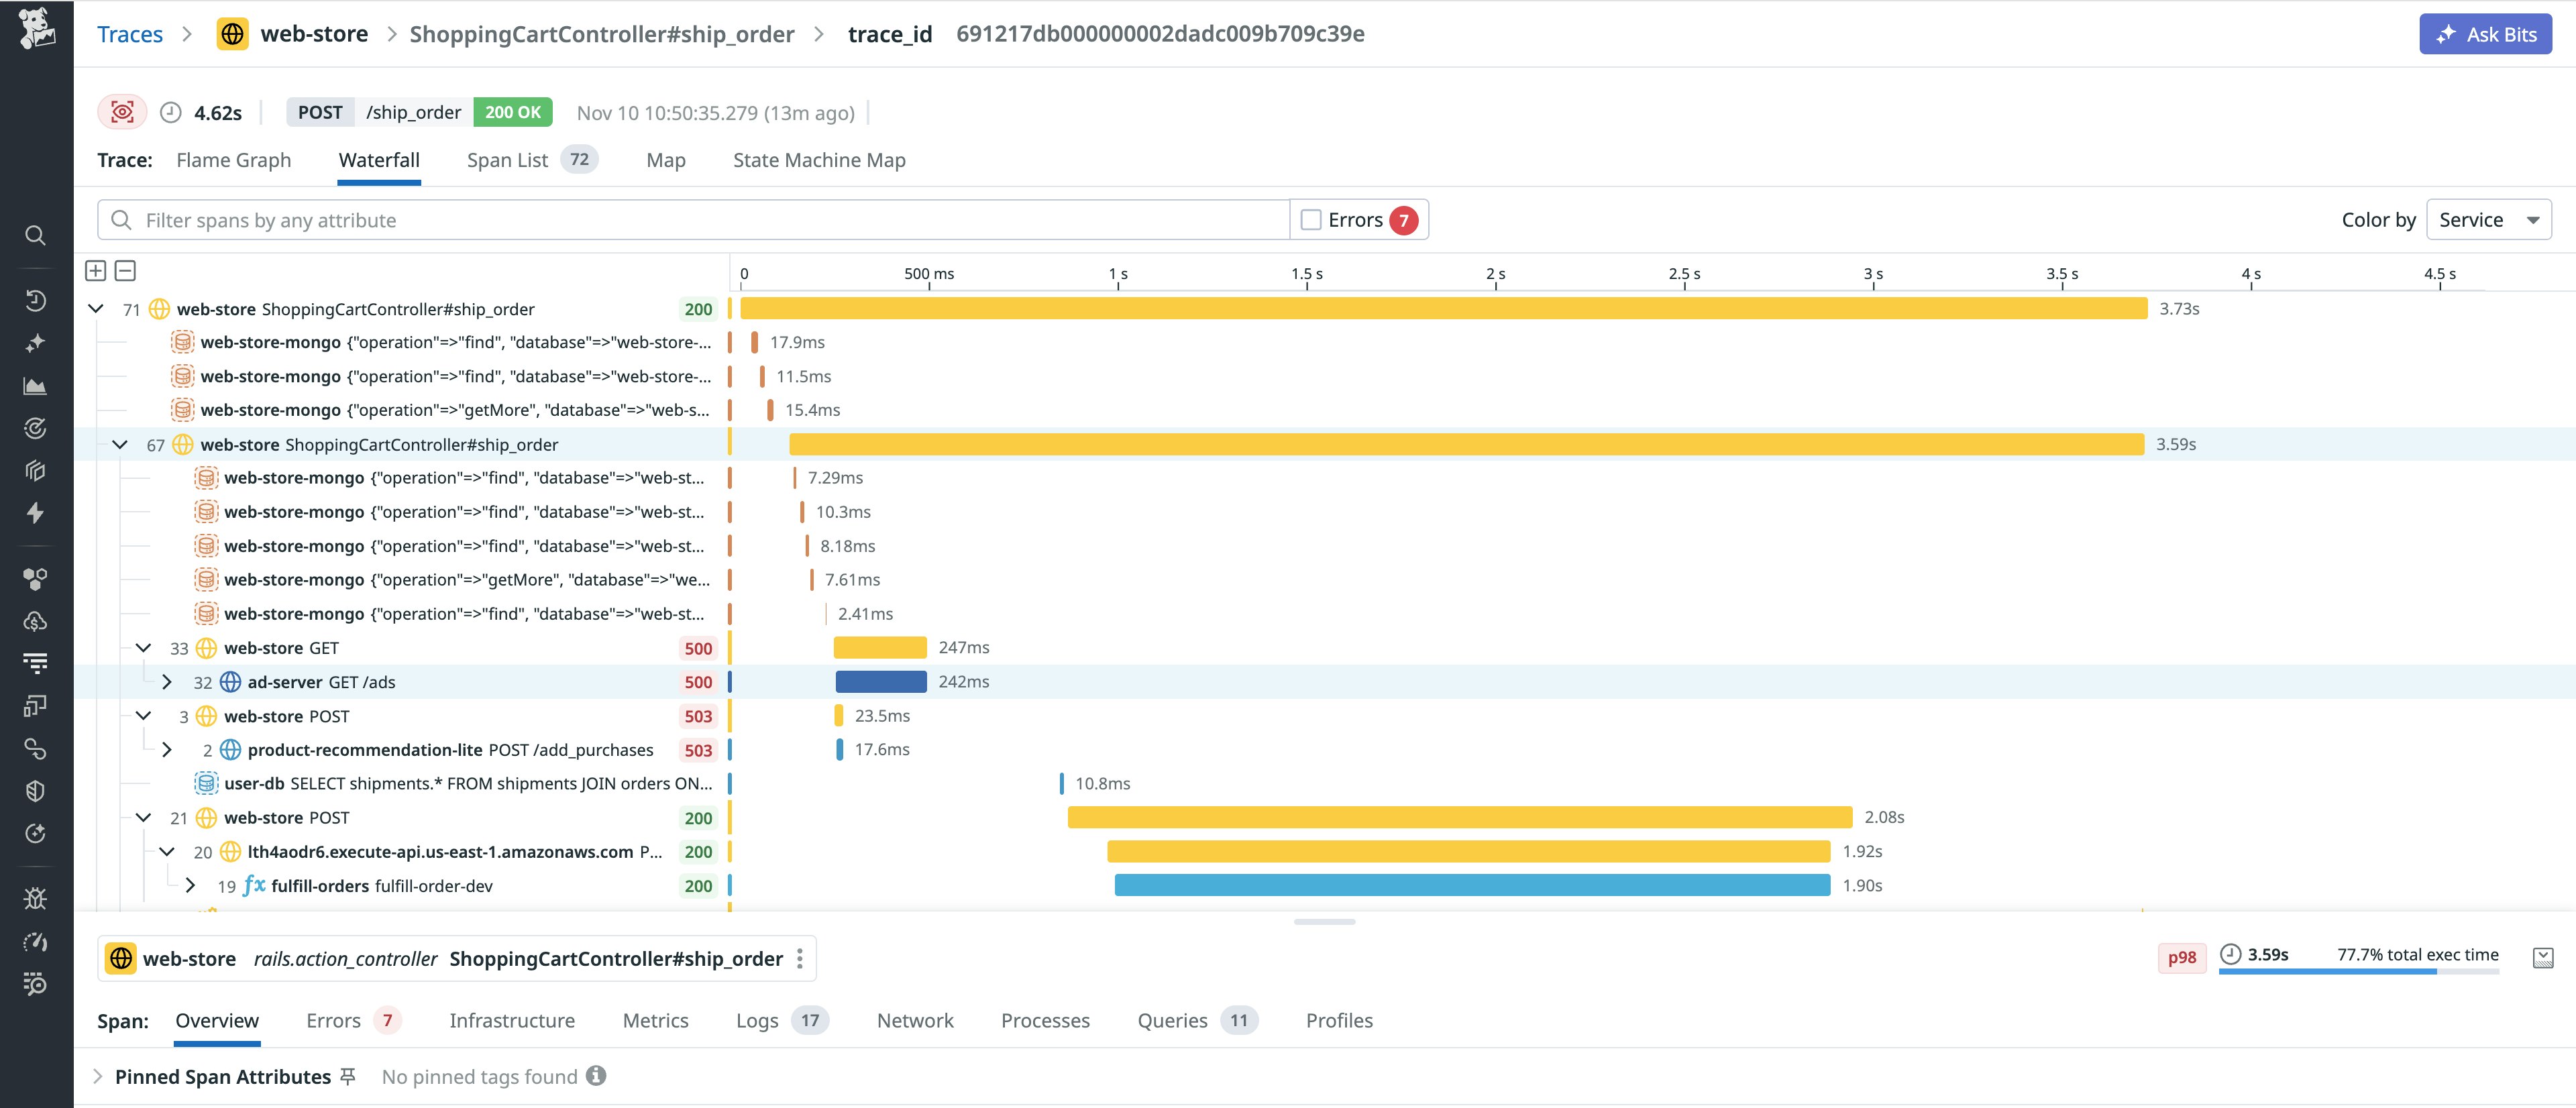
The trace in the following screenshot shows what this type of investigation might look like in practice. Each horizontal bar represents a service involved in processing a single request. Longer bars indicate where latency accumulates across dependencies. In this case, you’re able to witness how a slow downstream service extends total request time, creating a clear performance bottleneck during the rollout.
This is the value of a connected observability stack: metrics, traces, and logs work together to help you follow the path from symptom to cause. Metrics measure what’s changed, highlighting indicators like error rate, latency, and throughput. Traces track performance across services, showing whether regressions are confined to the canary or spreading to dependencies. Logs provide the “why,” adding context that confirms what’s really happening under the hood. In addition to system-level observability, product and user metrics—including sign-ups, conversions, and funnel completion—reveal how a rollout impacts user experience.
Combined, these signals provide a complete view of performance, user experience, and product outcomes, enabling teams to make rollout decisions confidently. Embedding observability into rollout strategies ensures that time-sensitive, consequential data guides decisions and actions throughout the feedback loop. This turns progressive delivery from simple exposure control into a process that improves both speed and safety.
Closing the loop with automation
Signals are most valuable when they drive action automatically. Automation ensures that once data is collected, it triggers consistent, well-timed responses that keep feedback loops agile and efficient. By implementing automation strategically, you can reduce manual work and still leave room for human decision-making when necessary.
Automation in rollouts can include mechanisms such as rollback triggers, health or readiness checks, or policy as code.
- Rollback triggers automatically pause or reverse a rollout when predefined thresholds are breached. For example, if error rates or latency rise above expected levels, the system can halt the rollout to prevent wider impact.
- Health or readiness checks provide a structured way to evaluate whether a service or feature meets defined standards before the rollout continues. These checks might verify latency targets, test coverage, or compliance with operational policies.
- Policy as code expresses safety rules programmatically so that they can be versioned, validated, and reviewed like other code. Defining policies as code adds auditability and repeatability, giving teams a clear history of how rollout rules and decisions evolve over time.
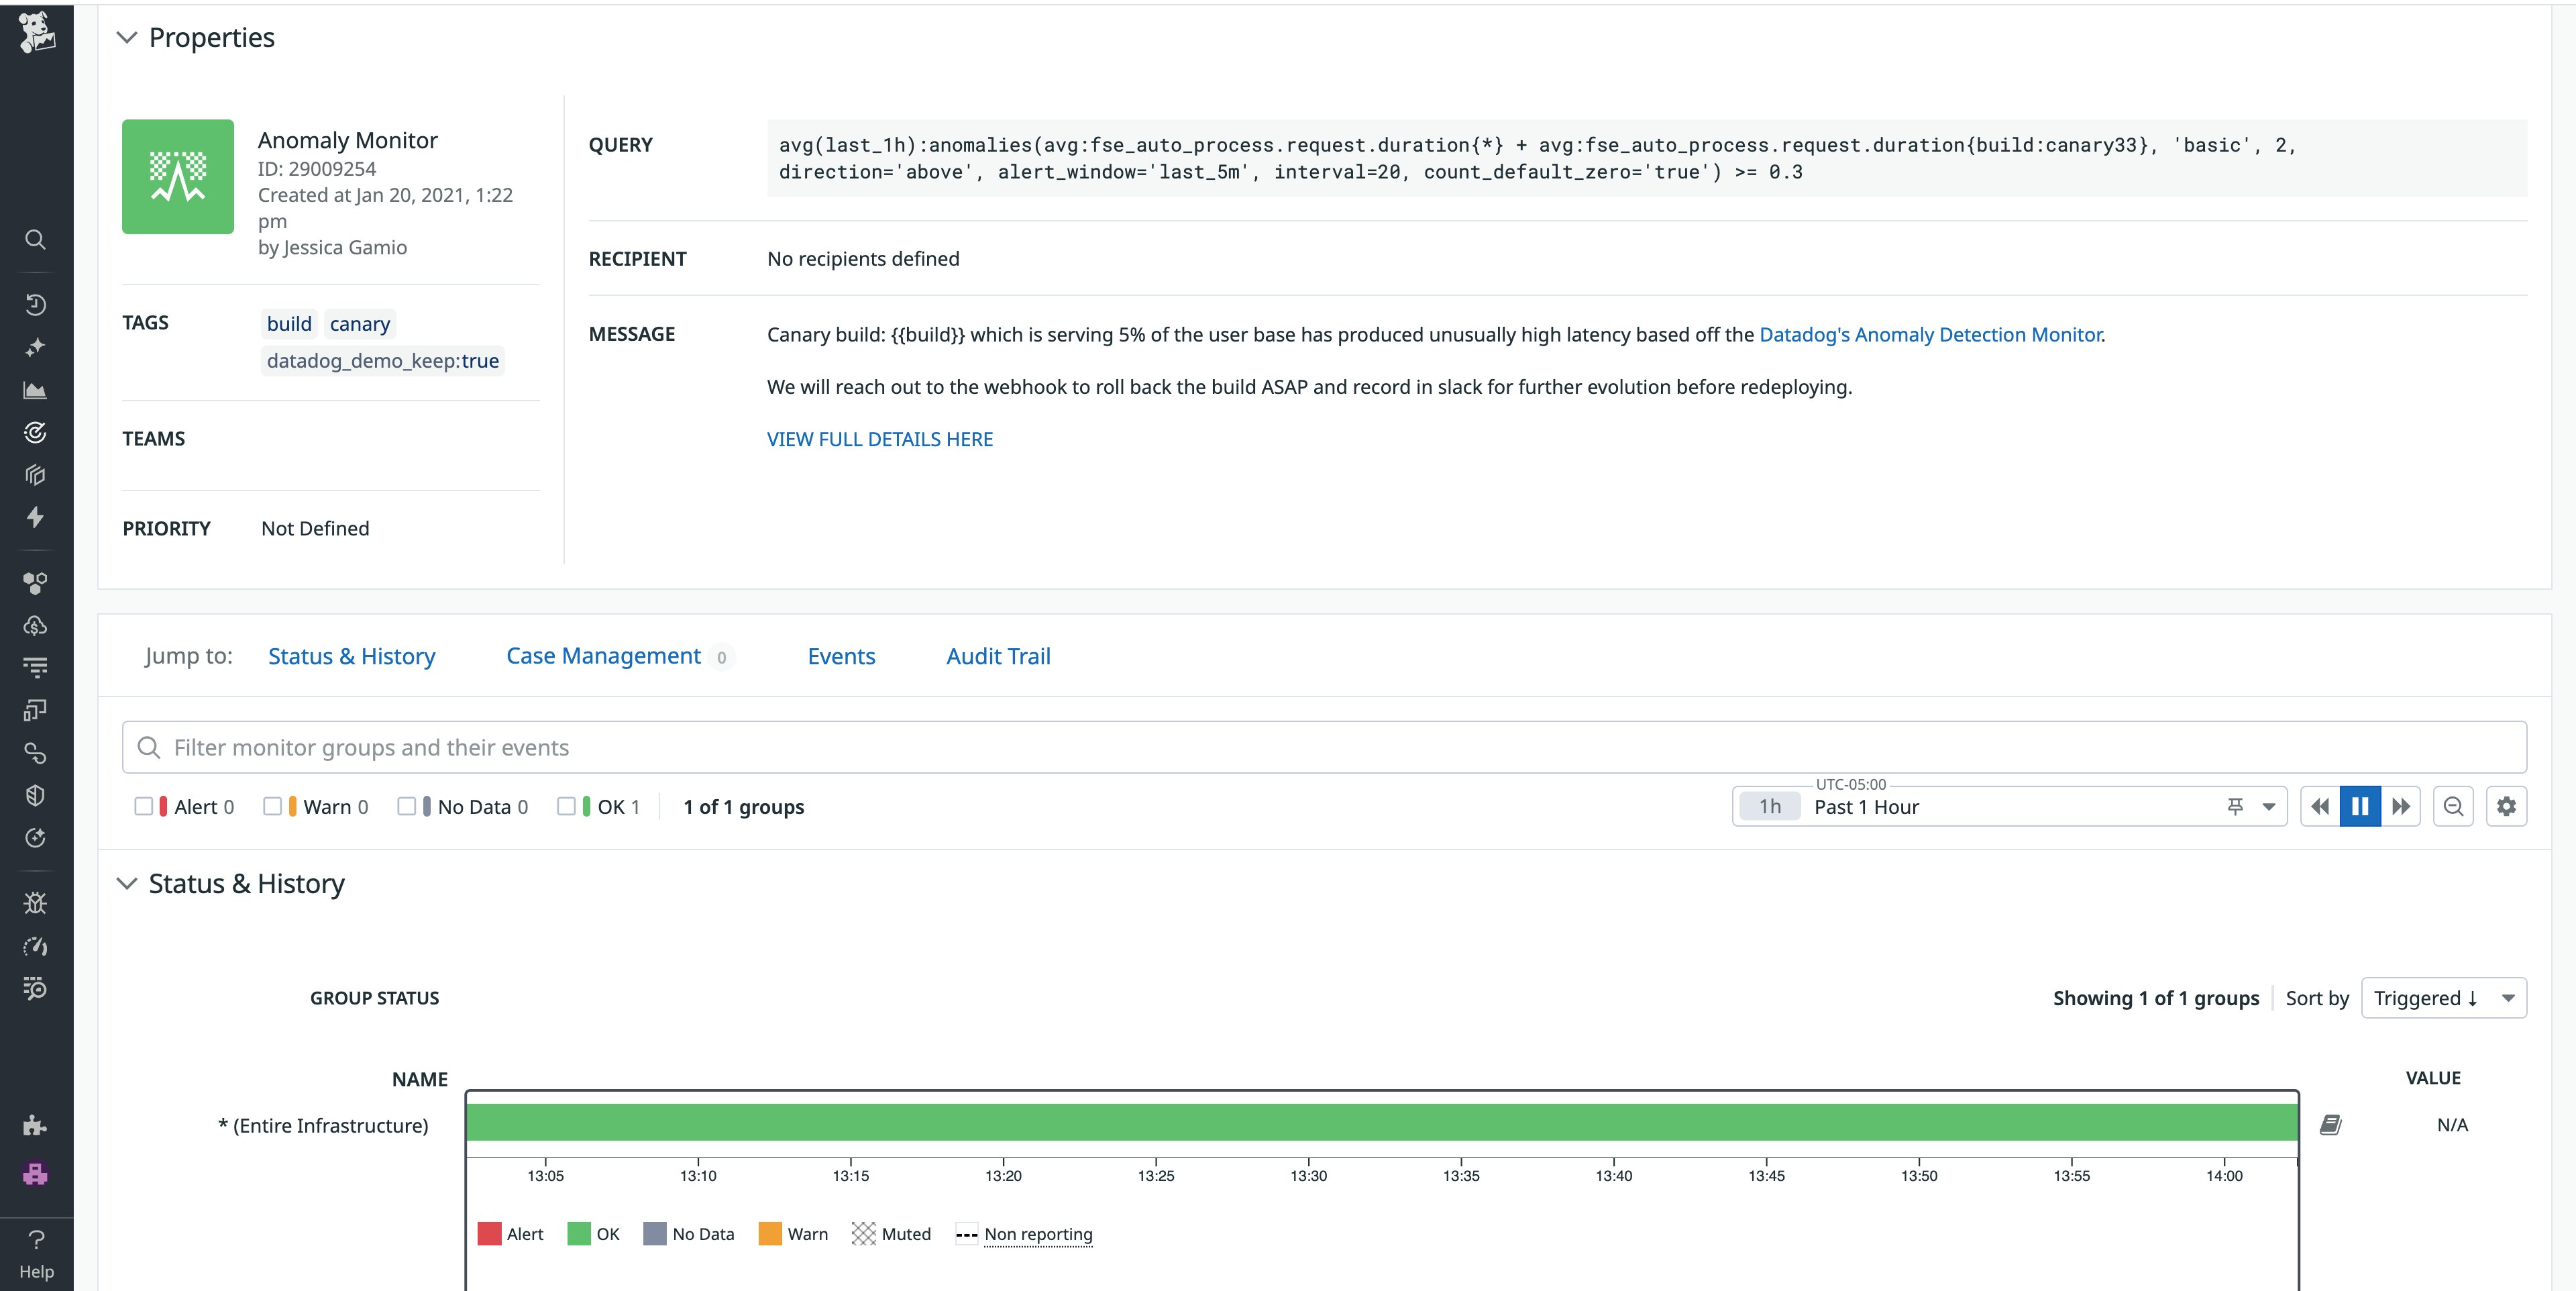
In the following example, a Datadog monitor automatically detects a latency anomaly in a canary build and triggers a rollback. The monitor evaluates recent performance data, compares it against expected thresholds, and initiates the rollback when latency rises above those limits.
Building on these foundational mechanisms, mature delivery pipelines may also incorporate automated canary analysis or promotion, where metrics are statistically evaluated to determine whether a rollout should expand automatically. By incorporating automation into rollout workflows, teams can shift from reactive responses to proactive operations. Each decision happens faster, with greater assurance and less manual overhead. This enables engineers to focus on improving software rather than managing rollout gates.
Reliable feedback loops by default with Datadog
Building effective feedback loops is possible with open source tools, but doing so requires considerable upkeep. A manual setup can include maintaining custom pipelines, building dashboards from scratch, and managing policies across multiple teams.
Datadog provides you with reliable feedback loops by connecting observability, automation, and governance in one platform. By using Datadog Feature Flags and the Internal Developer Portal (IDP), teams can adopt data-driven rollout practices without the operational overhead of managing separate tools.
Measure the impact of rollouts with Datadog Feature Flags
Datadog Feature Flags enables teams to manage how new code reaches users and measure its impact in real time. Each flag variation or rollout cohort is automatically associated with relevant metrics, traces, and logs, which gives developers visibility into performance differences between versions. Using a lightweight experimentation pipeline to compare canary and baseline cohorts, Feature Flags helps you identify whether changes in error rate or latency are meaningful.
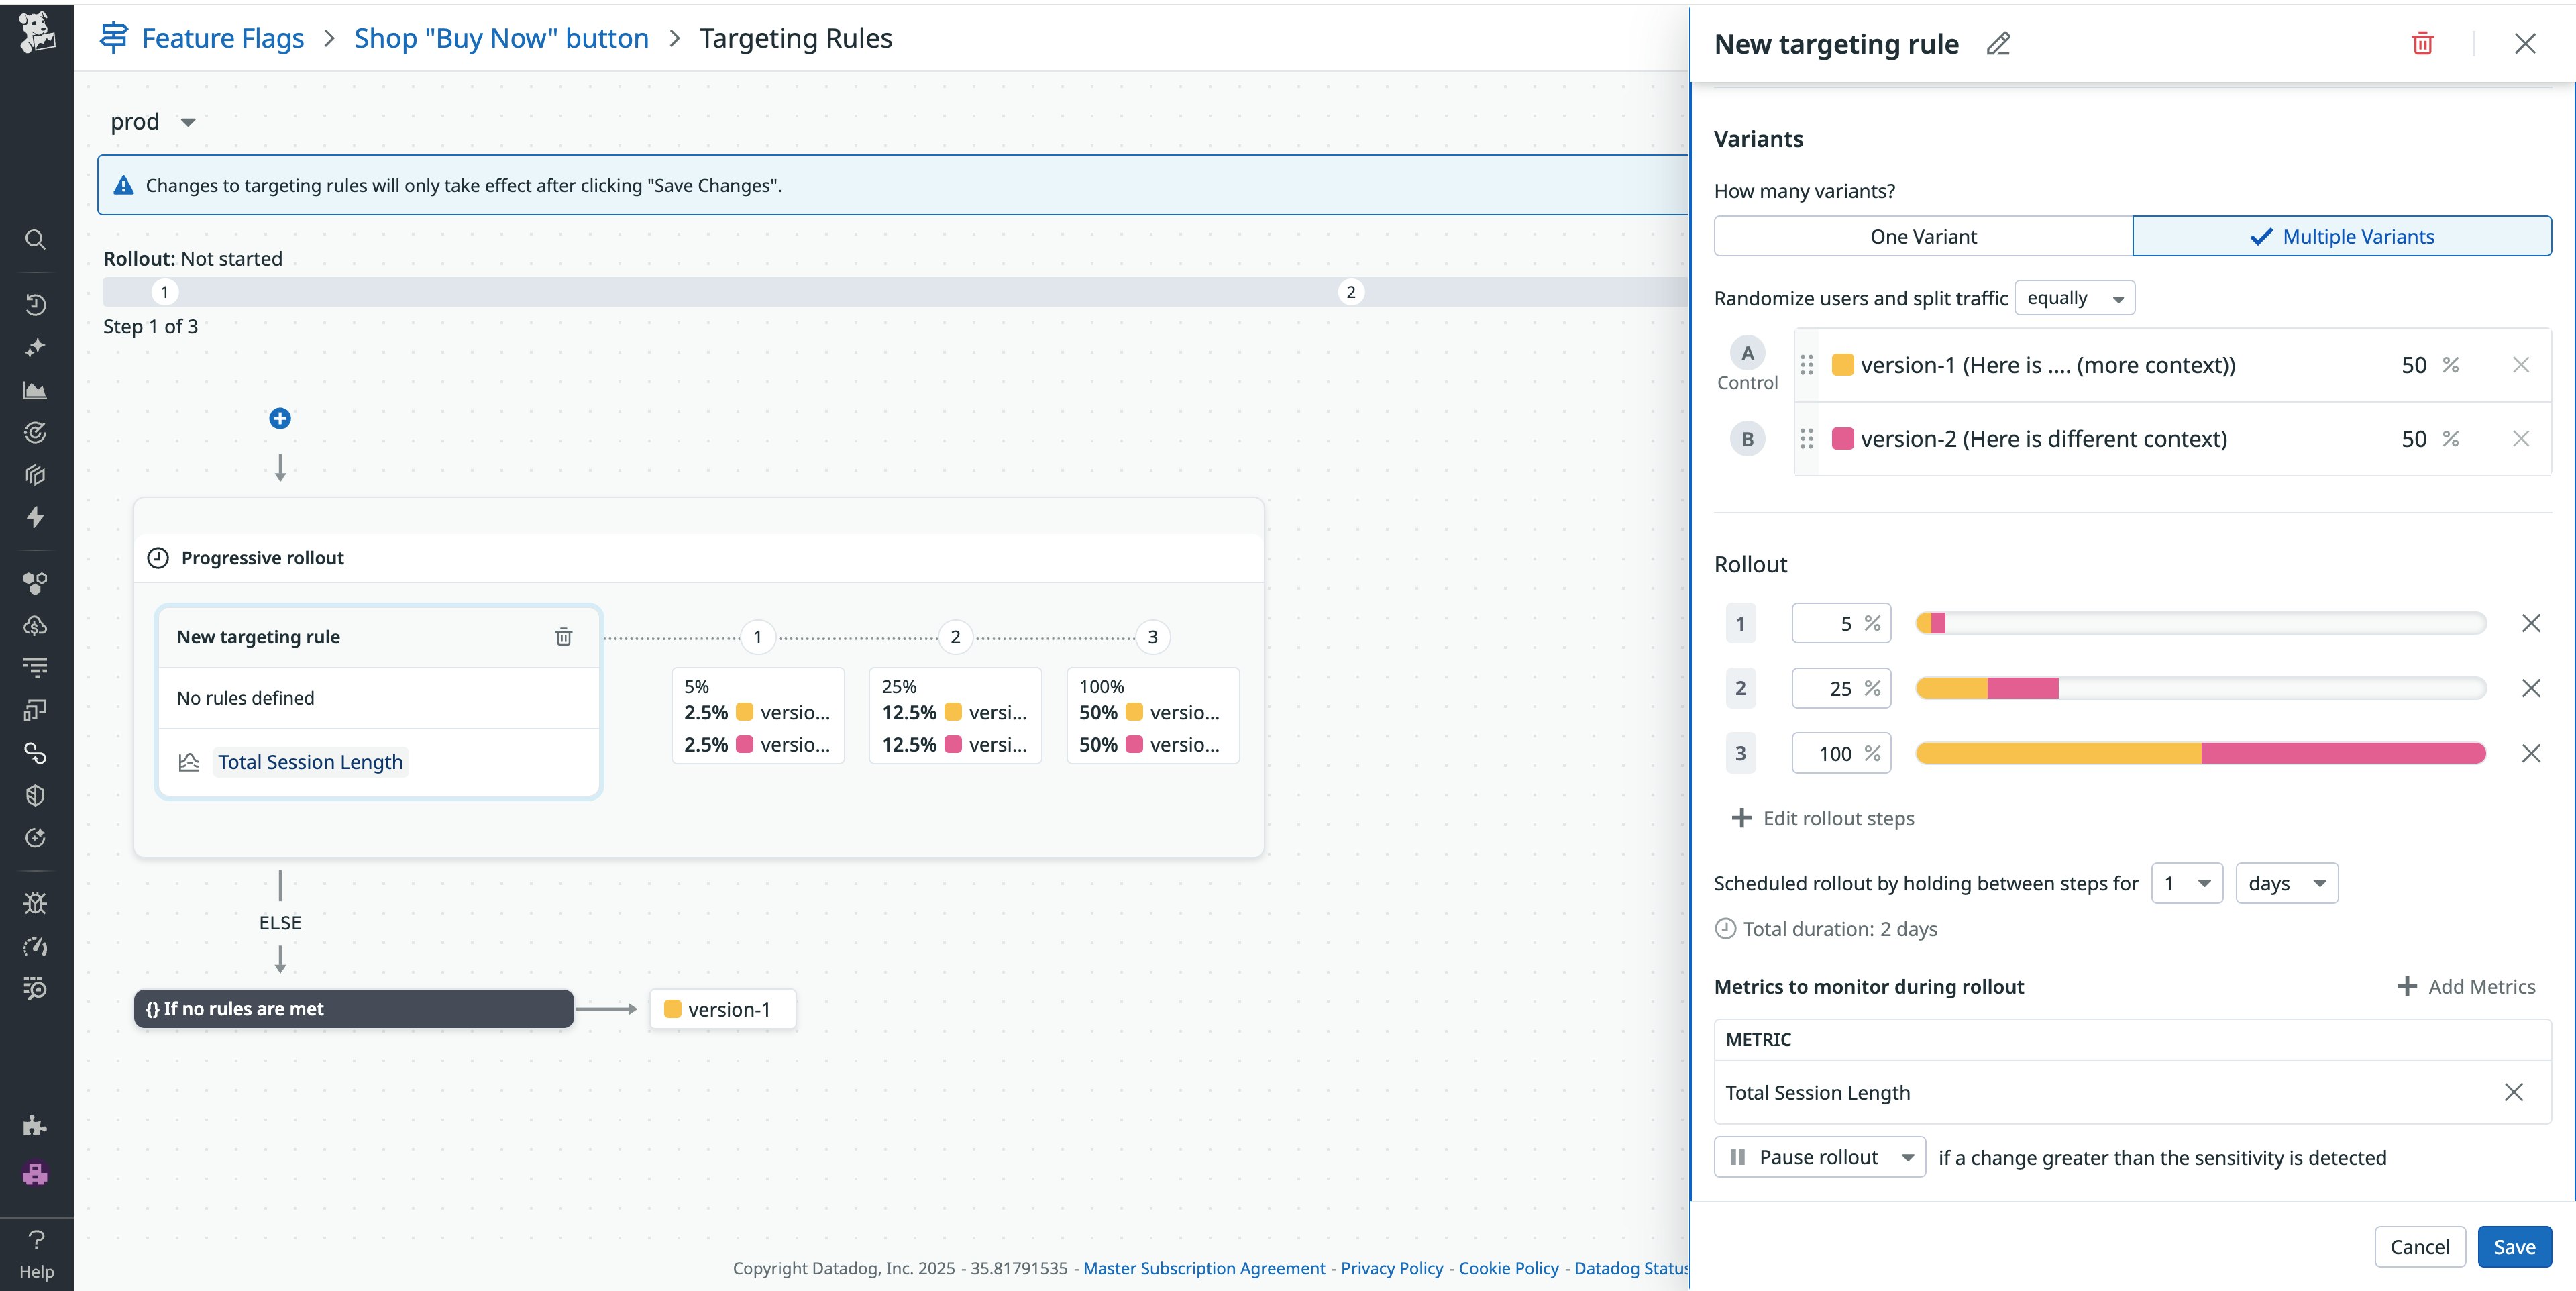
This ability to compare canary and baseline cohorts helps teams distinguish between genuine regressions and external events (such as a cloud provider incident), which might affect multiple rollouts at once.
Centralize service ownership and release governance with Datadog Internal Developer Portal
The Datadog Internal Developer Portal (IDP) provides a centralized view of services, ownership, and operational health, which helps teams build consistency and trust in their rollout processes. Datadog IDP includes the Software Catalog, which connects each service to its dependencies, telemetry data, and documentation, making rollout signals easy to interpret and act on. For example, if a rollout triggers an alert, an engineer can use the Software Catalog to find which team owns the affected service, review related logs or traces, and quickly identify if any upstream or downstream dependencies were impacted.
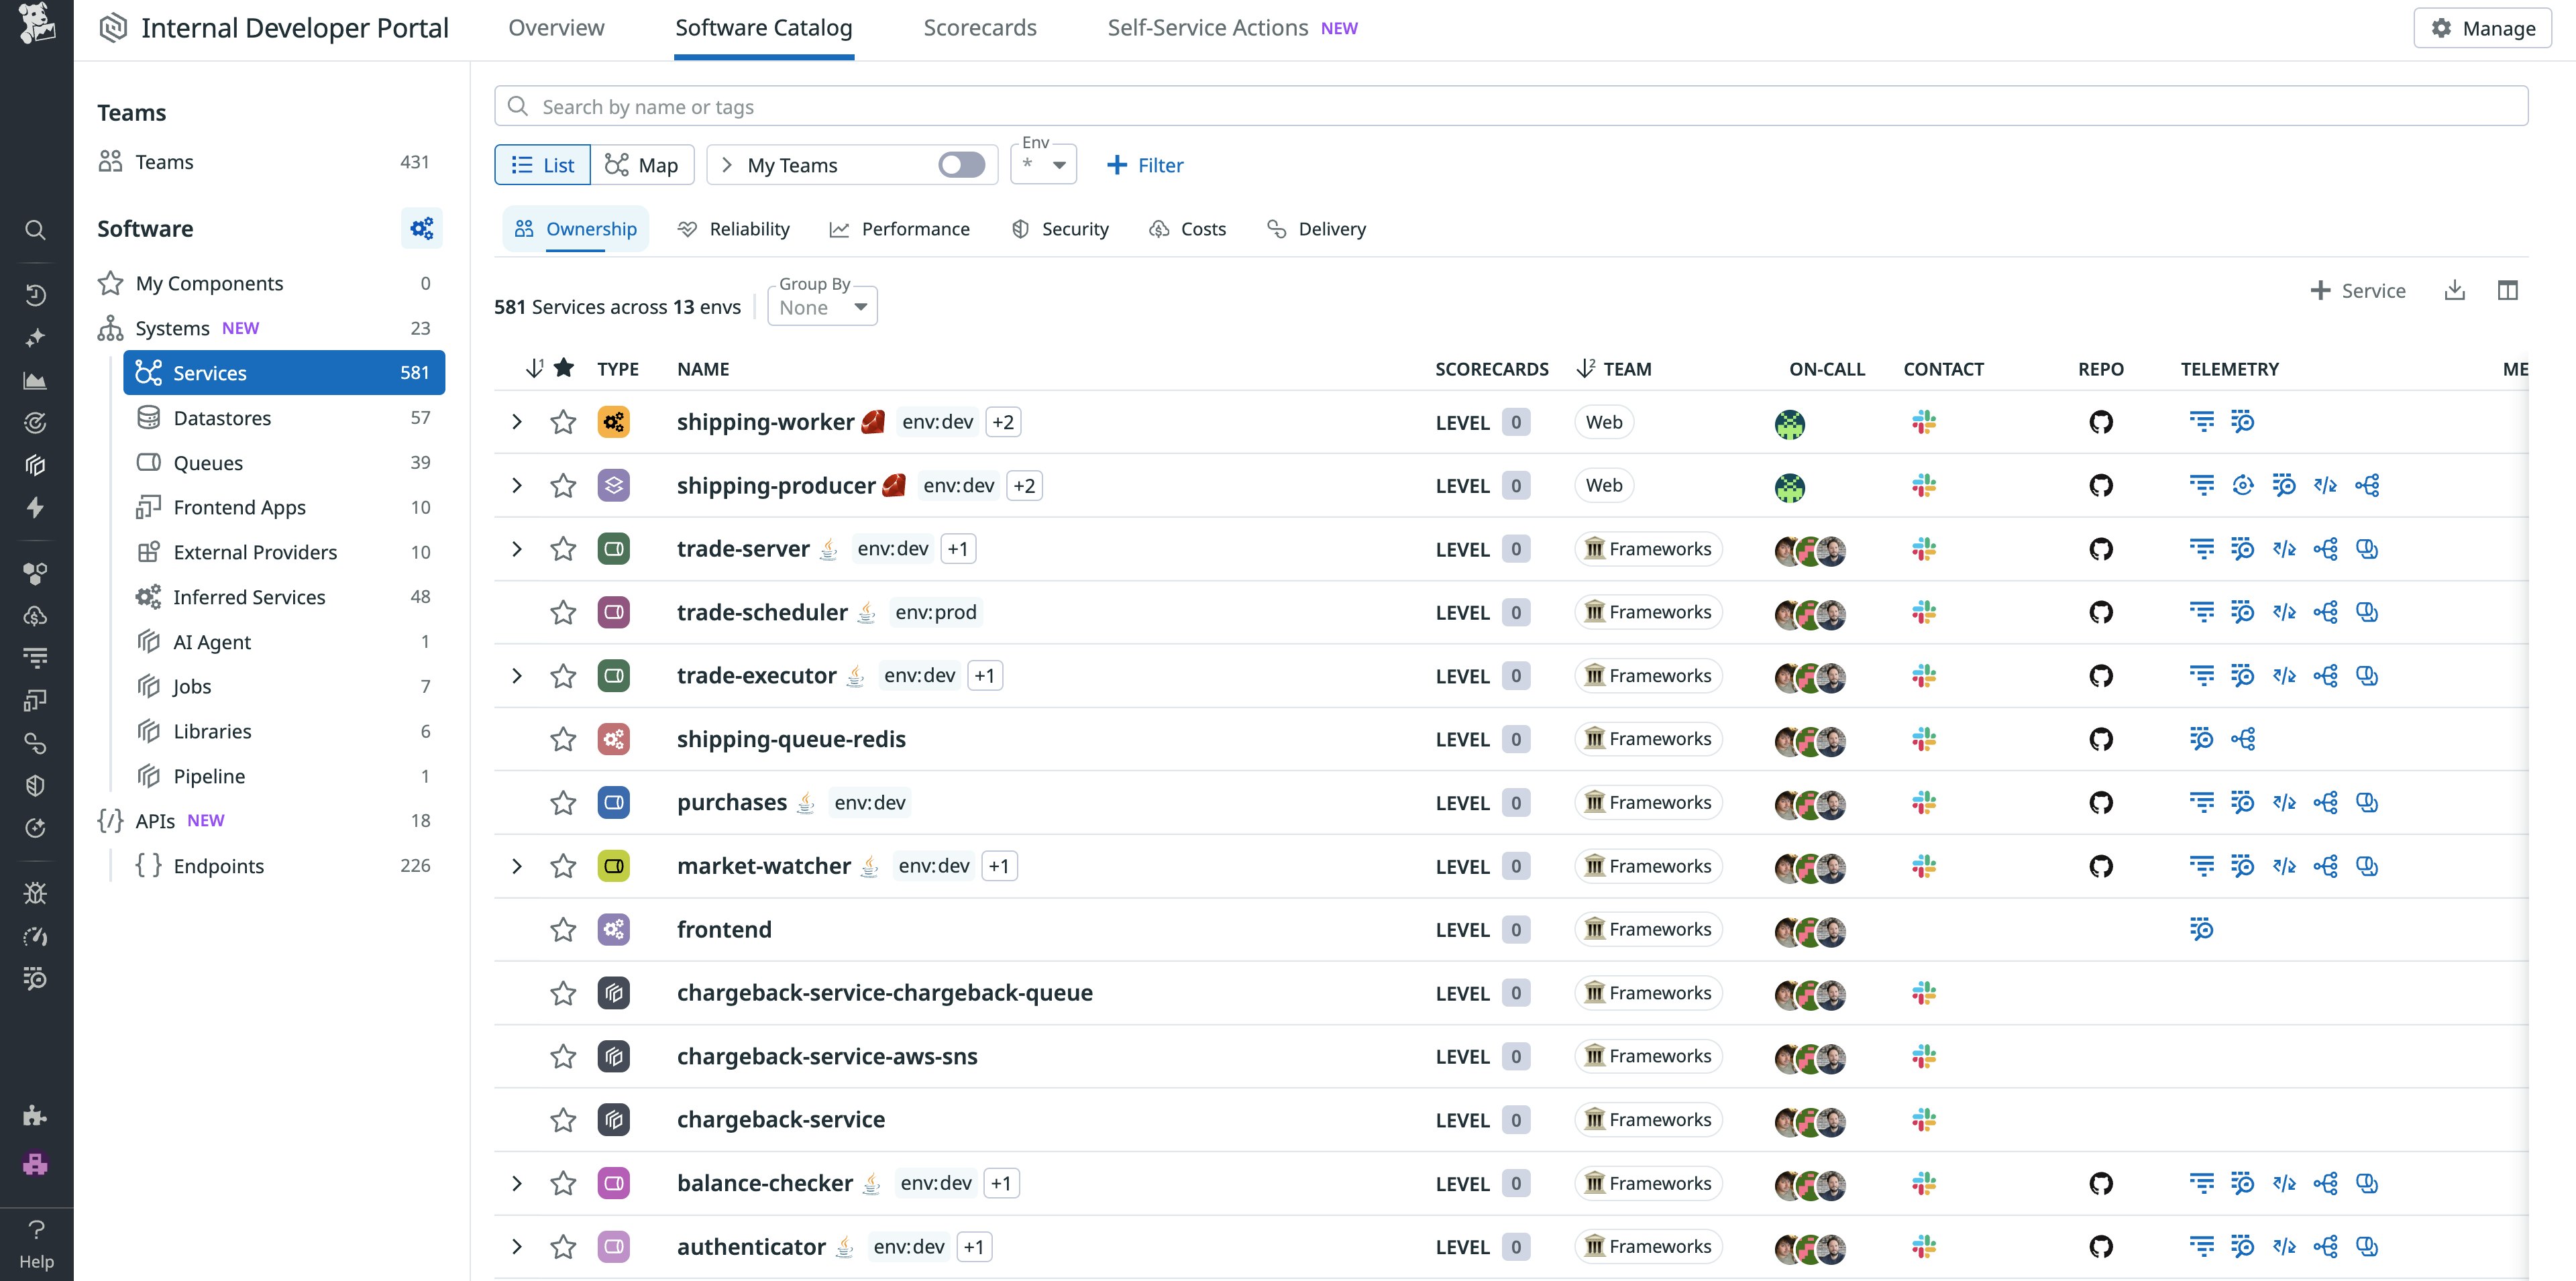
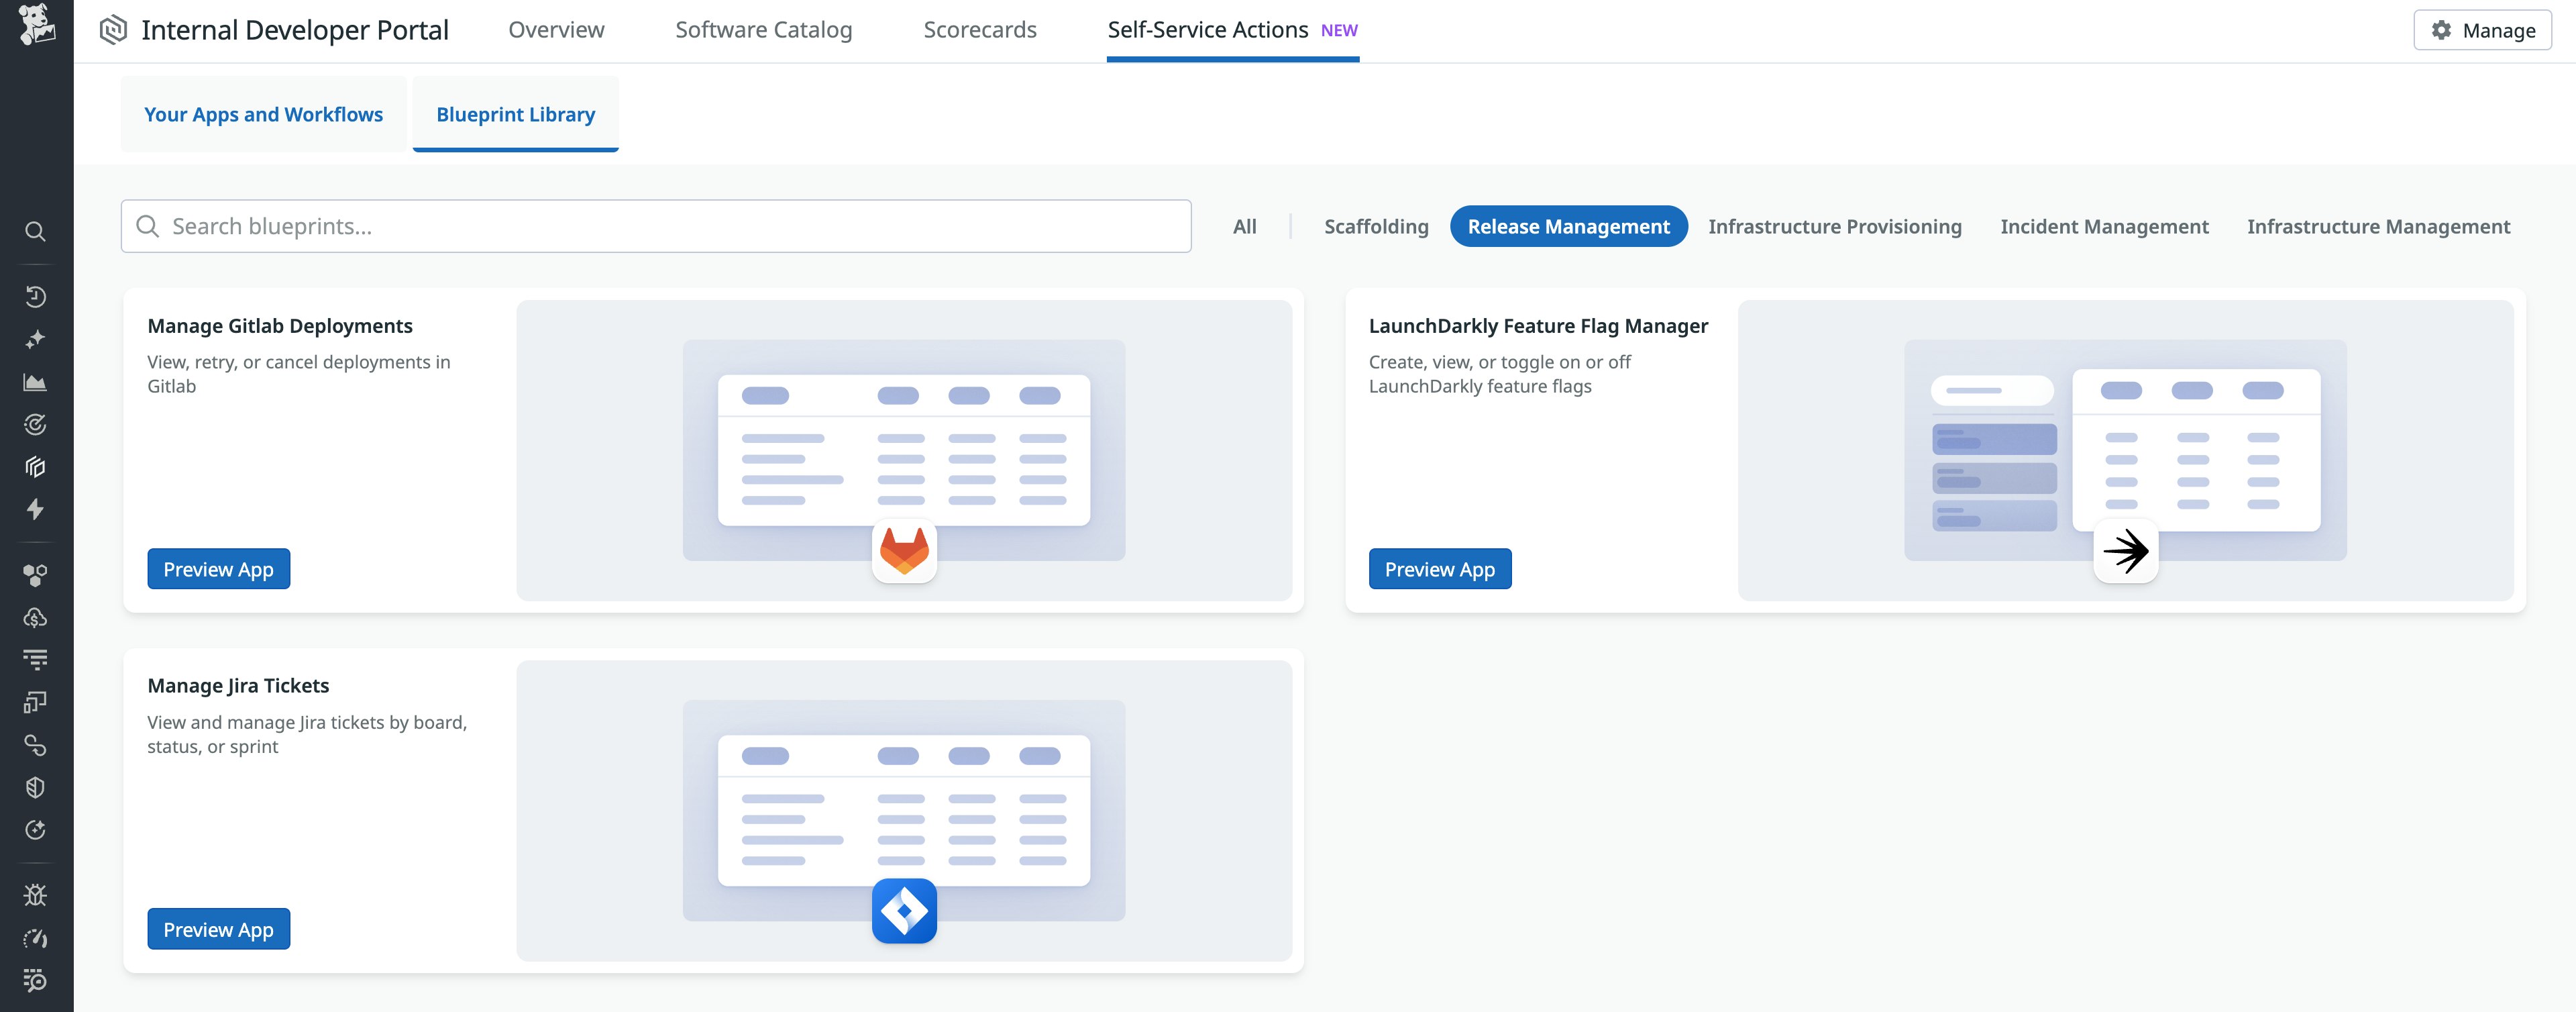
IDP also contains Scorecards, which platform engineers can use to codify and track best practices across teams. Scorecards verify that services follow standard rollout mechanisms and meet defined reliability criteria. They also quantify readiness by deriving error budgets and latency thresholds from SLOs. Self-Service Actions in IDP give developers the tools they need to act independently, while ensuring they meet the organizational standards for security, compliance, and reliability. As an example, Self-Service Actions can guide teams through the checks required before a rollout begins, confirming that monitoring, alerting, and rollback configurations are in place before the first deployment.
Feedback loops keep progressive delivery fast and safe
Progressive delivery thrives on trust: trust in your signals, automation, and processes. Effective feedback loops tie those elements together, providing teams with clear data that results in consistent responses during every rollout.
To learn more, you can visit our Feature Flags documentation and IDP documentation. You can also create your first feature flag by requesting access to the Datadog Product Preview Program. If you’re new to Datadog and want to explore how we can become a part of your monitoring strategy, you can get started now with a 14-day free trial.


