Ayush Kapur

Meghan Lo
Reducing noise in your logs is critical for quickly identifying bugs in your code and determining which errors to prioritize for remediation. To help you spot and investigate the issues causing errors in your environments, we’re pleased to announce that Datadog Error Tracking is now available for Log Management.
Already available for Real User Monitoring (RUM) and APM, Error Tracking for logs intelligently groups errors from your logs into issues to help you quickly understand and triage bugs in your environment. Issues surface diagnostic data like stack traces, error distributions, and code snippets that help reveal the underlying bug’s root cause. You can also set up Error Tracking monitors in Datadog that will notify your team when new issues, regressions, or high error counts are detected.
In this post, we’ll cover how to use Error Tracking to:
Triage errors at a glance
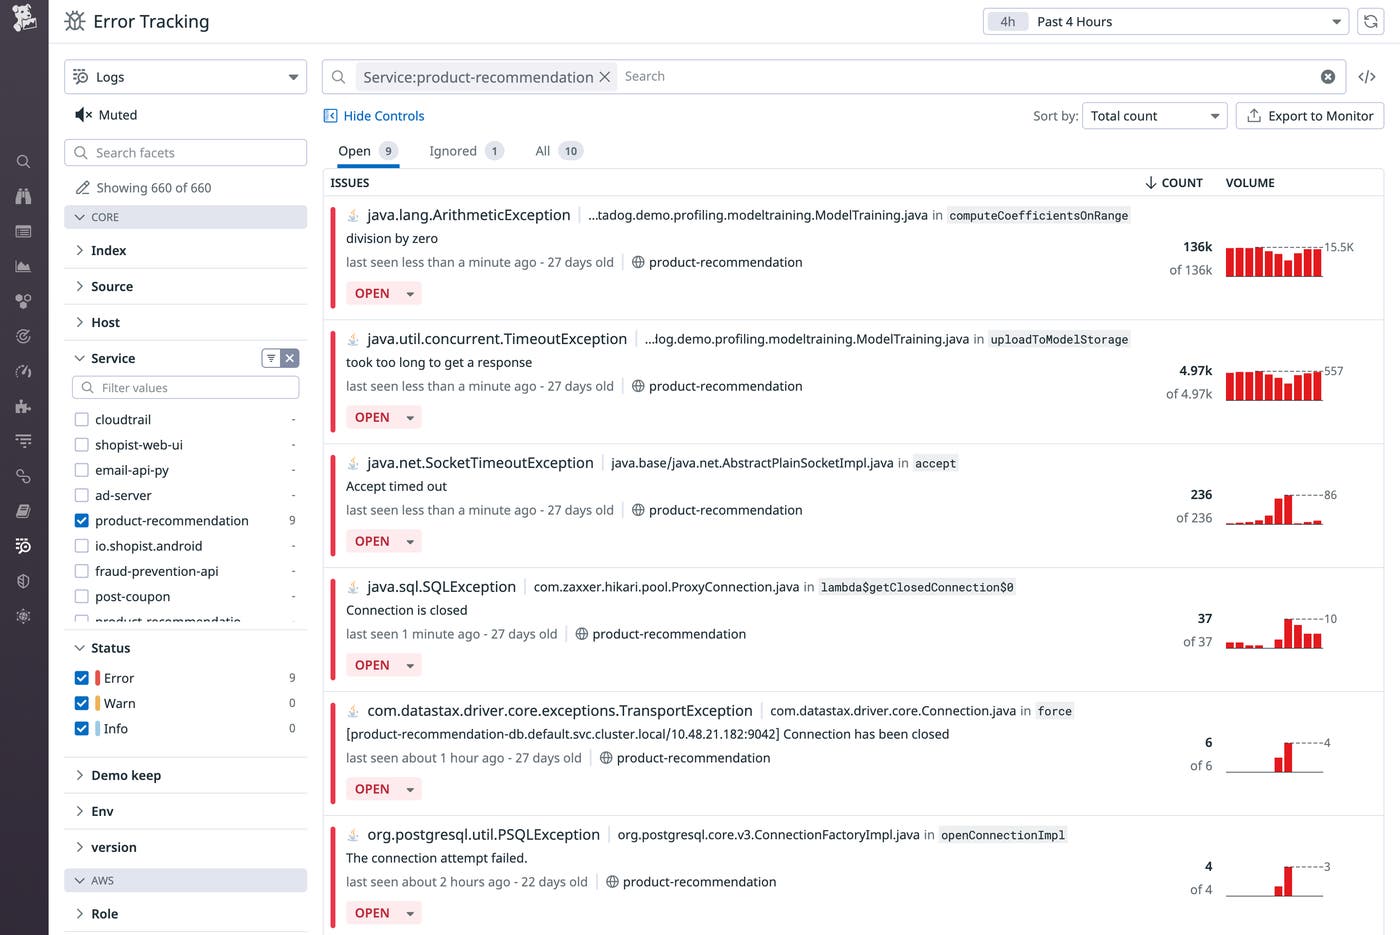
Complex modern infrastructures might generate thousands to millions of errors per day. As a developer, it’s impossible to investigate, let alone remediate, each of these individually. The Issue List in Error Tracking provides a central location that helps you quickly visualize problems by grouping errors from your logs that share certain attributes (like a similar stack trace) into issues. Instead of sifting through vast volumes of logs, you can investigate a handful of issues and get insights on the highly correlated errors they explain.

You can sort your Issue List by number of error occurrences or age—these factors can help you determine which issues to prioritize and address first. Workflow states such as “Open” or “Ignored” help your team keep track of the status of an issue and understand where it is in the remediation process. You can also filter the list using standard and custom log facets to reach the issues you care about most.
Drill down to individual issues to get more context
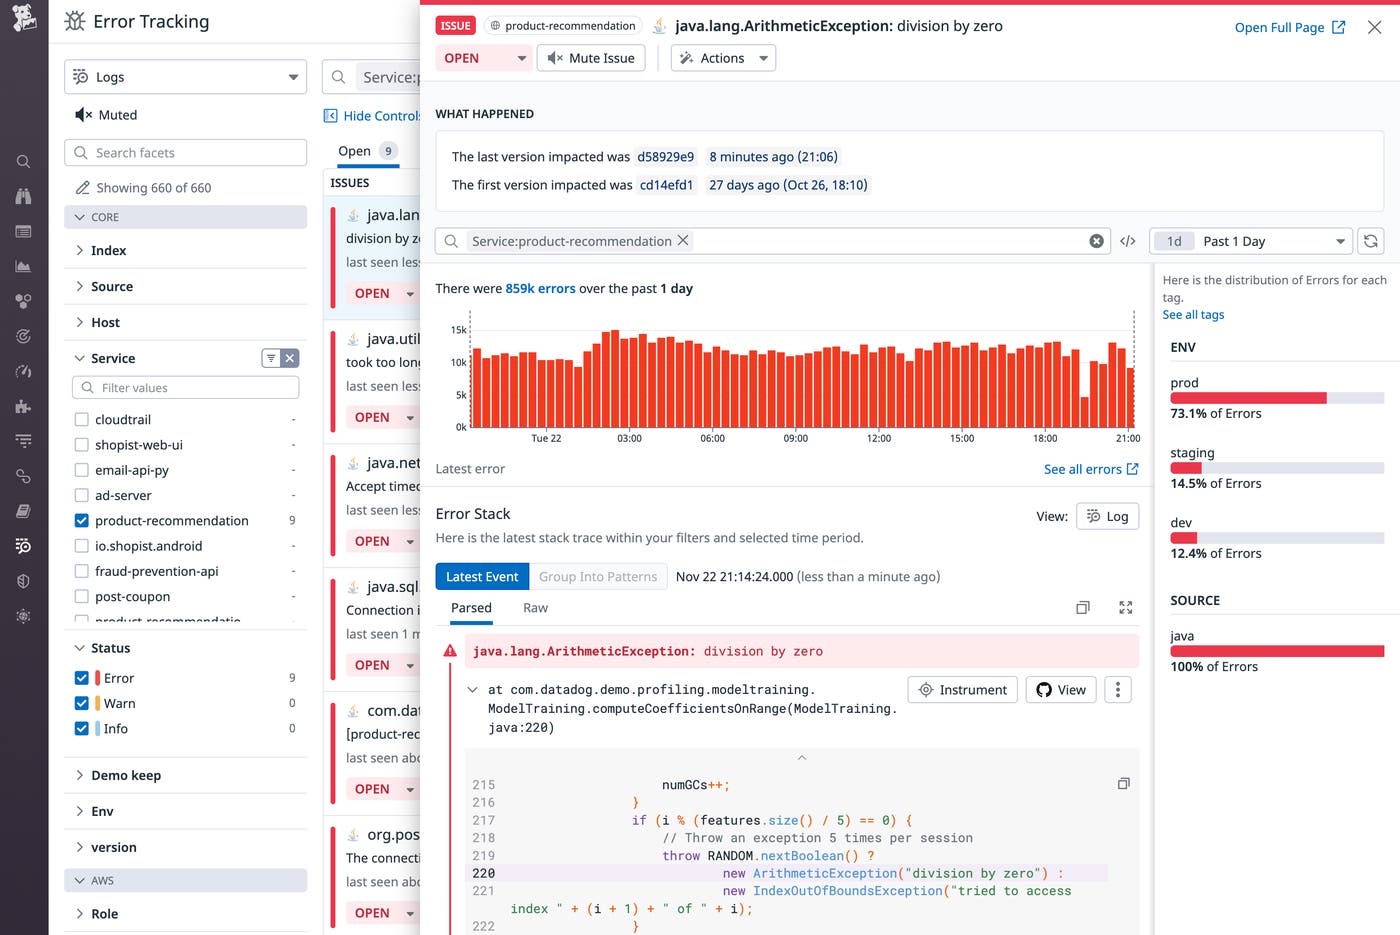
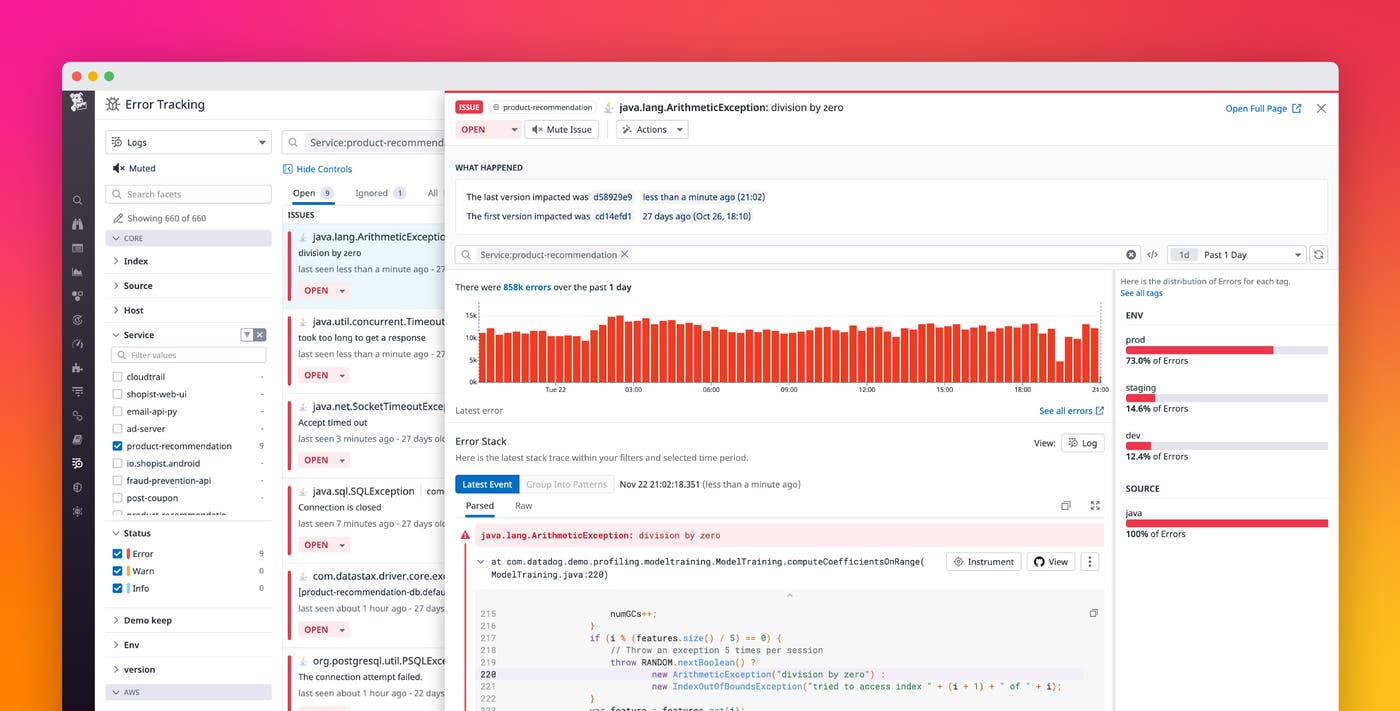
One logical starting point is to address the issues with the highest error log counts first—in the Issue List below, the java.lang.ArithmeticException error is by far the most common, indicating that we may be repeatedly performing an illegal divide-by-zero operation. Once you’ve targeted an issue, you’ll need additional context to prioritize and remediate it. Clicking on an issue opens the Issue Panel, which allows for a deeper dive into the associated error logs, including historical error volumes, a stack trace, and the error’s distribution across environments and sources. Source code integrations allow you to see the offending code inline, showing where a bug might lie.

The panel also displays the first and last versions impacted with timestamps. This metadata is persistent, so you’ll be able to see when this issue was introduced, even if it goes back further than your standard log retention period. If errors grouped into this issue have different stack traces, you can group them into patterns to examine their commonalities. This analysis provides useful context for the developer assigned to fix the issue, so they can find the root cause more quickly and speed up time to resolution.
Alert on your errors to stay ahead of issues
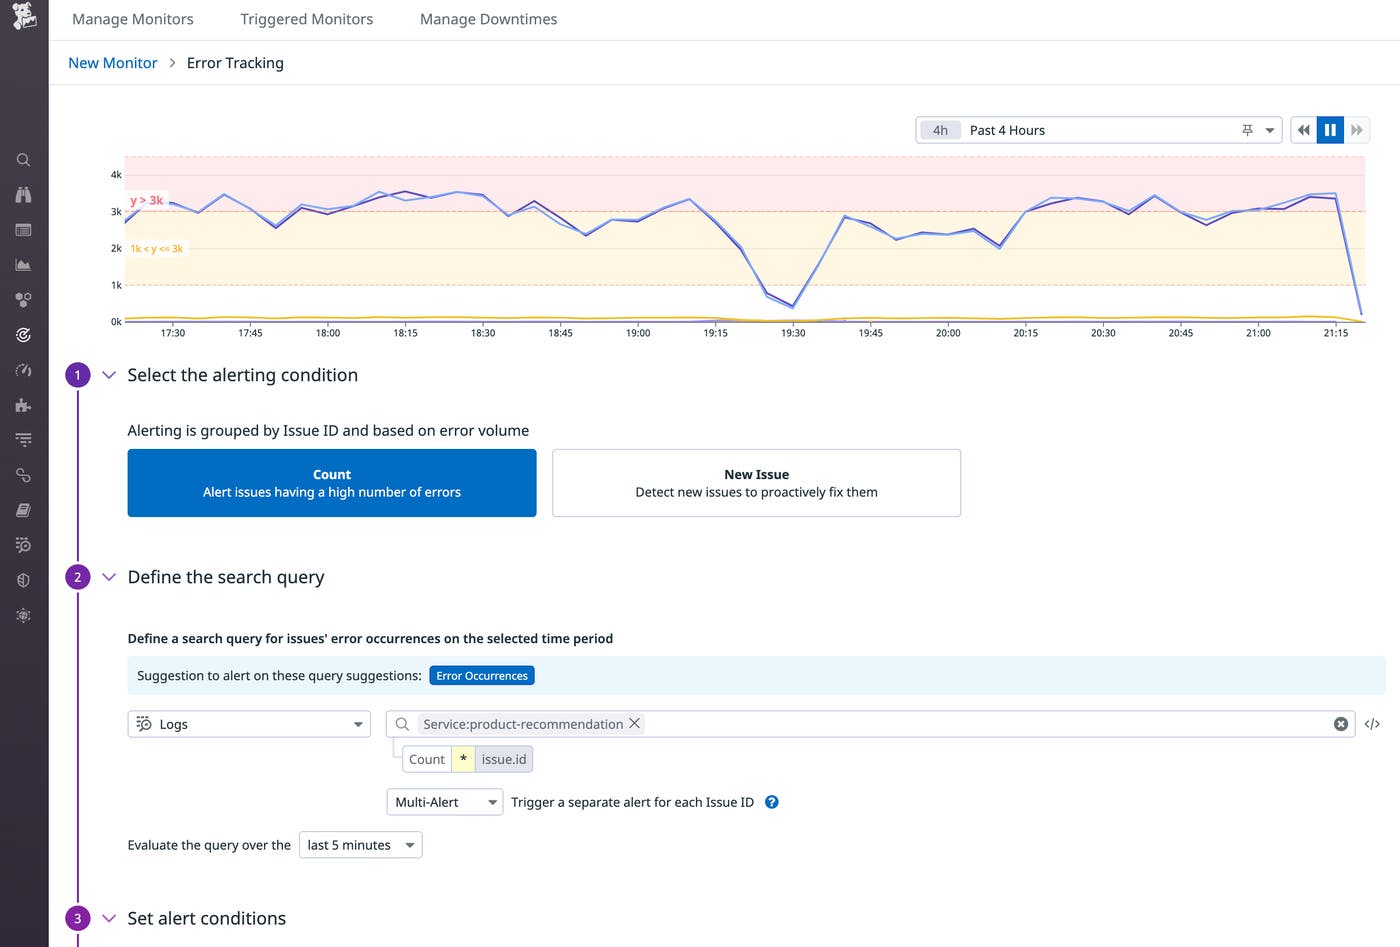
Not all changes in your error logs are equally important, but there are some you may want to know about immediately so you can investigate whether they indicate a critical issue. With Error Tracking, you can create two different types of monitors based on trends in your errors.
New Issue monitors alert you when a new bug appears in your code for the first time or when a regression occurs. This ensures you’re aware of previously undetected issues in your environment and can investigate them to determine if immediate remediation is warranted.
Count monitors alert on issues that are experiencing a high number of errors. You can configure warning and alert thresholds for this type of monitor to help limit alert fatigue.

Error Tracking monitors can alert your team through integrations with Slack and PagerDuty, ensuring someone is aware of critical issues and can act as soon as possible. You can also dynamically trigger webhooks to run custom actions in response to specific alerts.
Reduce noise in your error logs with Error Tracking
Datadog’s Error Tracking helps you separate signal from noise in your logs. It intelligently groups errors into issues, lets you investigate the details in depth, and alerts your team to critical trends and changes in your logging data. This means you can identify issues in your code faster, pinpoint their root causes, push fixes sooner, and lower your mean time to resolution.
Error Tracking for logs is now available within Datadog Log Management. Read the Error Tracking for logs setup documentation to get started and enable in-app today. If you aren’t already a Datadog customer, you can sign up for a 14-day free trial.

