Tarun Kothandaraman
When an error occurs, developers need to act quickly. But too often, they’re left searching through stack traces without enough context to understand what happened, who owns the code, or what change may have introduced the issue. This slows down triage, creates inefficient handoffs, and takes time away from building new features.
Datadog Error Tracking already helps teams cut through the noise by automatically grouping similar errors and surfacing useful metadata. With our GitHub integration, developers can go a step further: view the exact lines of code referenced in a stack trace, identify the commit that likely introduced the issue, and determine what team owns the affected code using GitHub CODEOWNERS or Datadog service ownership. When auto-assignment is enabled, Error Tracking can also assign the issue to the developer responsible for the suspect commit, with no manual triage required.
In this post, we’ll walk through how the Datadog GitHub integration enhances the Error Tracking experience, helping you:
- View code snippets in your stack traces to troubleshoot in context
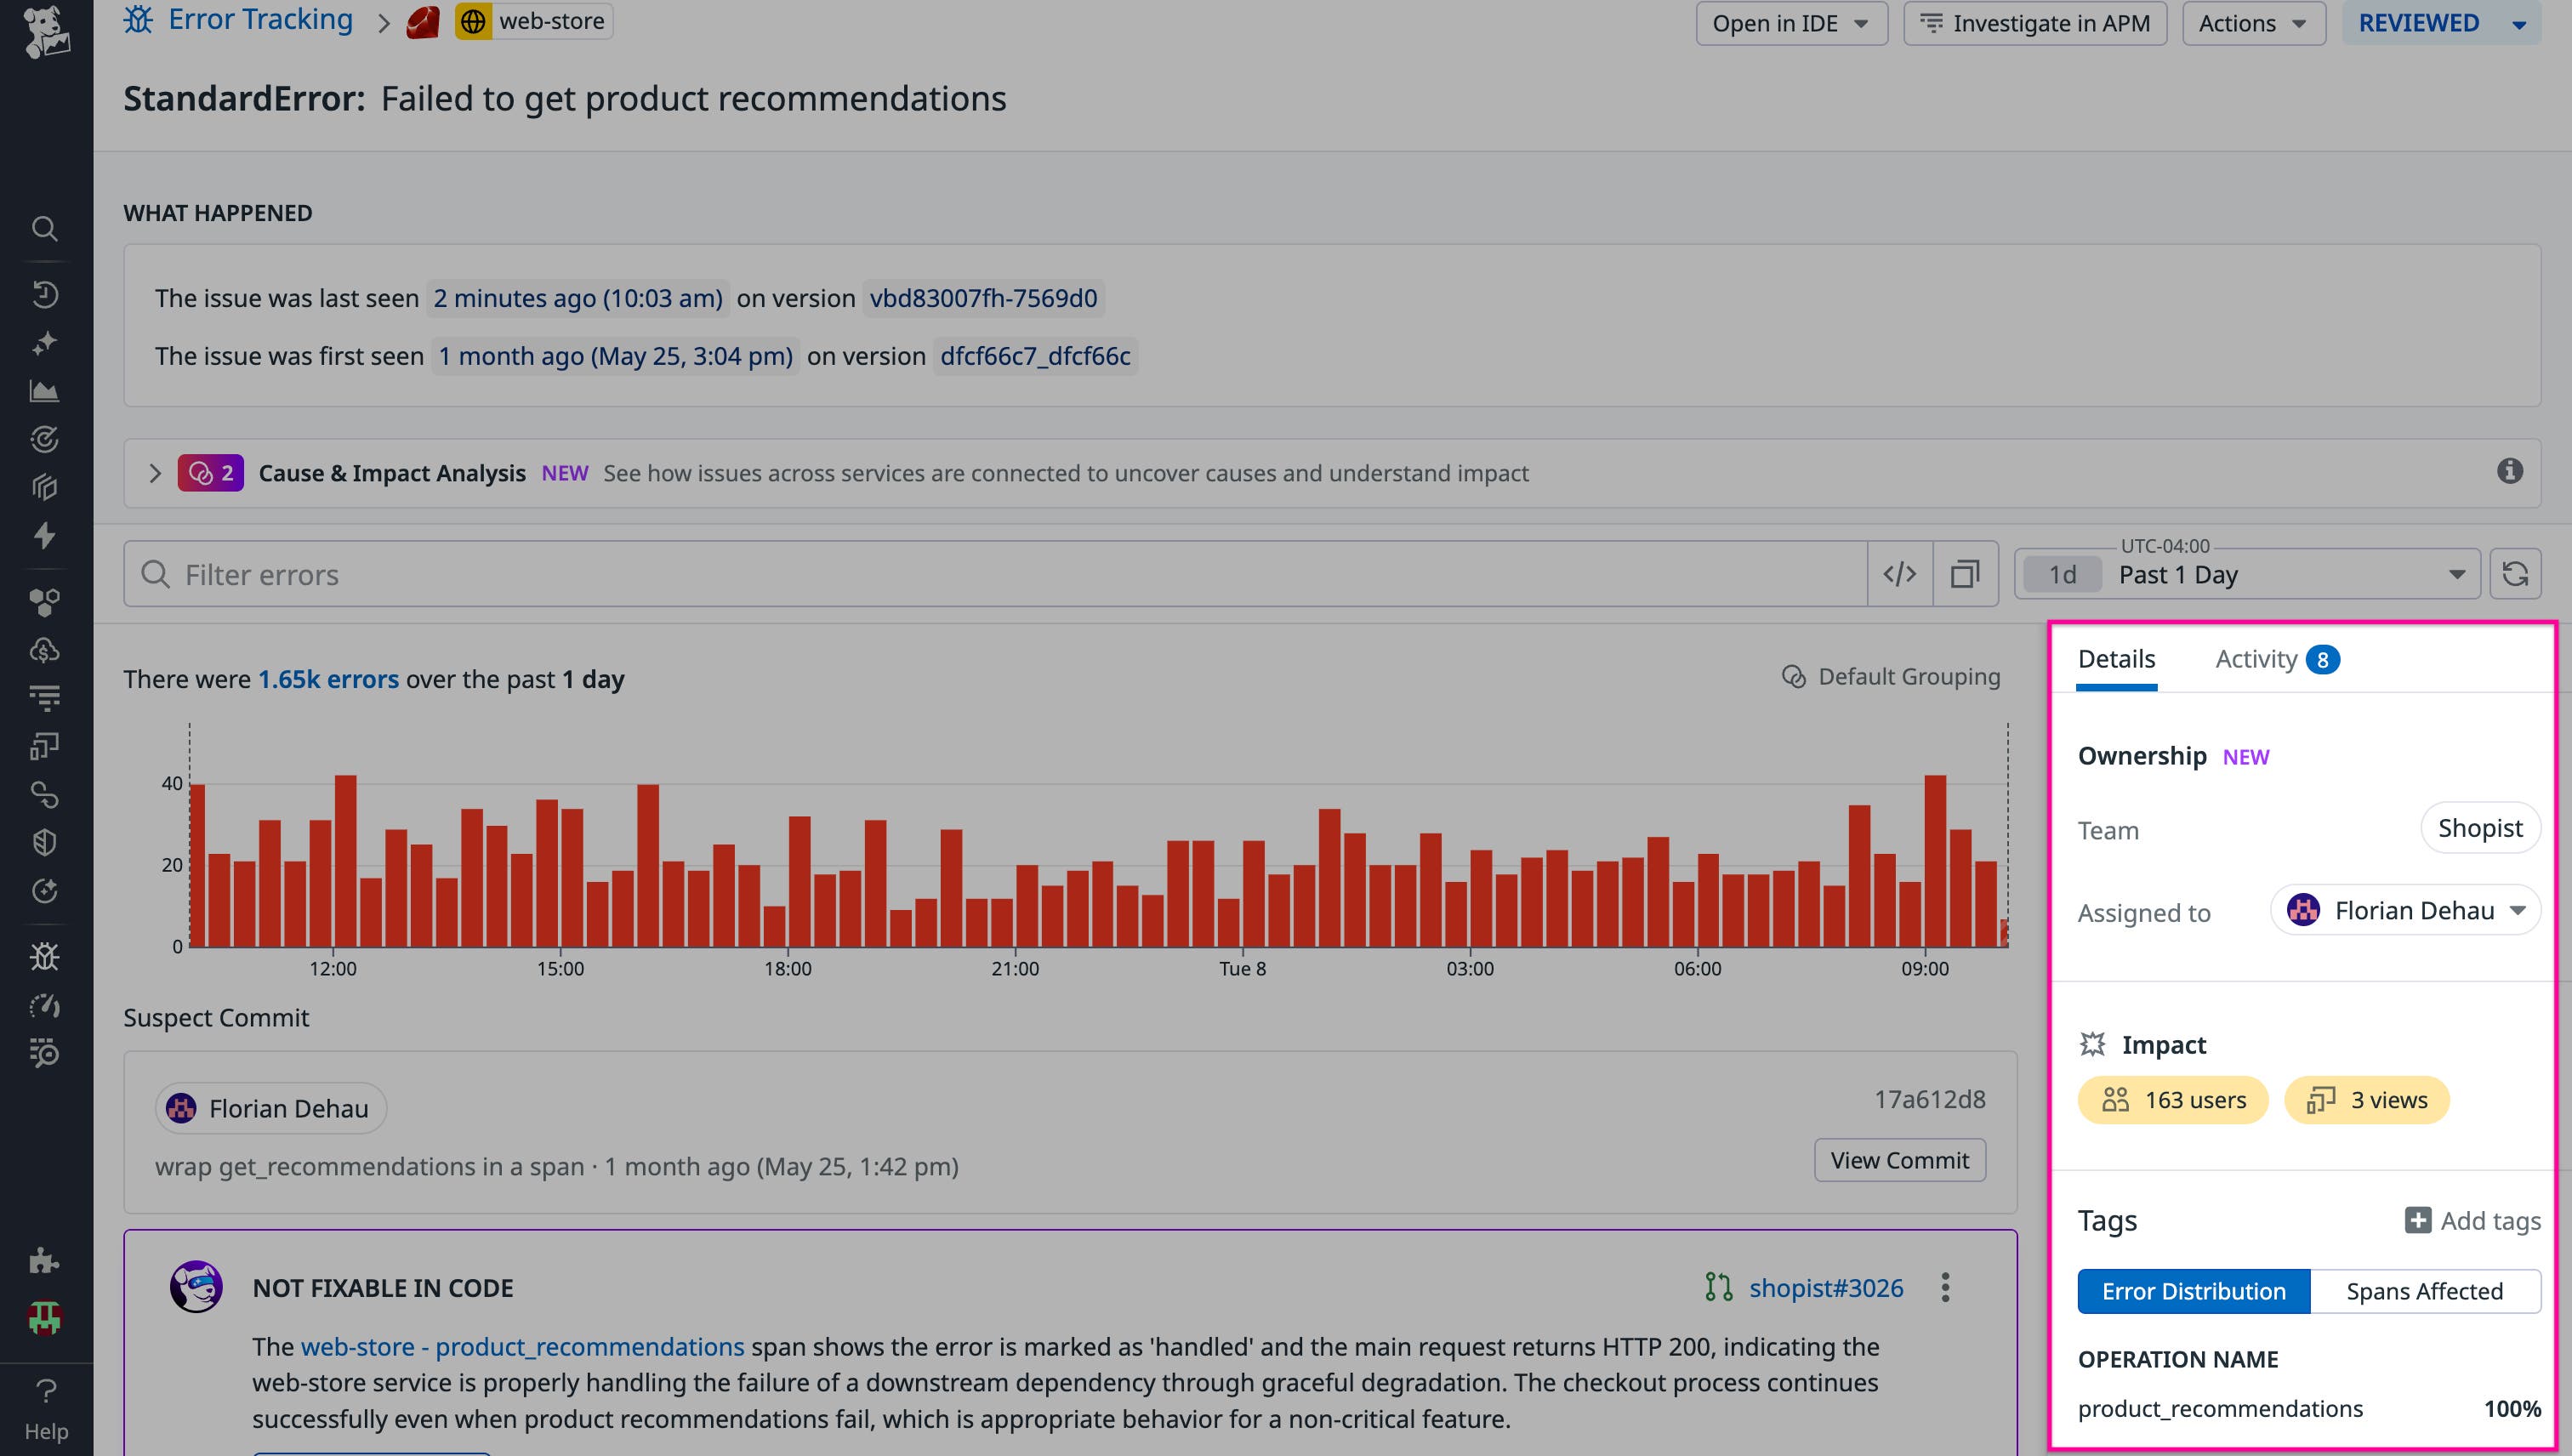
- Understand team ownership using GitHub CODEOWNERS
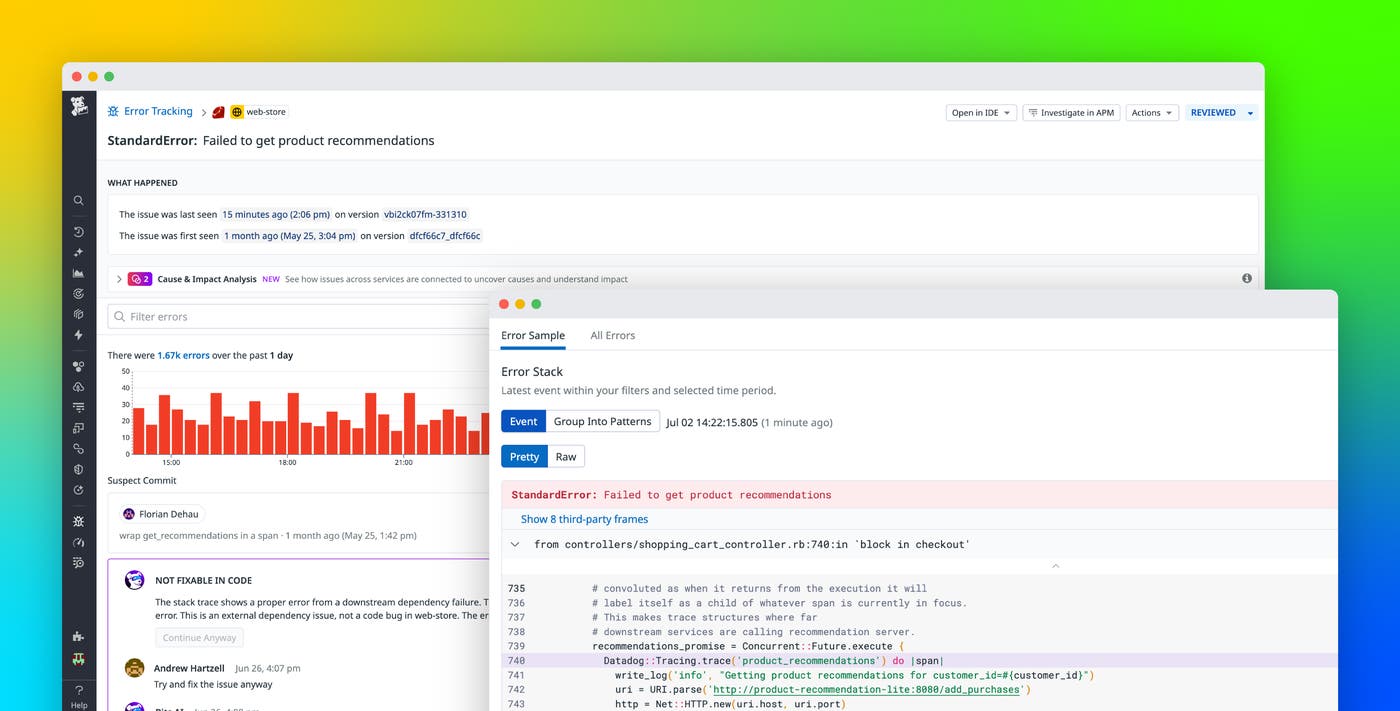
- Identify the likely root cause and automatically assign it with Suspect Commits
View code snippets in your stack traces to troubleshoot in context
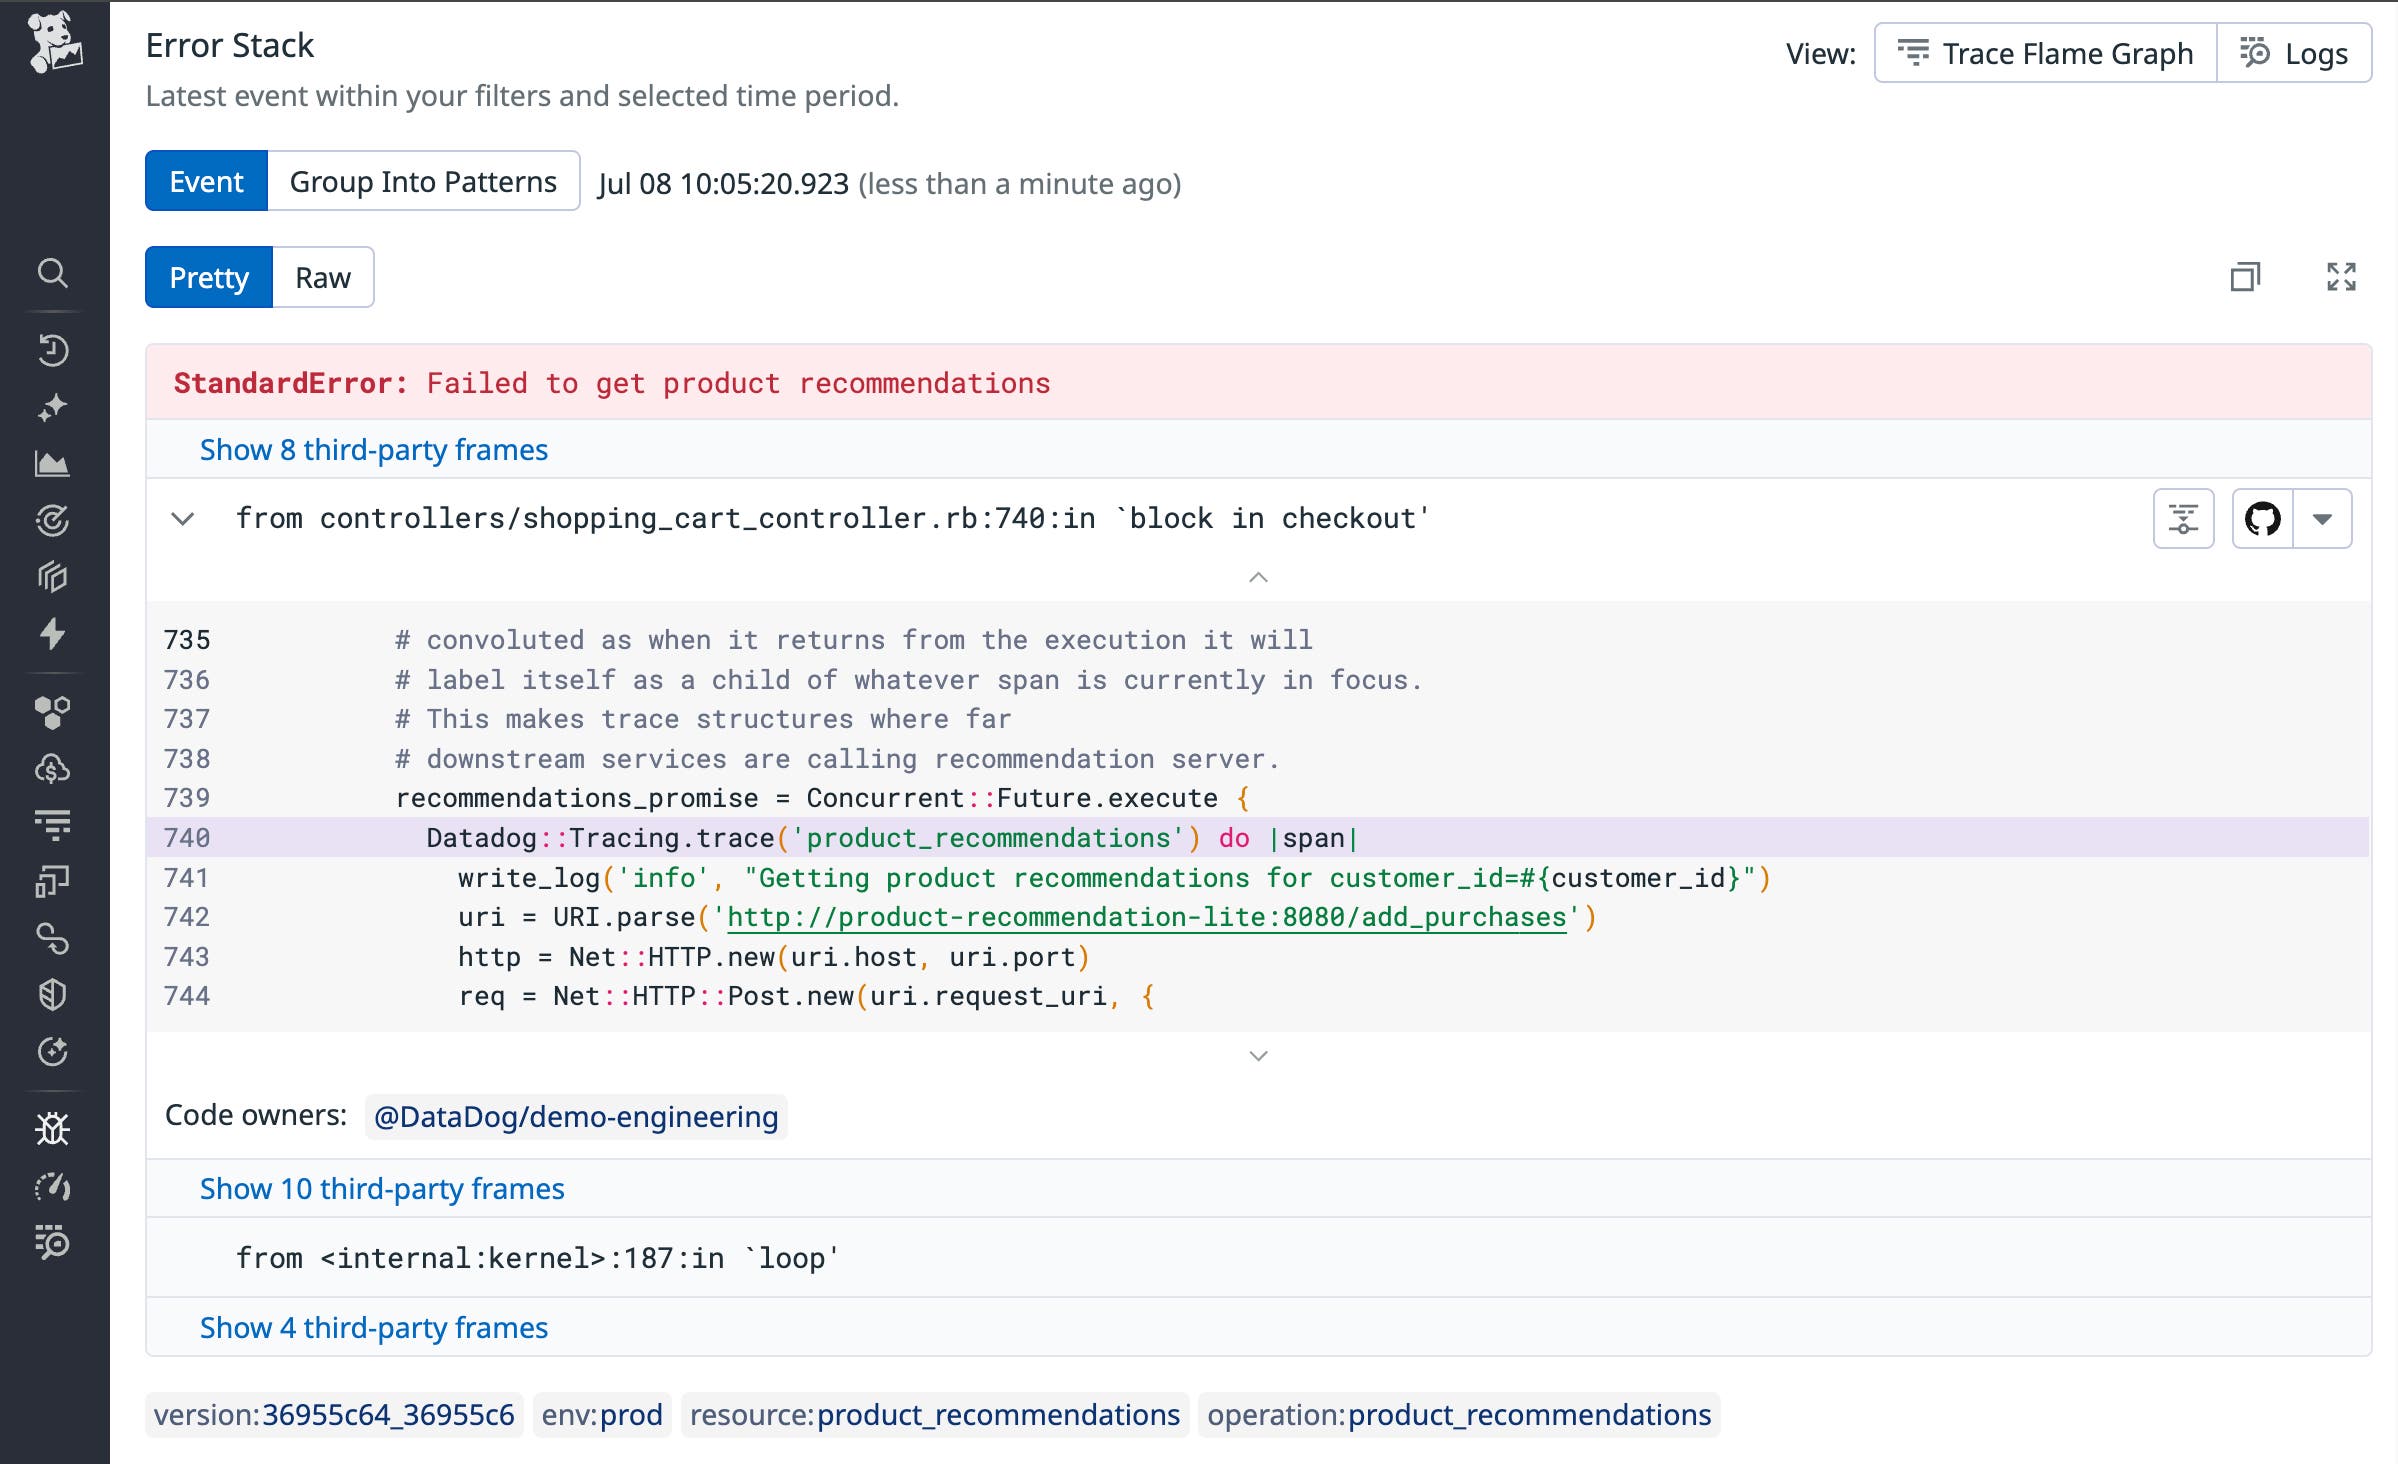
In most error tracking tools, developers get a stack trace but no visibility into the actual code. That means switching to your IDE, finding the right file, and guessing at what went wrong. With GitHub connected to Datadog Error Tracking, you can immediately see the exact line that threw the error, view nearby code, and jump directly to the source file to start debugging.

For example, say you get alerted to a spike in crashes from your order processing service. You click into the monitor and land directly on an Error Tracking issue. The stack trace points to a failure in the payment handler, and with GitHub connected, you can immediately see the exact line that threw the error and jump directly to the source file in your IDE to start debugging. Instead of digging through the codebase manually or guessing where to look, you’re already in the right place. This keeps you focused, reduces investigation time, and helps you fix issues faster.
Understand team ownership using GitHub CODEOWNERS
Once an error has been identified, the next step is understanding who owns the part of the code where it occurred. In large organizations with complex codebases, different teams are responsible for different parts of the system. But when ownership isn’t clearly defined, triage becomes slow and noisy and critical issues risk being overlooked.
GitHub supports a CODEOWNERS file, which lets you define ownership over specific files or directories in your repository. When integrated with Datadog Error Tracking, this file is used to display the team responsible for the code that triggered the error, providing clarity without manual guesswork.

For example, imagine you’re on the platform team responsible for your company’s order management APIs and your team owns everything under /api/orders—a set of endpoints that handle order creation and fulfillment. If an error is thrown from one of those files, Datadog will show your team as the owner based on the rules in your CODEOWNERS file.
But ownership isn’t just shown in the issue details; it’s used throughout Error Tracking to focus your experience. When you filter the dashboard or explore the issue list, Datadog highlights only the errors your team is responsible for. This makes it easier to prioritize what matters, route alerts effectively, and ensure the right teams stay accountable, all without leaving your Error Tracking workflow.
Identify the likely root cause and automatically assign it with Suspect Commits
When an error appears in production, finding the root cause can be slow and frustrating. Teams often resort to scanning commit histories, reviewing deployment timelines, or asking around for context, which especially delays triage in large or fast-moving codebases.
Suspect Commits help you skip the guesswork. By analyzing the error’s stack trace and recent Git activity, Datadog surfaces the commit most likely to have introduced the issue so you can start investigating immediately. If auto-assignment is enabled, Error Tracking also assigns the issue to the developer who authored that commit. This reduces handoffs, eliminates manual triage, and ensures the person most likely to have context is looped in from the start.

For example, let’s say a bug appears on Monday morning after a Friday deploy. It’s affecting your billing system, but no one is quite sure what changed. Instead of looking through dozens of commits, Datadog highlights a single line of code modified in the billing service and links directly to the commit and its author. What might have taken hours of digging now takes seconds and the issue is already in the right hands.
Behind the scenes, Error Tracking compares file paths in the stack trace with recently modified files and weighs commit timing to identify the most probable culprit. That commit is labeled as the Suspect Commit, and its author is surfaced in the issue details and, if configured, auto-assigned to the individual.
Get started using Error Tracking with GitHub today
Error Tracking with GitHub speeds up the entire debugging workflow for developers. From the moment an error appears, you can see the code in context, understand which team owns it, and automatically assign it to the developer who introduced the change.
By surfacing the exact line where an error occurred, identifying the likely root cause through Suspect Commits, and mapping ownership through GitHub CODEOWNERS, Datadog helps teams cut through the noise and take action faster.
To learn more about Error Tracking, check out our documentation. And you can try it out for yourself by signing up for a 14-day free trial.


