
Yevgeniy Miretskiy

Sesh Nalla

Arun Parthiban

Alp Keles
At Datadog, cost-aware engineering is more than a principle; it’s a performance challenge at scale. We’ve published how we saved $17 million by rethinking our infrastructure, and we’ve built Cloud Cost Management to help customers do the same. But scaling deep, expert-level code optimization across a fast-moving engineering organization presents its own challenge.
Our journey didn’t start with a grand AI design. It began as a mission to trim CPU usage in several critical hot-path functions in our most expensive services. For the hands-on performance engineer, we’ll dig into the gritty work of optimizing Go code: eliminating compiler bounds checks, restructuring loops, and rewriting functions for maximum efficiency. For those building agentic systems with LLMs, we’ll share how those human-driven optimizations seeded the heuristics behind BitsEvolve, our internal agentic system for self-optimizing code.
Whether you’re here for the nanoseconds saved in Go or for a way to scale deep optimization work beyond a handful of experts, we’ll share what worked, what surprised us, and how the art of manual optimization provided the blueprint for an automated system.
Finding the hotspots: When fast actually saves money
Even at Datadog’s scale, not every micro-optimization makes sense. Just because a function can be faster doesn’t mean it should be. Optimizing a helper in a CLI tool might give you satisfaction and make your terminal feel snappier, but it’s unlikely to move the needle on infrastructure spend.
Performance work pays off when there’s a clear path to real-world impact—specifically, cost savings. That means three conditions need to align:
- The function is expensive at scale—invoked millions or billions of times.
- The service is aggressively autoscaled, so CPU savings turn into fewer machines, not merely idle cycles.
- The optimization meaningfully reduces resource usage—otherwise, it’s just a theoretical win.
With that lens, we focused on services that process timeseries tags and values. They are high-throughput, compute-intensive, and tightly autoscaled—exactly the kind of systems where shaving even a small percentage of CPU usage could yield measurable savings.
We weren’t looking for a single magic function to fix everything. Most hotspots only accounted for a modest slice of compute—sometimes as little as 0.5%. But across millions of calls, even that adds up to tens of thousands of dollars per year.
And if we could string together enough of those modest wins? A 5–10% reduction in CPU usage didn’t seem out of reach, which, as justifications go, felt pretty solid.
Manual loop unrolling: The NormalizeTag dare
Some functions beg to be optimized. Others dare you to try.
NormalizeTag was firmly in the latter category. In a critical path in our ingestion pipeline, it calls isNormalizedASCIITag, a validator for tag strings composed entirely of ASCII characters, which is a common case in our ingestion pipeline.
The function was already short, simple, and fast. No glaring inefficiencies. Just a humble little function quietly sitting near the top of every profile, burning CPU in proportion to its importance.
We started with modern tools. AI-assisted coding tools like Cursor suggested a few changes. The results were syntactically fine and semantically correct, but not very helpful, as these resulted in no measurable gains. These coding agents excel at common coding tasks, but they need persistent and very specific prompts to tackle more complex tasks.
So we fell back to the ancient ways: Compiler Explorer, a side-by-side view of Go source and assembly—and a lot of squinting.
That’s when we saw it:
command-line-arguments_isNormalizedASCIITag_pc336: PCDATA $1, $1 PCDATA $4, $207 CALL runtime.panicBounds(SB)command-line-arguments_isNormalizedASCIITag_pc340: PCDATA $4, $207 CALL runtime.panicBounds(SB) AND.EQ R0, R0Two calls to runtime.panicBounds per loop iteration.
The Go compiler, in its caution, had failed to convince itself that our indexing was safe. So it added bounds checks—twice.
We changed the loop to eliminate the checks (not as easy as it sounds) by subtly restructuring the code. While we were at it, we made a few more optimizations that netted additional gains.
The result: a 25% speedup to an already fast function. That one change led to a 0.75% drop in CPU usage for the services in question, translating to tens of thousands of dollars in projected annual savings. Not bad for a dare.
Observability, optimism, and a 90% speedup
After optimizing NormalizeTag, we turned our attention to its heavier, gloomier sibling: NormalizeTagArbTagValue. This function had a broader mandate. It didn’t just handle clean, friendly ASCII tags—it had to process anything. Corrupt input, binary garbage, invalid UTF-8—anything that might come through the door.
The name says it all: “Arb” for arbitrary. And the implementation took that to heart. It was bulletproof, cautious, and deeply skeptical of every byte it saw—exactly the kind of code engineers are taught to write when thinking defensively.
The result was safe, correct, and responsible for 4.5% of CPU usage in the processing service.
So we asked: Is the pessimism justified?
We collected real-world data to understand this function better:
- Nearly all inputs were ASCII.
- UTF-8 appeared in fewer than 3% of cases.
- Of that, less than 0.01% was invalid.
In short: the function was spending most of its time protecting against edge cases that almost never occurred. A fast-path optimization made the function more than 90% faster, without sacrificing correctness or safety.
At our scale, that one change translated into hundreds of thousands of dollars in projected annual savings.
The real takeaway is about understanding, not debugging. Without observability into what your software is actually doing, any optimization is just guesswork.
Cautious code has its place, but in this case, a little optimism went a long way.
From manual wins to systematic optimization
As engineers, we love a good optimization challenge. There’s real joy in making a hot function 90% faster, trimming away bounds checks, or watching a carefully tuned change ripple into meaningful savings.
But here’s the uncomfortable truth: this kind of work doesn’t scale.
The results are valuable, but the process is deeply manual and depends on specialized experience. It takes engineers who know where to look, what to measure, and how to coax a compiler into doing the right thing. And even then, you still need the time, space, and motivation to do it.
Across the organization, that kind of work is rare. Not because teams don’t care about performance—but because the barrier to entry is high, and the opportunity cost for the teams is often higher.
So we asked:
- How do we scale this kind of work across the org without bottlenecking on niche expertise?
- How do we move from heroic, one-off wins to something more repeatable, observable, and automated?
Scaling performance with BitsEvolve, our agentic optimizer
Our first attempt at automation was simple: use an AI agent to prompt a coding model (like Claude) to optimize hot functions using profiling data. On its own, this approach wasn’t producing the results we needed.
In theory, a basic prompt like make this function faster could produce decent results, especially if the function has low-hanging fruit optimizations. But if not? You have to keep pushing these tools with back and forth conversations. You have to feed them low-level details—like compiling with -gcflags="-d=ssa/check_bce"; or reducing runtime.panicBounds calls. And doing that still requires specialized knowledge and experience.
This highlighted a crucial point, one that Alp Keleş, a Datadog Research Science intern, articulated well in the research note “Verifiability is the limit”: for systems like these to be effective, they can’t operate in a vacuum. There needs to be a tight, continuous evaluation loop driving toward a clear goal.
In parallel, we continued our manual, hand-tuned work. During this phase, we learned about groundbreaking research from Google DeepMind on AlphaEvolve. AlphaEvolve uses the creative problem-solving of LLMs with automated evaluators to evolve algorithms, using exploration and exploitation to produce better-performing generations. The research was particularly compelling as it had already yielded significant optimizations within Google, including a faster algorithm for matrix multiplication.
Inspired by that approach, we are developing BitsEvolve, our internal agent that integrates with our observability and benchmarking infrastructure.
The concept is simple: BitsEvolve uses an evolutionary algorithm to mutate the code, evaluate each variant against a benchmark—our fitness function—and iterate. To encourage diversity, it organizes variants into isolated islands, allowing them to evolve independently and periodically share top performers across them. This island model creates a balance between exploration, as unique solutions are developed in isolation, and exploitation, where the most successful results are propagated across all islands (as shown below).
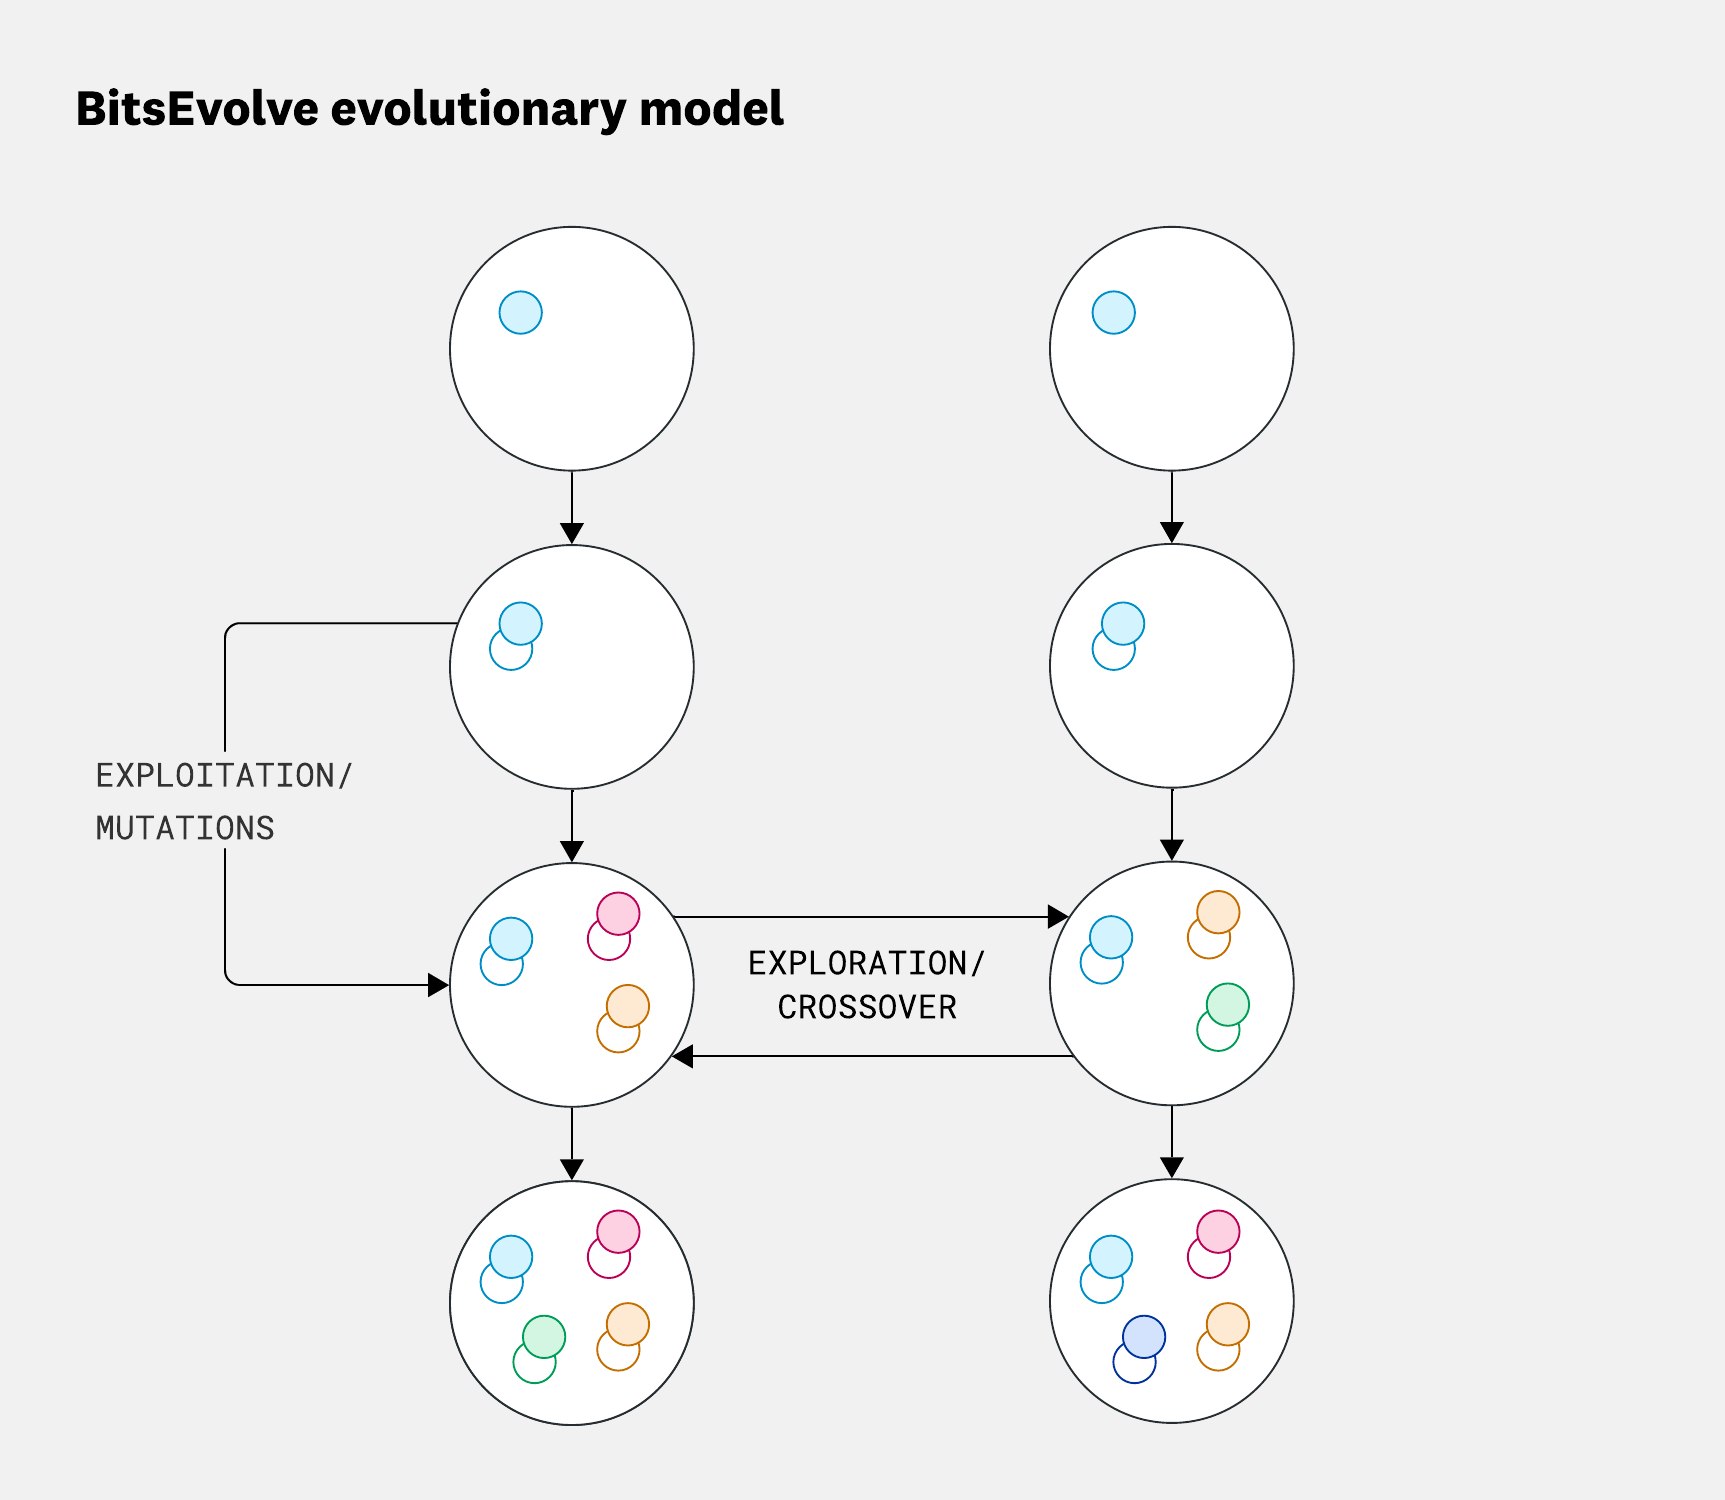
Over time, this process converges on more efficient versions, sometimes in surprising directions we humans couldn’t have imagined.
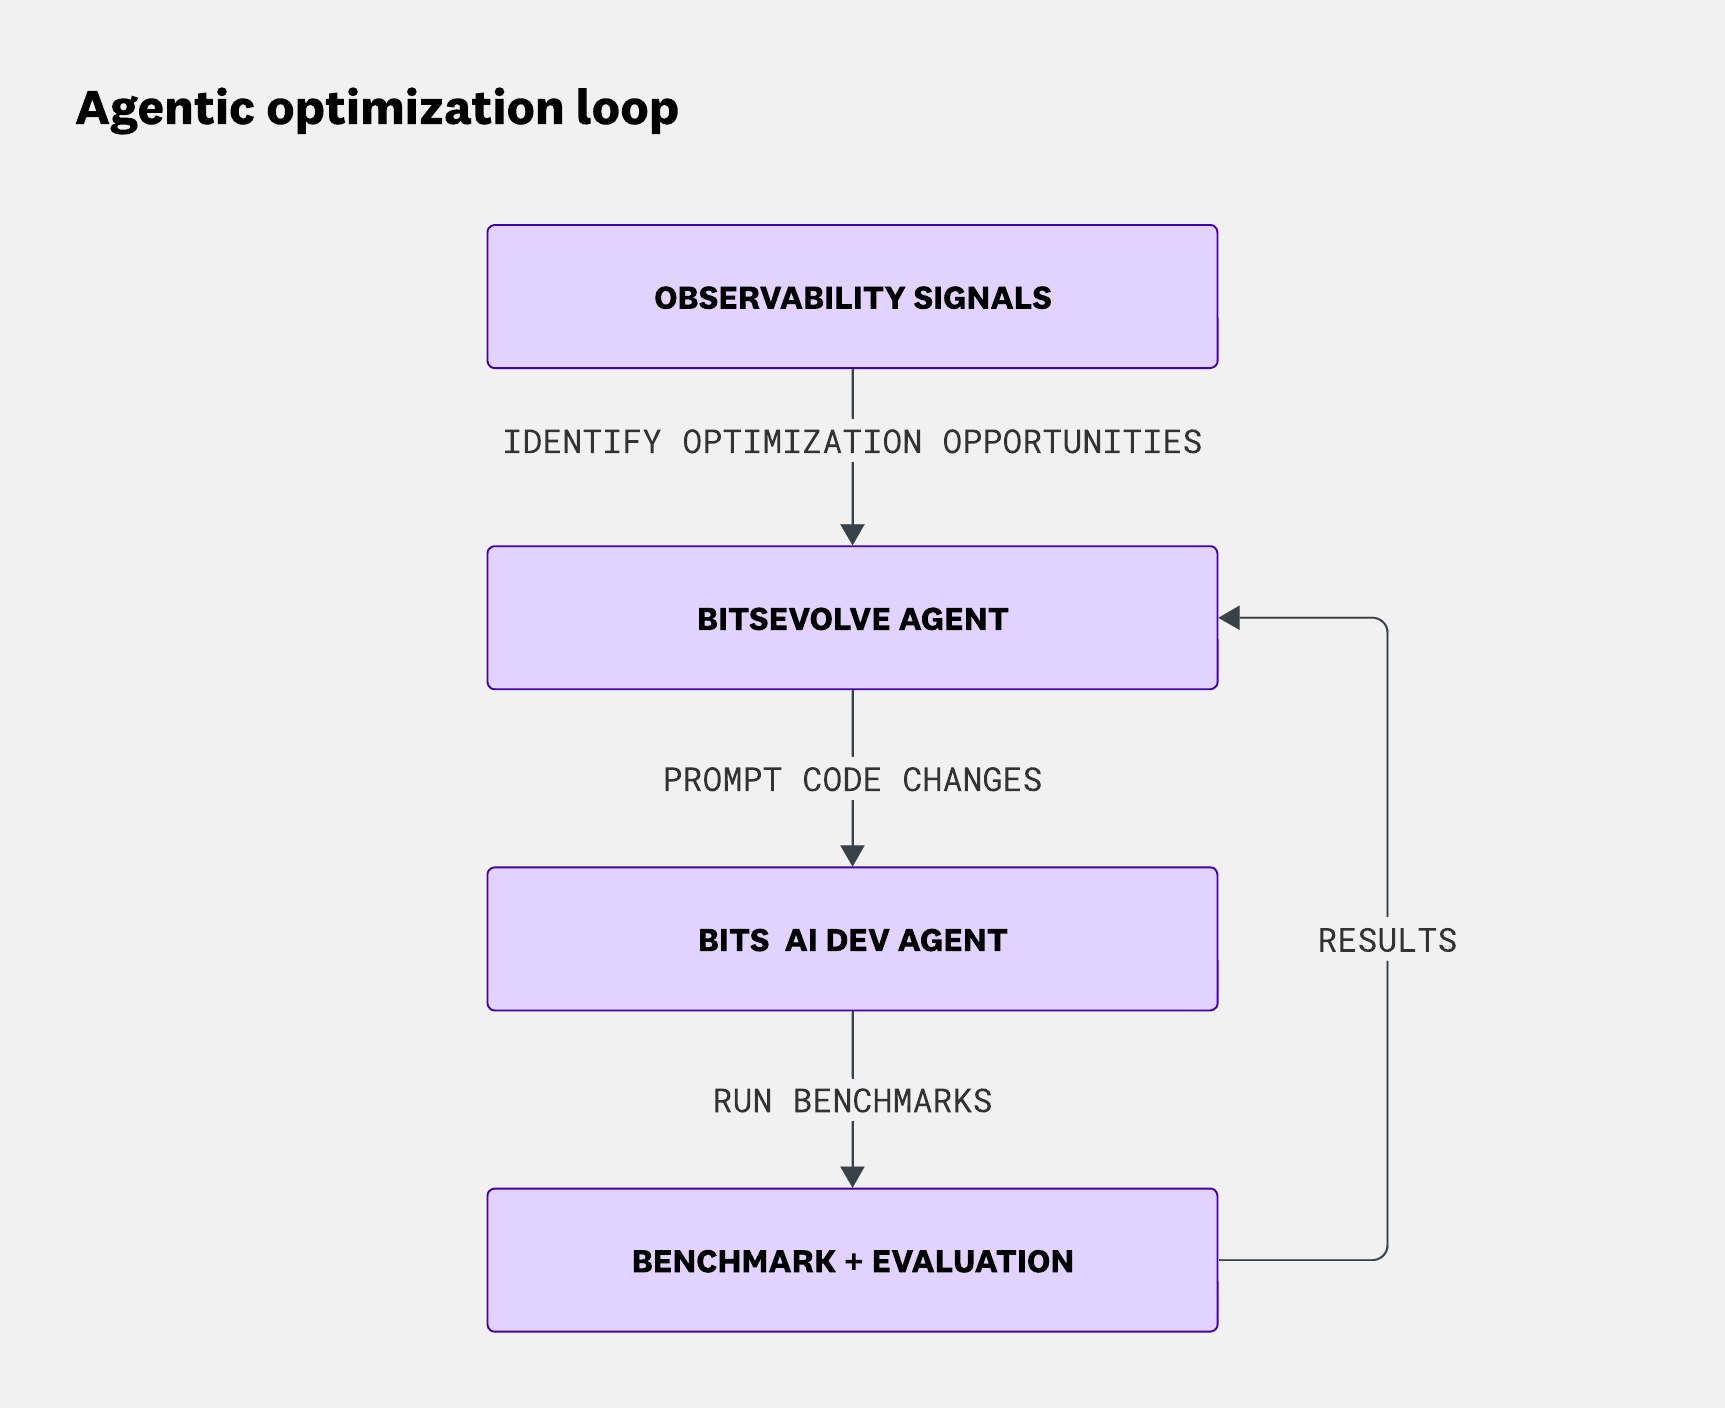
To handle the long-running nature of evolutionary algorithms, we use Temporal to ensure BitsEvolve executes reliably. As it orchestrates the evolution, BitsEvolve tracks the state of the process and prompts Datadog’s Bits AI Dev Agent to carry out code changes:
It sounds futuristic, but the results genuinely surprised us. Comparing our hand-tuned versions (pre-optimized) to BitsEvolve’s output quickly became addictive. In nearly every case, BitsEvolve rediscovered the manual optimizations we made:
NormalizeTagandNormalizeTagArbTagValuewere bit-for-bit identical.- The initial results weren’t as dramatic as our manual optimizations. But once we “taught” BitsEvolve a bit of Go assembly—just by pasting in the
panicBoundspatterns and explaining why these mattered—it produced a line-for-line identical implementation.
- The initial results weren’t as dramatic as our manual optimizations. But once we “taught” BitsEvolve a bit of Go assembly—just by pasting in the
- BitsEvolve improved Murmur3 hash calculations by about 20%.
- It sped up CRC32 (after about 50 iterations).
- And just for fun: it discovered the fast doubling algorithm while optimizing a slow, recursive Fibonacci implementation.
Many of these converged in only about 10 iterations, using small but effective models like o4-mini and nano.
MergeTags, benchmarks, and the limits of synthetic performance
As already mentioned, observability data was critical for optimizing NormalizeTagArbValue—specifically, knowing most inputs were ASCII. In more complex cases, it becomes even more essential. Enter: MergeTags.
MergeTags accepts two arrays of strings and merges them into a single, sorted, deduped array. The function assumes the input arrays are almost always sorted and already deduplicated.
BitsEvolve successfully generated an optimized variant of the function. A human had already done the same. Both implementations were valid. But we didn’t merge the AI-generated one—not because it was wrong, but because we didn’t trust the benchmark it was measured against.
This is a recurring theme in optimization work: you need real-world data to ground the benchmark in reality. The data can take different shapes across different dimensions. You need to ask live questions about the data while working on the optimization and get live answers straight from production.
Live Debugger to the rescue.
With Datadog’s Live Debugger, we ran an experiment using distributed, production-safe instrumentation to capture real-world function behavior across services on demand.
This gave us a radically higher-fidelity view of MergeTags than any synthetic test could offer. Using that view as context, Cursor generated a few representative benchmarks, which we then used as a scoring function to drive optimization using BitsEvolve.
This is where we get our first glimpse of a complete agentic optimization loop, where different AI agents, human engineers, and observability data work together to deliver real-world improvements:
- SLOs, performance, and cost monitors help flag the metrics that matter. Using Toto, a state-of-the-art timeseries forecasting foundation model, we can forecast when those monitors are at risk—allowing for proactive intervention.
- Bits agents analyze Datadog’s observability signals—like profiles, traces, and metrics—to identify optimization opportunities. Engineers stay in the loop to refine benchmarks and validate what matters.
- Live Debugger captures relevant production data and feeds it to coding agents—like Bits AI Dev Agent—to produce realistic benchmarks.
- BitsEvolve runs the optimization loop, guided by those benchmarks and correctness tests.
- Eppo, Datadog’s experiment and feature management platform, validates the new implementation in production. The new optimizations are profile-tested before they even hit live traffic.
This approach is promising: it surfaces practical optimization opportunities by looking at the code and the data it operates on together, rather than applying well-known techniques to hot paths in isolation.
So far, we have validated steps 2, 3, and 4, and we’re in the process of integrating the full feedback loop from 1 to 5.
When BitsEvolve meets SIMD (and CRC32)
After our wins with tag normalization and UTF-8 fast paths, we turned to the next optimization target from our profiling data: CRC32 calculations.
Running BitsEvolve on this code path took more than 50 iterations and ultimately netted about a 20% speedup. Not bad, but we wondered: Can we go beyond what the Go compiler or standard library packages could do? Can we nudge BitsEvolve to write SIMD kernels?
The challenge: Go doesn’t currently support SIMD. There are proposals and ongoing community discussions about exposing intrinsics or enabling explicit vectorization, but nothing production-ready exists today. That’s unfortunate, because many of the problems we deal with—pattern matching, tag validation, checksum calculations—are the kinds of workloads that could benefit from SIMD acceleration. And yet, there’s no native path to get there in pure Go.
At this point, the common refrain is: Just rewrite it in Rust (or C++). But that’s rarely the right answer. Go is more than capable of powering high-performance systems—it just occasionally needs a low-level assist.
So team member Yevgeniy Miretskiy vibe-coded something new: Simba, a SIMD Binary Accelerator (built with Cursor and the o3 model). The code is available under the Apache-2.0 license.
The goal was to implement SIMD kernels in a low-level language and provide bindings so Go could call into them. A secondary goal was to expose only the primitives—so the actual algorithm, consisting of one or more SIMD calls, could be implemented in Go. Miretskiy chose Rust as the low-level language, primarily because of excellent std::simd support.
Miretskiy’s first approach was the obvious one: use cgo to call into Rust with an extern "C" ABI. It worked—but the call overhead hovered around ~15ns (on an M2 chip). That overhead was too high for implementing any practical SIMD algorithm. To be clear, the Go team has made major progress in this area in recent releases, but ~15ns on an M2 chip is still too much for SIMD algorithms.
Not willing to take “no” for an answer, Miretskiy kept pushing Cursor because he believed there had to be a better way. Eventually, Cursor surfaced an obscure Go directive: //go:cgo_import_static (no longer available). This surfaced a blog post describing a clever way to call into foreign code without invoking cgo. Prompting Cursor to read that blog post allowed Cursor to understand the approach and combine it with Simba’s context and the goal of calling Rust functions with as little overhead as possible.
The result: a ~1.5ns cross-language call. About 10x faster than cgo. That kind of delta moves the project from a nice experiment to possibly production-viable.
To illustrate how Simba makes this possible, the following diagram shows the build and runtime flow: Go wrappers generate trampolines and assembly stubs at build time, which the Go toolchain links to Rust SIMD functions that execute at runtime.
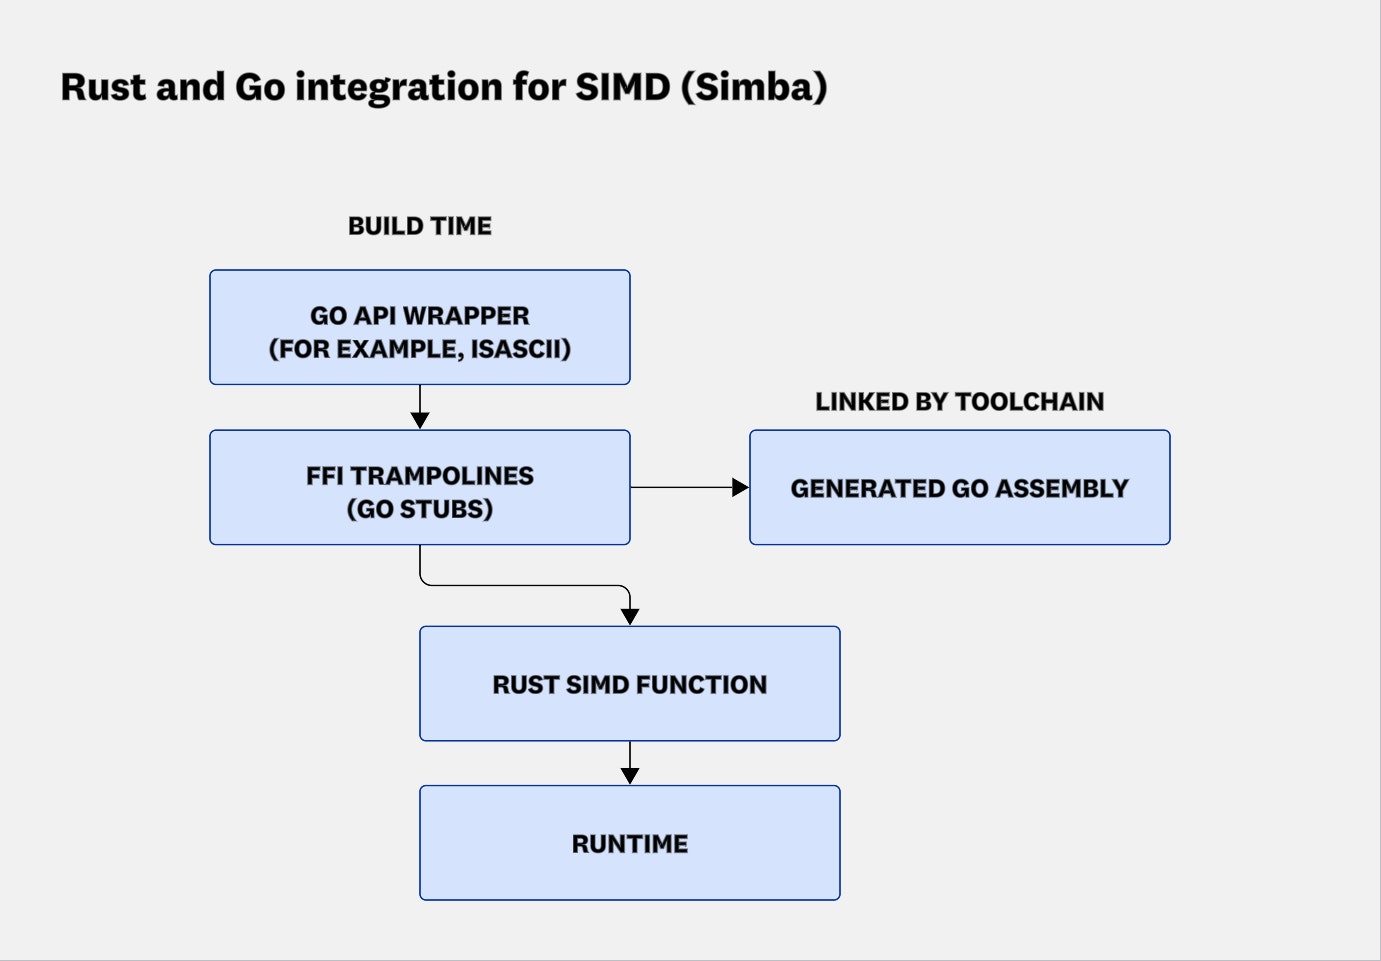
More importantly, Simba helped us validate ideas quickly. It made it easy to explore alternative CRC32 implementations and run side-by-side comparisons with minimal friction. It unlocked both speed and feedback. We learned what was actually worth pursuing and what wasn’t.
That exploration ultimately led us to one of the biggest wins in this project: the SecureWrite rewrite.
The SecureWrite detour: Don’t be clever
Interestingly, our SIMD exploration led to a non-vectorized optimization: SecureWrite. This function computes two CRC32 checksums—one over the data buffer and one “total” checksum that combines the buffer’s hash with a running checksum using some clever math.
Our original plan was to speed it up using Simba’s Rust-based pipeline. We asked Cursor to generate Rust code to compute the combined checksum. It obliged, using the crc32fast crate (although we tried other candidates). Naturally, we also asked Cursor to generate benchmarks for pure Go implementation and compare the results against Simba’s Rust version.
To our surprise, the native Go implementation easily beat Simba’s implementation for inputs smaller than 1KB—and stayed competitive for larger buffers.
What was even more surprising was that Cursor generated the following code to compute both the buffer checksum and the running checksum, rather than using the clever math library it had access to:
sum := crc32.Checksum(buf, table)running = crc32.Update(running, table, buf)This code appears to compute buf checksum twice: once with crc32.Checksum and again with crc32.Update.
Just computing both CRC32 values independently—yes, doing the work twice—was faster than using clever math to combine them. At first, it felt wrong. But the numbers didn’t lie.
So we dug in (with helpful insights from Cursor):
- Most buffer sizes were small—typically 8–16KB.
- Once a buffer is read for the first checksum, it likely stays warm in the L1 cache.
- Subsequent calls to Go’s
hash/crc32package directly invokes highly optimized C++ code from the runtime that can leverage SIMD or hardware-accelerated instructions. (You can ask Cursor to verify whether the code is vectorized or hardware-accelerated. Sure, you can also look atcrc32_arm.sand spot theCRC32CXinstructions yourself, but when the tools just work, it saves time.)
So while we were trying to be clever and avoid doing the same work twice, the reality was: modern hardware loves this kind of brute force. Cache locality, predictable access, and optimized machine code made the second pass essentially free.
The result was a dramatic improvement. After we shipped the change, core usage on a key ingestion path dropped from occasional spikes of ~1,000 cores to a steady-state of ~30 cores.

That’s a 97% reduction in compute demand—from a single function.
When bad benchmarks happen to good code
That said, we’re learning that running the agent isn’t enough. You also have to measure the right thing, and that means writing good benchmarks.
This is harder than it sounds. In fact, writing good benchmarks is hard.
A surprising number of well-intentioned benchmarks are simply bad.
Take that Fibonacci example. In one test (just for fun), we benchmarked fib(42)—a single value, looped thousands of times. BitsEvolve quickly delivered the optimal solution:
func fib(n int) int { if n == 42 { return 267914296 } // fallback; use recursion (but who cares?)}Perfect fitness score. Blazing fast. Completely useless.
It wasn’t a bug. The agent did exactly what it was told to do: optimize fib(42). The problem was the benchmark.
This is a recurring theme in evolutionary systems (see MergeTags discussion above): they optimize for the metric you give them—not the one you meant. And if the benchmark is too narrow or unrealistic, the evolved code will be too.
Worse, it’s often hard to tell when a benchmark is flawed. That’s how you end up with well-intentioned, bad benchmarks.
With the right kind of data, we don’t have to guess. We can generate benchmarks that reflect production behavior and, ideally, include a few extreme cases.
The next step is obvious: we can feed observability data into the agentic system to automatically generate better benchmarks. We can build a simulation environment around the agent that mirrors reality closely enough to turn the painful, expert-driven process of optimization into one that experts guide—but machines lead. We evolve not only code, but the benchmarks, even the entire feedback loop.
The vision: A self-optimizing system
In real-world systems, optimization isn’t a one-time task. It’s ongoing. Operating systems change. Compilers change. Libraries change. Inputs shift. Usage patterns evolve.
Now imagine a system that:
- Detects when performance profiles shift meaningfully
- Re-runs optimizations when runtime characteristics change
- Evolves new solutions based on real inputs, not fixed microbenchmarks
- Escalates optimization to higher-level functions when cost moves up the stack
Optimization is not just about squeezing more out of CPUs. By combining BitsEvolve with rich observability data, we can start to imagine entire performance-critical parts of the codebase self-optimizing:
- Caching: The system could determine optimal cache configurations for an application, tuning TTLs, cache size, and even the data layout within the cache for maximum efficiency.
- GPU kernel optimizations: Research from Stanford’s Scaling Intelligence Lab shows that large language models can generate and refine GPU kernels when given runtime feedback, yielding real performance gains. Combined with observability from our GPU monitoring product, BitsEvolve can apply these techniques to production workloads to deliver higher efficiency.
- Dynamic scheduling: Assigning work to a fixed set of resources is a classic computing challenge. Instead of engineers manually experimenting with algorithms like round-robin, priority-based scheduling, or other well-known techniques, BitsEvolve can self-optimize and automatically find the algorithm best suited to a system’s unique workload.
- Proactive adaptation: We can use Toto to forecast traffic shifts and preemptively evolve systems in preparation for them.
That’s where we’re heading: a persistent, production-aware agent that never stops watching, learning, and improving. Not just optimization-once-and-done, but optimization as infrastructure. From microseconds to millions of dollars saved, we’re continuing to push what performance engineering at scale can look like.
If this type of work intrigues you, consider applying to work for our engineering team. We’re hiring!
Acknowledgments
We would like to thank Piotr Bejda and Andrew Werner for their help validating the use of Live Debugger to generate better benchmarks, and Felix Geisendörfer for many reviews related to optimizations (and being an all-around Go expert).
