Kai Zong Khor

William Yu
Many Datadog products offer a live view of their telemetry, allowing you to access your data in near real time from across your infrastructure. Live views improve responsiveness, but they also introduce strict requirements on data ingestion latency and scalability, as the systems backing the live view need to be able to handle large volumes of data in real time. At Datadog, we encountered these challenges as usage of our Processes and Containers products grew. Our system needed to be able to handle millions of incoming processes per second while still serving live data updates to users actively viewing the page.
In this post, we’ll discuss the challenges we encountered scaling our real-time data pipeline for processes and containers. We’ll explain how we significantly improved the efficiency of this system to keep up with growing usage—reducing real-time traffic volume by 100x, slashing infrastructure costs by 98%, lowering the Datadog Agent’s resource utilization, and improving the user experience—all at the same time.
How real-time process and container data collection worked
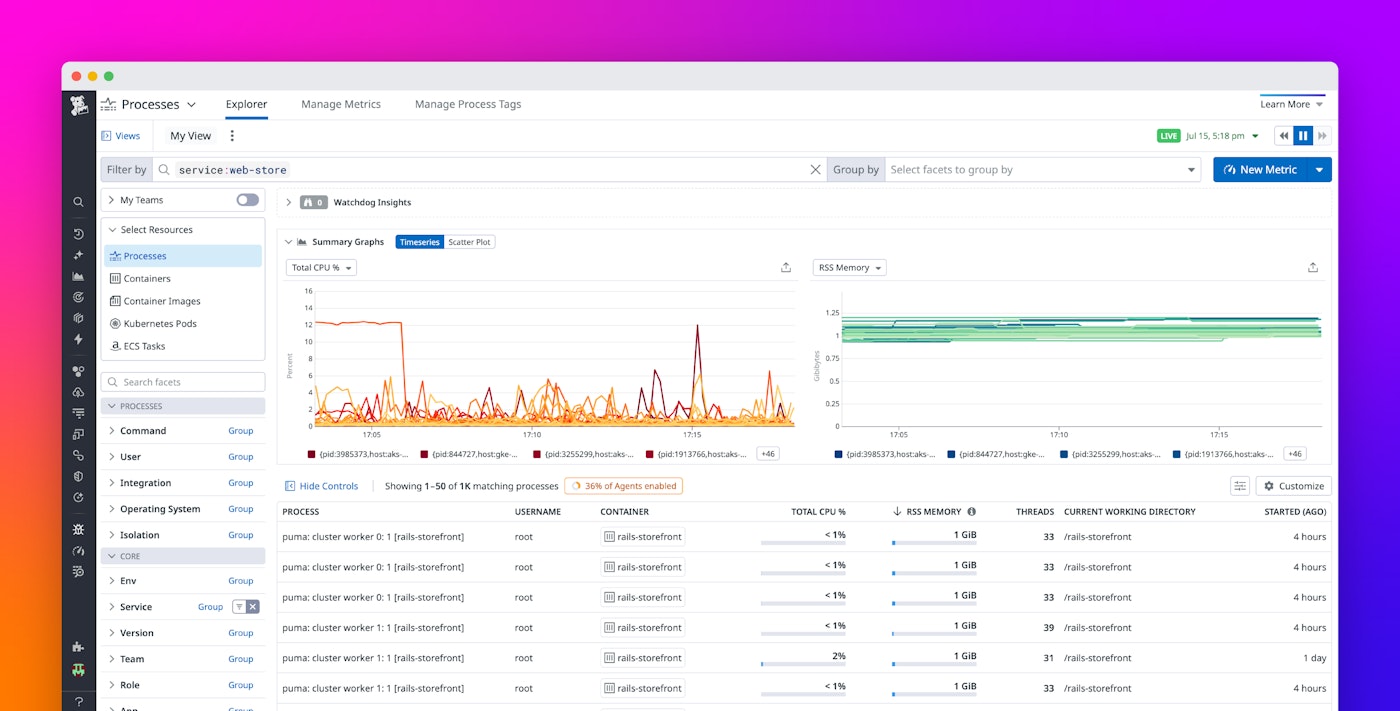
In the Datadog Processes and Containers products, resource metrics such as CPU and memory utilization are typically collected at 10-second intervals. However, when a user is viewing these pages in their live mode, real-time data collection is activated, and metrics are updated at 2-second intervals. This feature is inspired by Linux tools like htop, which support real-time process monitoring on a single host—whereas Datadog’s Processes product provides visibility for every process across a tenant’s distributed infrastructure.
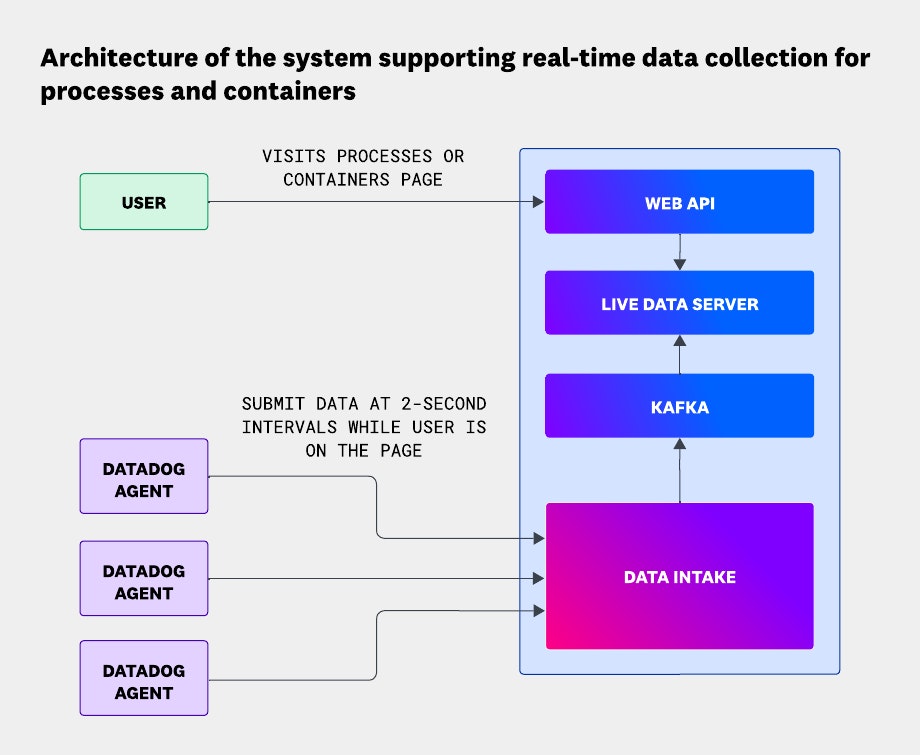
This real-time data collection functionality is provided by the Datadog Agent and its interaction with Datadog’s backend systems. By default, the Agent collects process and container metrics every 10 seconds and submits the data to Datadog’s backend systems. However, when the real-time data pipeline detects that a user from a given tenant is viewing the Processes or Containers page, Datadog Agents for that tenant receive a signal to activate real-time data collection and begin collecting metrics every 2 seconds. This continues as long as a user is actively viewing the Processes and Containers page, but to avoid collecting high-frequency data indefinitely, live data collection is disabled after a period of inactivity.
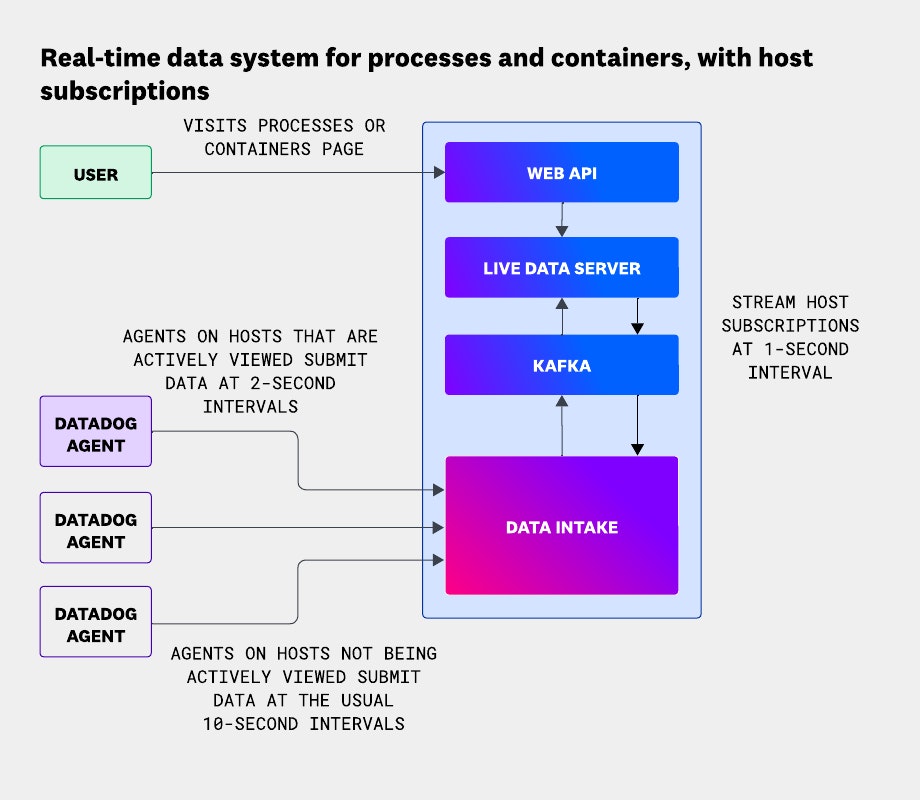
The following diagram depicts the architecture of the system supporting real-time data collection for processes and containers:
While this system worked well for our initial launch, its scalability limits became clear as usage grew over the years. Because live data was collected and submitted from all hosts in a tenant’s infrastructure whenever a user viewed the Processes or Containers page, the volume of data in our real-time pipeline scaled with the total number of processes across that tenant—easily reaching millions of processes every second.
Our system also supported sorting processes and containers based on live metrics stored in memory, with resorting done every 10 seconds. This made the sorting experience in the Processes and Containers pages highly responsive, since it relied on the most recent data. But it also meant we had to keep all of a tenant’s data in memory in a single live data server, which made horizontally scaling impossible. We initially worked around this by vertically scaling our servers—but this had its limits, and we knew we’d eventually need to explore a more fundamental system architectural change.
Refocusing on user-visible data
We began by re-examining some of the early architectural decisions behind the real-time data pipeline. The system had been built on the assumption that live data collection should be enabled for all hosts in a tenant’s infrastructure whenever a user visits the Processes and Containers pages. But in practice, users typically see only about 50 processes or containers at a time—meaning most of the collected data wasn’t actually used. So real-time data collection needed to be enabled for only the hosts running the processes or containers currently in view—at most, 50 hosts per user. Based on our internal telemetry, we expected this change could reduce traffic by more than 100x, averaged across all tenants.
Although this solution was promising, it introduced new challenges. First, we needed a way to track which hosts users were actively viewing and to update that set in real time as they navigated the Processes and Containers pages so we could dynamically enable or disable live data collection. We also had to rethink how sorting would work: Because our goal was to reduce live data volume, relying on metrics collected every 2 seconds would no longer be viable and could lead to inaccurate results.
With some additional investigation, we recognized that since sorting only happened every 10 seconds, we did not need to rely on live metrics collected at 2-second intervals. Instead, we could use the standard 10-second data we were already collecting. In fact, that’s what we already used for sorting in historical views, where live metrics aren’t available. Updating the live view to use this same non-live data would not only eliminate the need for high-frequency metrics for sorting—it would also simplify our system by removing the need to maintain different sorting logic for live and historical data.
Solving technical challenges and prototyping the solution
With this approach in mind, we started building a proof of concept. Our goal was to confirm not only that collecting live metrics from actively viewed hosts would work correctly, but also that it would deliver the expected performance gains. First, we updated the Processes and Containers pages to sort using the 10-second interval data, even in live mode. Then, we introduced the concept of a host subscription—tracking which hosts were actively being viewed—in our live data servers.
With these host subscriptions, our live data servers could filter incoming payloads from Kafka and discard any that did not correspond to an active subscription. This optimization delivered immediate results: Memory usage on our live data servers dropped by 85% and CPU usage decreased by 33%, as shown in the following screenshots:
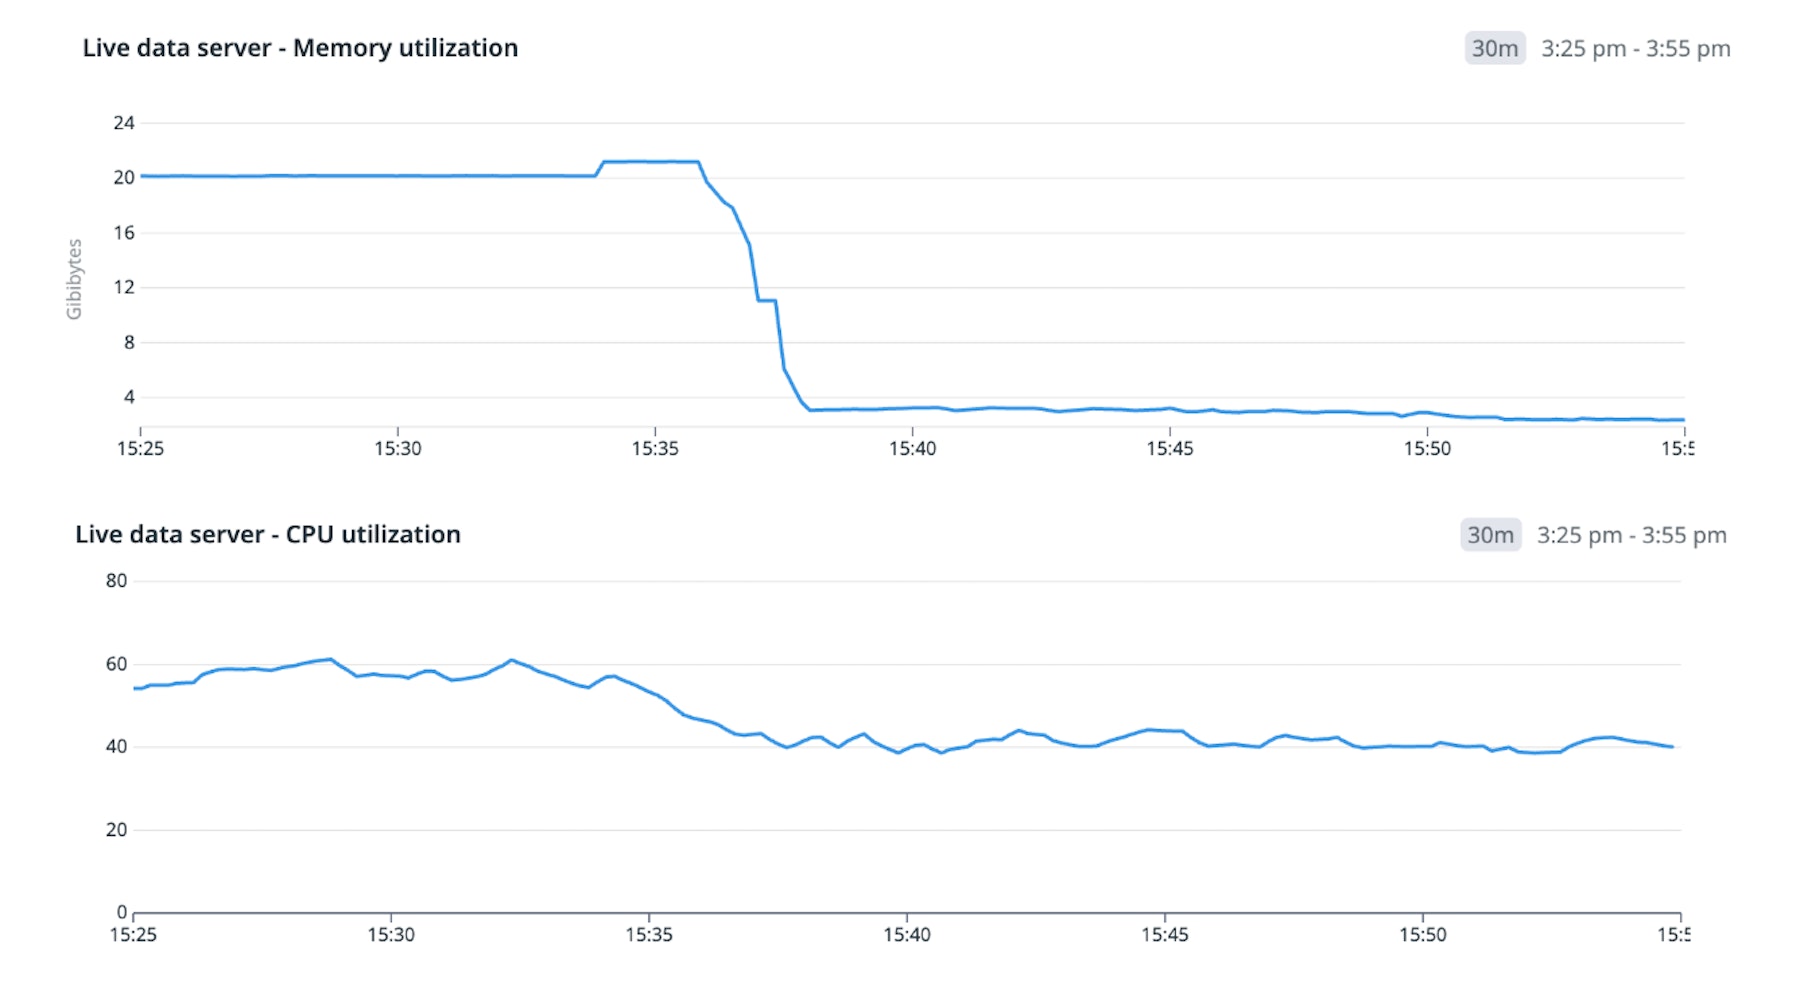
The drop in memory usage came from no longer storing live metrics for sorting, while the CPU savings were a result of processing fewer payloads—thanks to filtering based on host subscriptions.
The proof of concept confirmed that our approach worked: Filtering based on host subscriptions delivered performance gains and remained functionally correct—especially when combined with sorting via non-live data. But because this filtering was applied late in the real-time pipeline, we saw an opportunity to extend those benefits across our system, including the Datadog Agents running in customer environments. To do that, we’d need to move host subscription filtering as early as possible—starting at intake. That became the focus of our next phase.
Activating real-time mode only for hosts in view
After confirming that host subscription filtering on our live data servers didn’t affect product behavior, the next step was to enable real-time mode only for hosts that were actively being viewed—up to 50 per user per tenant. This effectively let users run htop on 50 hosts at once, with 2-second metric granularity. To achieve this, we needed to propagate host subscription state to our intake service. To keep the system decoupled and fault-tolerant, we shared subscription data over Kafka.
The live data server publishes the set of hosts a user is actively viewing, emitting data at 1-second intervals. This allows the intake service to make real-time decisions about which hosts to activate for 2-second process and container metric collection, ensuring a responsive experience for users investigating workloads across their infrastructure. The intake service consumes from the host subscriptions Kafka topic and maintains an in-memory cache of currently viewed hosts, as shown in the following diagram. Each cache entry has a time to live (TTL), so hosts expire automatically—without requiring explicit deletion events from the publisher. This design accounts for cases where the publishing service doesn’t shut down cleanly.
Impact on throughput and resource utilization
Live data volume varies widely across tenants, depending on the scale of their infrastructure and usage patterns—which can lead to sharp traffic spikes. Before this work, average data volume ranged from 50,000 to 500,000 messages per second. This 10x difference between the peaks and troughs forced us to provision significant reserve capacity in our live data servers to absorb traffic bursts without impacting user latency.
After enabling host-specific live mode, we saw a significant drop in peak volume–from 500,000 to just 5,000 messages per second. That’s an approximate 100x reduction in data that no longer needed to be generated by the Agent or ingested by our backend. It also improved the user experience, since real-time ingestion was no longer vulnerable to large traffic spikes.

With the reduced data volume, we no longer needed to maintain reserve capacity for peak traffic and were able to scale down our live data service by approximately 98%—freeing up more than 600 cores and over 1 TiB of memory.

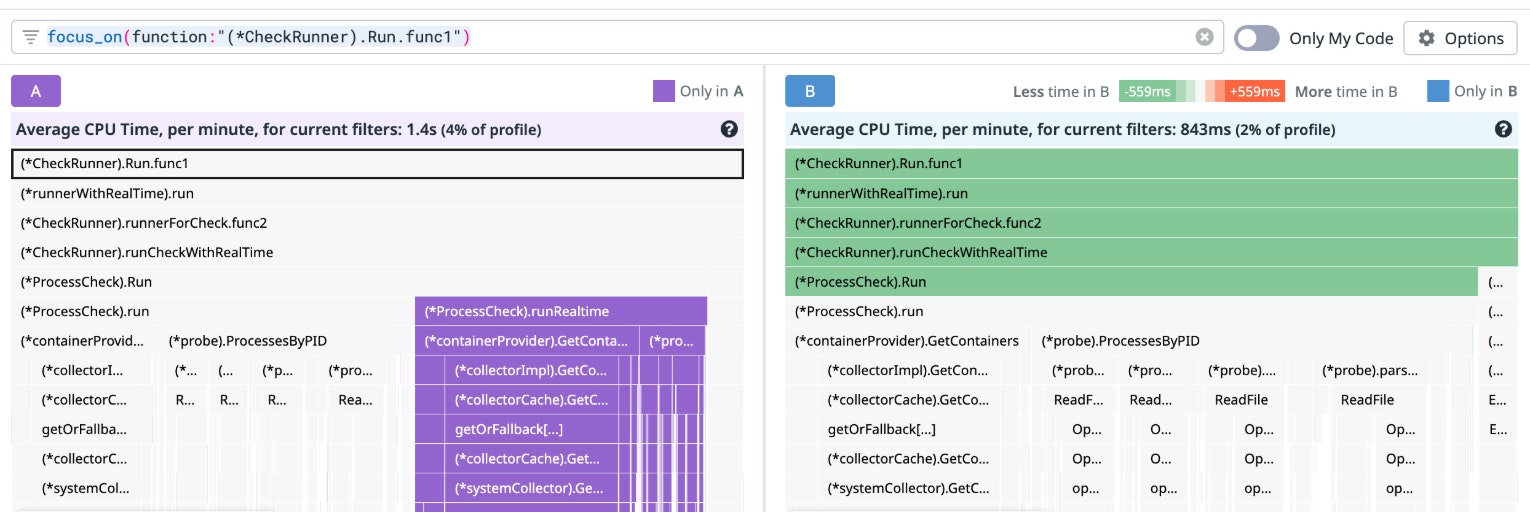
Finally, we saw improvements in our internal environments, where the Datadog Agent’s overall CPU usage dropped by about 2%. This was due to selectively enabling real-time process data collection on only a subset of infrastructure. We expect similar efficiency gains for Agents running in customer environments, though actual savings may vary based on fleet size and workload distribution. This outcome supports our ongoing goal of minimizing the Agent’s resource footprint without compromising functionality.
Lessons learned
The challenge of scaling our real-time data pipeline for processes and containers pushed us to rethink early architectural decisions and focus on what truly mattered to users. By shifting from tenant-wide data collection to targeted host-level collection, we reduced traffic by 100x, improved the efficiency of our internal systems and the Datadog Agent, achieved substantial cost savings, and enhanced the user experience. This work reinforced the value of designing systems that scale with user needs—not just with raw data volume.
At Datadog, engineers are encouraged to challenge assumptions, validate constraints, and iterate based on measurable system behavior. We started with a hypothesis and validated it incrementally through targeted rollouts and detailed instrumentation. At each stage, we tracked CPU utilization and end-to-end latency across both Agent and backend components to measure performance impact. Each optimization reduced overhead without introducing regressions.
If this type of work intrigues you, consider applying to work for our engineering team. We’re hiring!
