Charly Fontaine

Cedric Lamoriniere

Ahmed Mezghani
We contributed to the kube-state-metrics, a popular open source Kubernetes service that listens to the Kubernetes API server and generates metrics about the state of the objects. It focuses on monitoring the health of deployments, nodes, pods etc. Kubernetes State Metrics is one of our favorite tools here at Datadog, and it powers several of our products (for example, Kubernetes metrics integration, and Orchestrator Explorer). We really appreciate KSM and use it extensively, but we were having challenges scaling it to the level we needed - we found that a large amount of data was being dumped at query time and also that the Builder did not allow a way to hook into the metric generation. We highly value our synergies with the upstream community to improve it or add new features, so we decided that instead of fixing it only for ourselves, we would contribute our discoveries back. Along the way, we discovered that contributing back to the open source community turned out to be the key to us scaling our internal Kubernetes infrastructure.
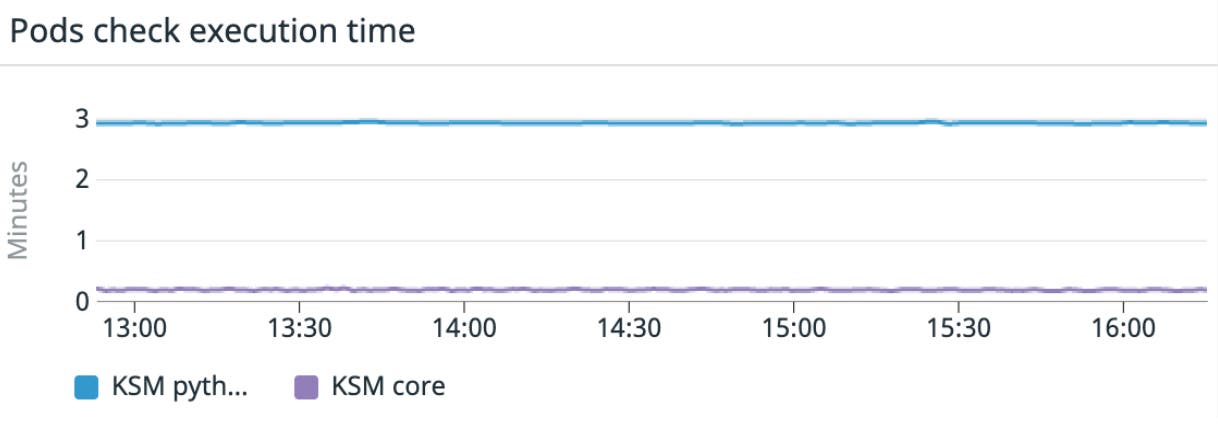
In a nutshell, our results were staggering. We improved the metrics collection process duration by 15x:
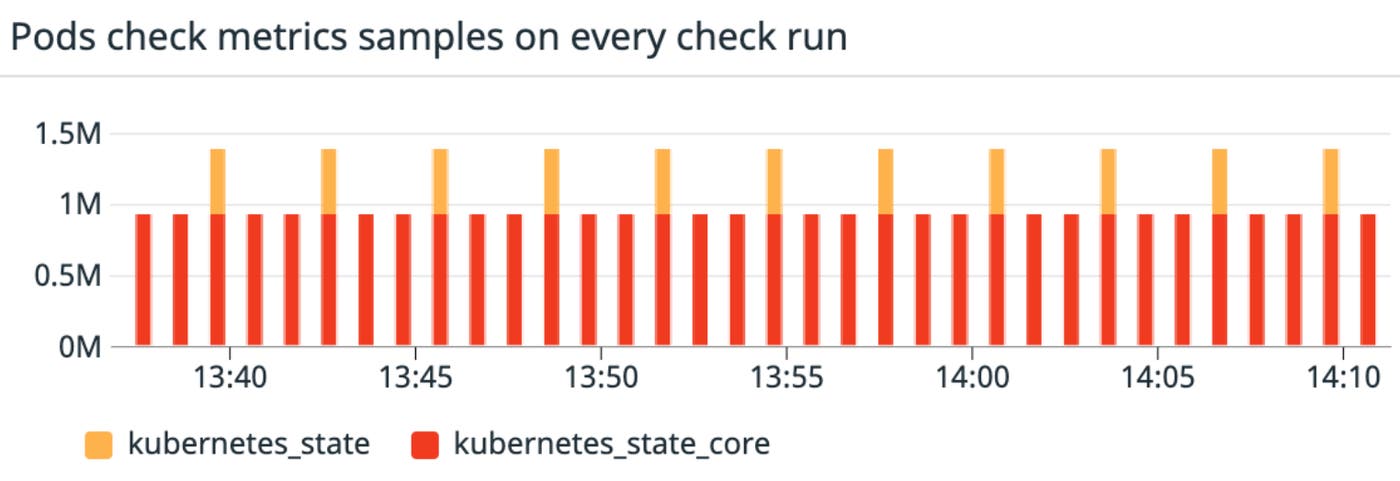
which allowed us to get much more granular data at high scale:
Read on to see how we did it.
Who are we?
The Datadog Containers team is in charge of observability of our Kubernetes environments. We ensure that other Datadogs and customers monitoring their services with our featureset get insight into how their infrastructure and apps are behaving. We also make sure that any log, trace, custom metric, code profile, and security signal is reliably collected.
What is Kubernetes State Metrics?
Kubernetes State Metrics or KSM relies on the informer pattern to expose cluster-level metadata about any object registered in the Kubernetes APIServers. When starting the KSM deployment, you can enable collectors that correspond directly to watchers on specific objects. From there, metrics are created to track the lifecycle of the objects, which then are exposed on KSM’s metrics server.
Metrics are text-based, following the Openmetrics format. You can find the list of metrics that are exposed here. Note that you can specify which resources you want KSM to keep track of using the resources flag, though the default has practically everything covered. See the list here.
How does the KSM check work?
As you create the Datadog Agent Daemonset, each Agent automatically starts monitoring application pods and containers that live on their respective nodes. This is also the case for the Kubernetes State Metrics pods.
The Kubernetes State metrics check v1.0 in the Datadog Agent is a python based check, which runs every 15 seconds. The process starts by having the Agent identify that a container runs the kube-state-metric image (using the image name or labels) and thereafter starts by crawling the /metrics endpoint for metadata purposes.
The configuration of the check allows the user to take advantage of the metadata associated with a certain metric to benefit another one.
Example: The following metric does not contain an actionable value:
kube_deployment_labels{deployment="kube-dns",label_addonmanager_kubernetes_io_mode = "Reconcile"}It does contain insight that can be used to know that the kube-dns deployment has the label_addonmanager_kubernetes_io_mode label, which is not added on other metrics for the deployment.
We can use the following configuration to add the value of label_addonmanager_kubernetes_io_mode as a tag to the metrics pertaining to the kube-dns deployment.
label_joins: kube_deployment_labels: label_to_match: deployment label_to_get: - label_addonmanager_kubernetes_io_modeA subsequent crawl takes place, and the check reconciles the metric names, captures the values and adds the metadata that is either directly associated with the metric or that was generated using a metadata join as detailed above.
How does the ksm check scale?
At Datadog, we take advantage of KSM extensively. Our testing has shown that beyond a few hundred nodes and thousands of pods, one needs to split the KSM deployment. Our strategy is to split given the number of objects of a specific resource type and the number of metrics they incur.
We have three deployments with the following collectors enabled:
- name: kube-state-metrics image: k8s.gcr.io/kube-state-metrics/kube-state-metrics:1.9.7 command: - /kube-state-metrics - --telemetry-port=8081 - --port=8080 - --collectors=pods- name: kube-state-metrics image: k8s.gcr.io/kube-state-metrics/kube-state-metrics:1.9.7 command: - /kube-state-metrics - --telemetry-port=8081 - --port=8080 - --collectors=nodesand
- name: kube-state-metrics image: k8s.gcr.io/kube-state-metrics/kube-state-metrics:1.9.7 command: - /kube-state-metrics - --telemetry-port=8081 - --port=8080 - --collectors=services,endpoints,daemonsets,deployments,cronjobs,statefulsets,horizontalpodautoscalers,limitranges,resourcequotas,secrets,namespaces,replicationcontrollers,ressourcequotas,secrets,namespaces,replicationcontrollers,persistentvolumeclaims,persistentvolumes,jobs,replicasetsTo take an initial performance snapshot of our check, we identified that resources, such as endpoints, jobs, and deployments, produce an average of five metrics per resource. A single node is around nine metrics, and a single pod generates around 40 metrics!
In clusters with thousands of nodes and tens of thousands of pods, we would end up with up to millions of metrics to process, every 15 seconds.
The network call to crawl the list of metrics would take tens of seconds and would weigh tens of megabytes. Initially, this forced us to slow down the frequency of the check, reducing the granularity of our metrics and degrading the experience of our internal users. As a result, we decided to revisit our design and build a better experience.
The KSM library prior to our contribution
In early 2020, the KSM community was starting to discuss the release of their next major version, V2.0.0. Many improvements and new features were about to be introduced. We realized that it would be a perfect time for us to introduce a significant change that could accommodate a new design to benefit the scalability and extensibility of the project.
KSM v1 was made out of one main loop that would instantiate a Builder with the different resources keeping track of a list of stores.
Each store would have the logic to keep track of the underlying resource using informers. For example, for the HPA store:
func createHPAListWatch(kubeClient clientset.Interface, ns string) cache.ListerWatcher { return &cache.ListWatch{ ListFunc: func(opts metav1.ListOptions) (runtime.Object, error) { return kubeClient.AutoscalingV2beta1().HorizontalPodAutoscalers(ns).List(opts) }, WatchFunc: func(opts metav1.ListOptions) (watch.Interface, error) { return kubeClient.AutoscalingV2beta1().HorizontalPodAutoscalers(ns).Watch(opts) }, }}The store would also take care of the registration of the MetricFamily, containing the metric names and how to generate the metric. For example, the metric kube_hpa_status_current_replicas, for a given HPA, the value would be from the current replicas in the status of the HPA.
{ Name: "kube_hpa_status_current_replicas", Type: metric.Gauge, Help: "Current number of replicas of pods managed by this autoscaler.", GenerateFunc: wrapHPAFunc(func(a *autoscaling.HorizontalPodAutoscaler) *metric.Family { return &metric.Family{ Metrics: []*metric.Metric{ { Value: float64(a.Status.CurrentReplicas), }, }, } }), },This process would run in the background, and all the MetricsStores would populate over time as events are received.
When the /metrics endpoint was called, the content of the stores would essentially be written into the http.ResponseWriter
// ServeHTTP implements the http.Handler interface. It writes the metrics in// its stores to the response body.func (m *MetricsHandler) ServeHTTP(w http.ResponseWriter, r *http.Request) { m.mtx.RLock() defer m.mtx.RUnlock() resHeader := w.Header() var writer io.Writer = w
resHeader.Set("Content-Type", `text/plain; version=`+"0.0.4") [...] for _, s := range m.stores { s.WriteAll(w) } [...]}As discussed earlier, a consequence of this approach meant that a potentially large amount of data was dumped at query time which caused downward pressure on the client/requester’s side to process it. Additionally, there was a missed opportunity, the Builder did not allow a way to hook into the metric generation. Running an informer can be expensive in terms of memory and CPU footprint, but can take a toll on the APIServers too. As KSM needs to run an informer for each type, should you need data on a certain type, it would be great if you could hook into the Builder and process the metrics as you wish!
Designing an extensible solution
The challenge was twofold, we wanted to reduce the time spent collecting the metrics, but also simultaneously reduce the memory and CPU footprint required to run the check.
The solution that really stood out was to take advantage of our Cluster Check feature.
We introduced the Cluster Check Runner pattern at Datadog about two years ago. The idea stemmed from an internal need to monitor data sources that couldn’t be magically discovered with the kubelet (an RDS database or a Load Balancer), as well as Network Devices in very large numbers.
As there needs to be a separate deployment of the Agent as dedicated cluster level check runners, the pattern seemed perfectly adapted to accommodate our use case of collecting the Kubernetes State Metrics data.

The first item on the agenda was cutting down the network time. We wondered if it would be possible to just run the Kubernetes State Metric Process alongside the Agent; so instead of pushing the metrics into the http.ResponseWriter upon request, have them pushed into the collector of the Agent when the check is running.
At that point, we realized that the Builder was an internal part of the KSM code, and it was not possible to vendor the library and just implement the interface with a custom implementation of the MetricStore. So, we started building POCs and reached out to the Kubernetes State Metrics community to gauge their interest in our idea. We were lucky enough to meet them at Kubecon multiple times, and in the end, we published our PR - https://github.com/kubernetes/kube-state-metrics/pull/989 - which was accepted by the ecosystem and merged into the master branch!
We kept in mind how improving extensibility could potentially have a negative impact on the performance. With the new framework we were able to be neutral and even improve performances in some cases!
### Resultold=master new=HEADbenchmark old ns/op new ns/op deltaBenchmarkKubeStateMetrics/GenerateMetrics-2 1000992426 1000926748 -0.01%BenchmarkKubeStateMetrics/MakeRequests-2 14959897766 14214421176 -4.98%BenchmarkPodStore-2 37307 37964 +1.76%BenchmarkMetricWrite/value-1-2 649 597 -8.01%BenchmarkMetricWrite/value-35.7-2 775 722 -6.84%benchmark old MB/s new MB/s speedupBenchmarkKubeStateMetrics/MakeRequests-2 694.01 730.41 1.05xbenchmark old allocs new allocs deltaBenchmarkKubeStateMetrics/GenerateMetrics-2 849198 849204 +0.00%BenchmarkKubeStateMetrics/MakeRequests-2 453935 453908 -0.01%BenchmarkPodStore-2 523 523 +0.00%BenchmarkMetricWrite/value-1-2 7 7 +0.00%BenchmarkMetricWrite/value-35.7-2 7 7 +0.00%benchmark old bytes new bytes deltaBenchmarkKubeStateMetrics/GenerateMetrics-2 87319544 87705328 +0.44%BenchmarkKubeStateMetrics/MakeRequests-2 26518620176 26518936496 +0.00%BenchmarkPodStore-2 25984 26288 +1.17%BenchmarkMetricWrite/value-1-2 536 536 +0.00%BenchmarkMetricWrite/value-35.7-2 536 536 +0.00%With this solution, the KSM code base could now be vendored as a library, and the way metrics are issued could be up to the author. This was a great win for extensibility. Furthermore, there was no need to run KSM as an independent deployment anymore in our case. This meant no more network latency and we cut in half the memory and CPU footprint. All because the Agent was now taking advantage of KSM!

Furthermore, for smaller clusters, the KSM checks can even be run directly in the Datadog Cluster Agent!
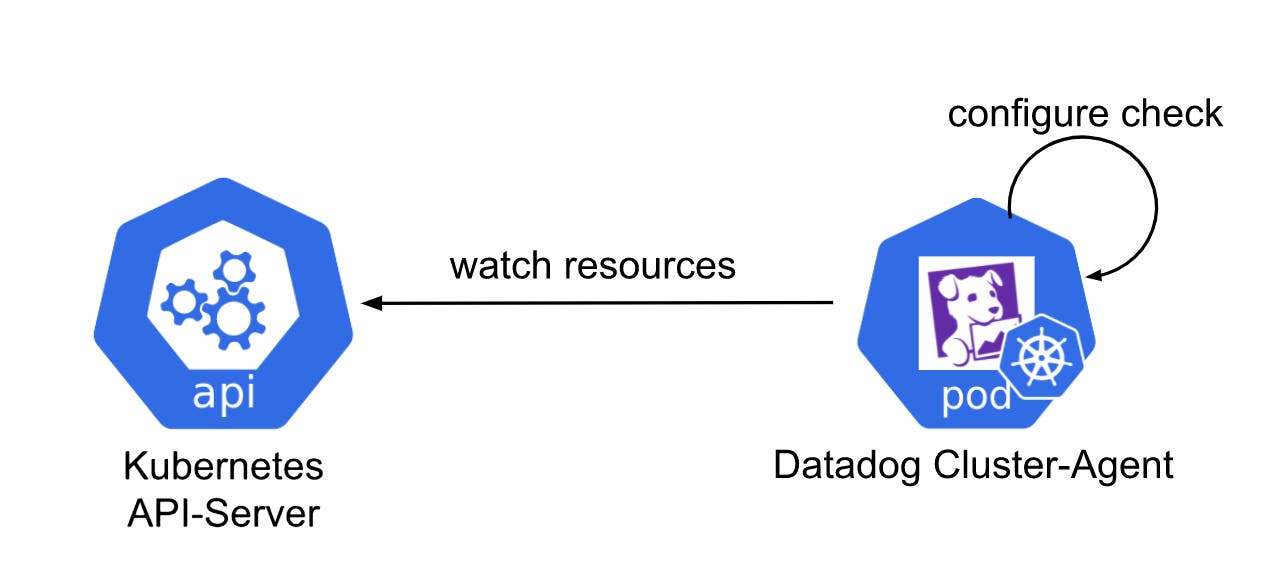
If you want to take advantage of the scalability and high availability of the process, we do recommend to leverage the Cluster Check Runners however.
The new Kubernetes state core check in the Datadog Agent
The next challenge was to enable the Datadog Agent to run a thread and pull data from it. Remember, pulling data is now possible thanks to the upstream contribution, but running the thread proved to be trickier, because the Datadog Agent has only a few agnostic core components: The collector:
- Collects and aggregates metrics from the checks.
- The scheduler: In charge of ensuring the proper scheduling/descheduling of checks (works hand-in-hand with the Autodiscovery process).
- The forwarder: Sends the aggregated payload to Datadog’s backend.
- The tagger: Aggregates metadata from multiple sources (kubelet, container runtime, cloud provider, node …) to enrich logs, metrics, and traces.
We wanted to have a long-running thread that would run Kubernetes State Metrics and one that would not be terminated and respawned every 15s. We had to extend the interface of the collector for it to accommodate this use case, which we did in these two PRs: https://github.com/DataDog/datadog-agent/pull/6636 and https://github.com/DataDog/datadog-agent/pull/6652.
Finally, we were able to introduce the main logic to start the informers according to a configuration that would feel familiar to the community and then plug it into the scheduling loop of the Agent in https://github.com/DataDog/datadog-agent/pull/5465. Another very important detail is that the check is now running in the main process instead of in Python.
Results
From a performance standpoint, we were astonished by our results. For our largest resource, Pods, we cut down the average execution time from almost three minutes per run to only 12 seconds. Another very important detail is that the check is now running in the main process (core check) instead of in Python (integration check). Moving the check to a core check in Golang also had a great impact.

During that time, we would collect up to a million metrics with high fidelity, and we were able to cut the memory footprint by half! As you can see below, the former check would only run every few minutes, whereas the new one is much more consistent.

More importantly, we realized the opportunity of offering this as part of the Live Containers product.
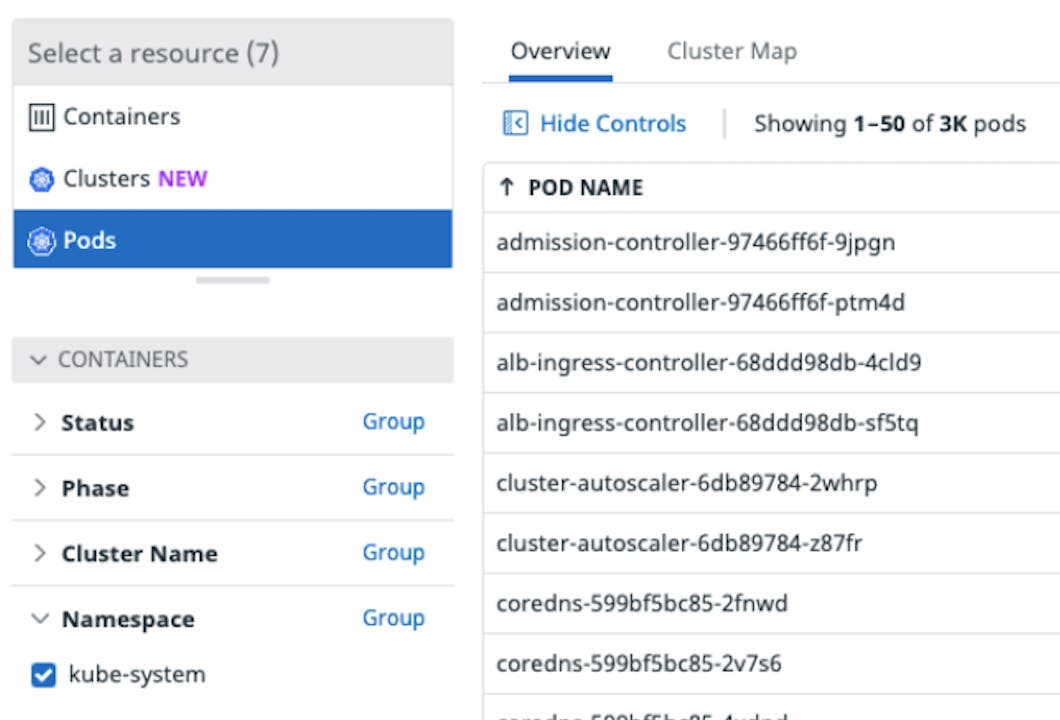
Using this, we can now easily rely on best practices from the upstream to generate metrics about anything in your Kubernetes cluster and have an explorer view more insightful than ever.
How can anyone benefit from the contribution?
Kube State Metrics can now be leveraged by anyone to send and store the generated metrics in any data store. Previously, Prometheus was the only option.
Technically, once you plug your application into the Kube State Metrics in-memory store, you can read the data at any frequency and with custom filters, then apply any transformations you want. After that, it’s up to you to decide what to do with the metrics. You can store the metrics in a persistent storage for audit, or even show them in real-time directly on a graph if you’re not interested in keeping historical data. As for the Datadog Agent, it sends the generated data directly to Datadog as Datadog metrics.
What’s next for us?
Contributing to the Kubernetes State Metrics code base has been a great experience and we are grateful for the team of maintainers. Thanks to all this work, our internal Datadog users will have a seamless experience monitoring large Kubernetes clusters with thousands of resources, cutting down maintenance costs and operation toil and they will benefit from state of the art, community based tooling.
Next up for us is to introduce a way to register custom MetricFamilies for any Kubernetes resource and generate metrics for CRDs. This way, users will be able to monitor any custom resource and very easily contribute back to the upstream code base for everyone to benefit from their usage.
We look forward to working more closely with the Kubernetes community and highly recommend for anyone who wants to contribute to just reach out!

