
Anatole Beuzon

Bowen Chen
Getting paged to investigate high-urgency issues is a normal aspect of being an engineer. But none of us expect (or want) to get paged about every single deployment. That was what started happening with an application in our usage estimation service. Regardless of the size of the fix or the complexity of the feature we pushed out, we would get paged about high startup latency—an issue that was never related to our changes. These alerts often resolved on their own, but they were creating unsustainable alert fatigue for our team and obscuring more pressing alerts.
At first, it seemed like it would be a simple fix, but it was not meant to be. Whenever we addressed one bottleneck, we would uncover another issue that needed to be fixed. Over the course of several months, we followed the investigation wherever it would take us and addressed four separate issues—including a misconfiguration in our network proxy and a Linux kernel bug. In this post, we’ll share the details of how we looked at system-level metrics and inspected each component in the network path to investigate and resolve these issues in production.
Our usage estimation service at a glance
Before going any further, let’s take a closer look at our usage estimation service. This service provides metrics to help our customers track their usage of different Datadog products. It is composed of three applications: router, counter, and aggregator. The counter application tracks the number of unique instances of events and metrics, which is used to calculate the usage estimations.

Upon startup, counter fetches data from a remote cache and caches it locally before it can start to count incoming data. Resolving requests via the local cache is faster and much less resource intensive because it bypasses the CPU cost of serializing and transmitting network packets to and from the remote cache. While the local cache populates, counter processes requests at a much slower rate.
Normally, the p99 remote cache latency (i.e., the 99th percentile round-trip time for counter to fetch data from the remote cache) hovers around 100 ms. However, during rollouts, this metric would spike upwards of one second. During this period, we would get paged for “excessive backlog” due to the growing number of requests waiting to be processed.
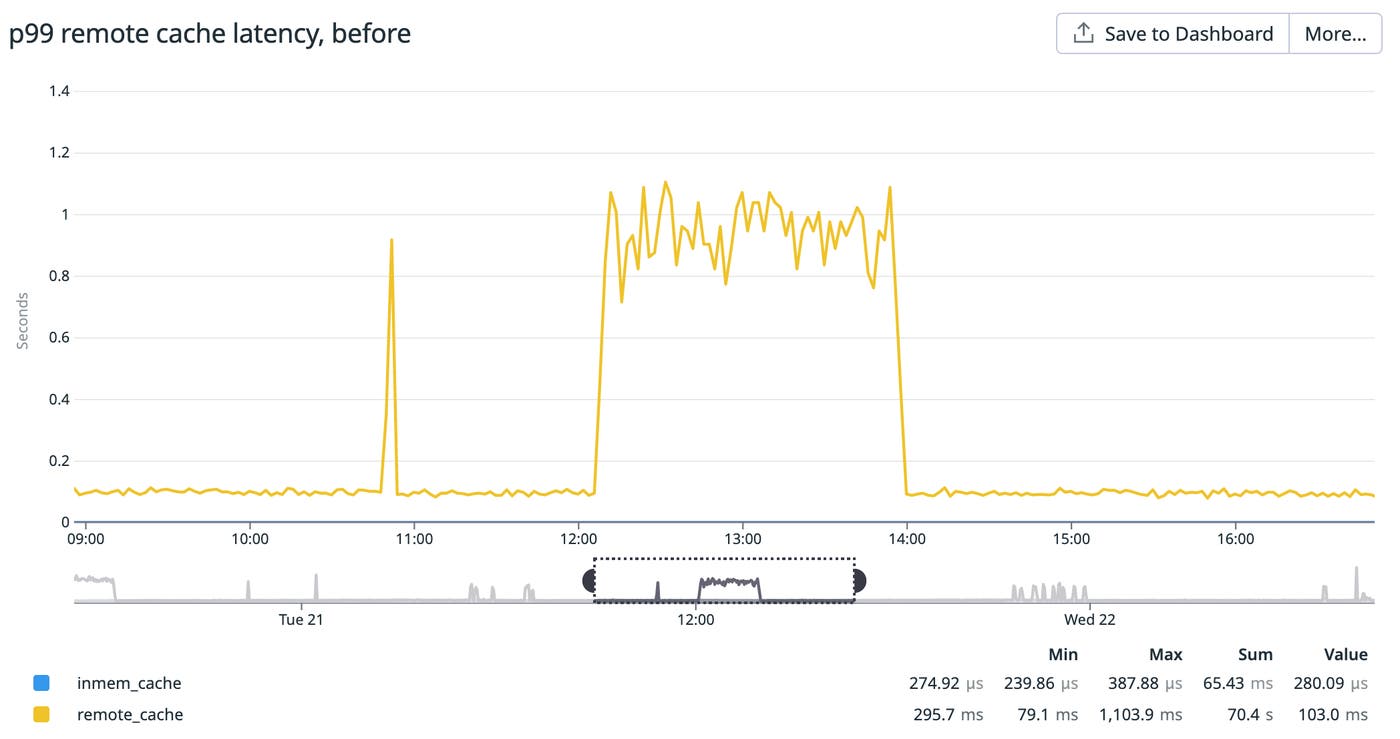
Since the remote cache receives a greater number of requests during rollouts, our initial instinct was that we needed to provision more replicas to support the influx of requests. However, scaling out the remote cache did not yield any noticeable improvement.
Allocating more CPU to a remote cache dependency
After confirming that our remote cache wasn’t underprovisioned, we started to look into other leads. Datadog Network Performance Monitoring showed us that TCP retransmits would spike every time counter was deployed, which suggested that we were dealing with a network-level issue.

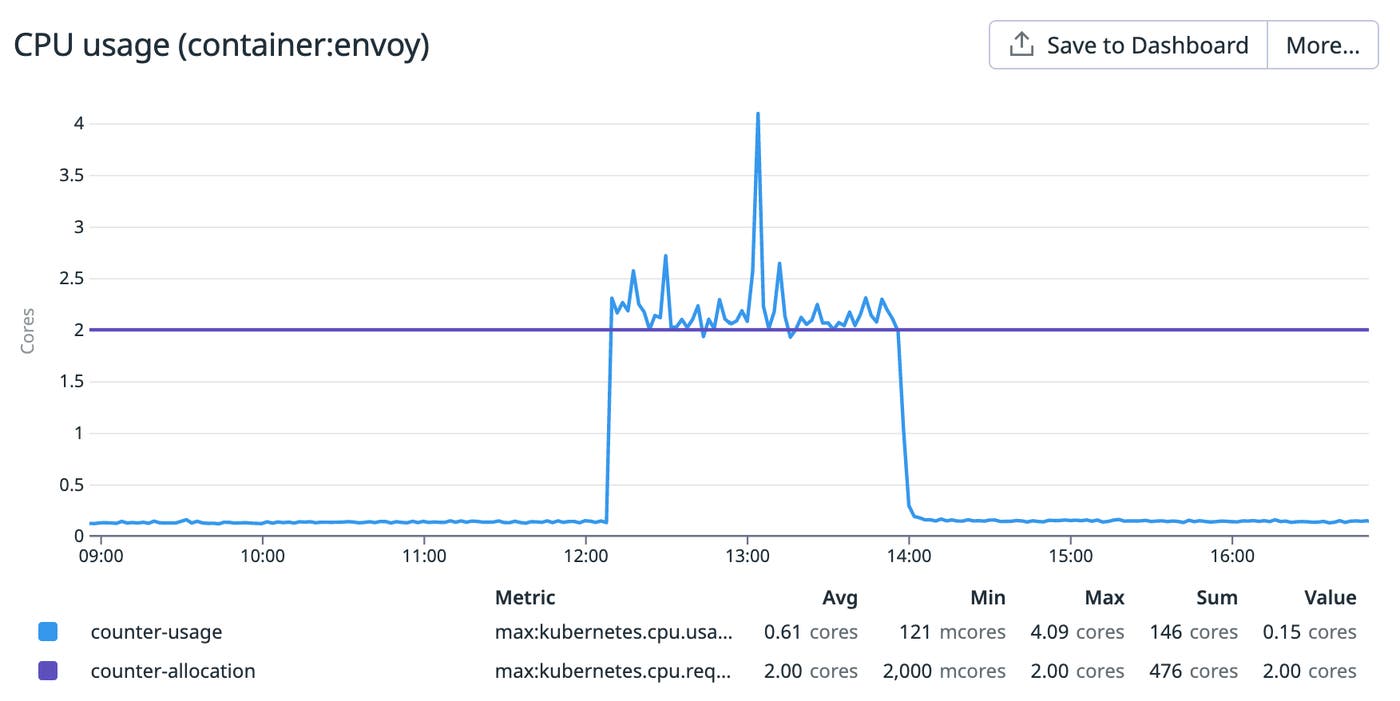
Before a request reaches the remote cache, it gets routed through a sidecar Envoy proxy. Envoy then batches incoming queries into a new packet that gets sent to the remote cache. This process requires a large volume of read and write operations, which makes it CPU intensive.

We noticed that when counter restarted, the Envoy sidecar would max out its CPU allocation (two cores) and get throttled, as shown in the graph below. If Envoy wasn’t able to process a request from counter or a response from the remote cache (due to heavy traffic), the request would get retried—which explained the spikes in TCP retransmits and remote cache latency.
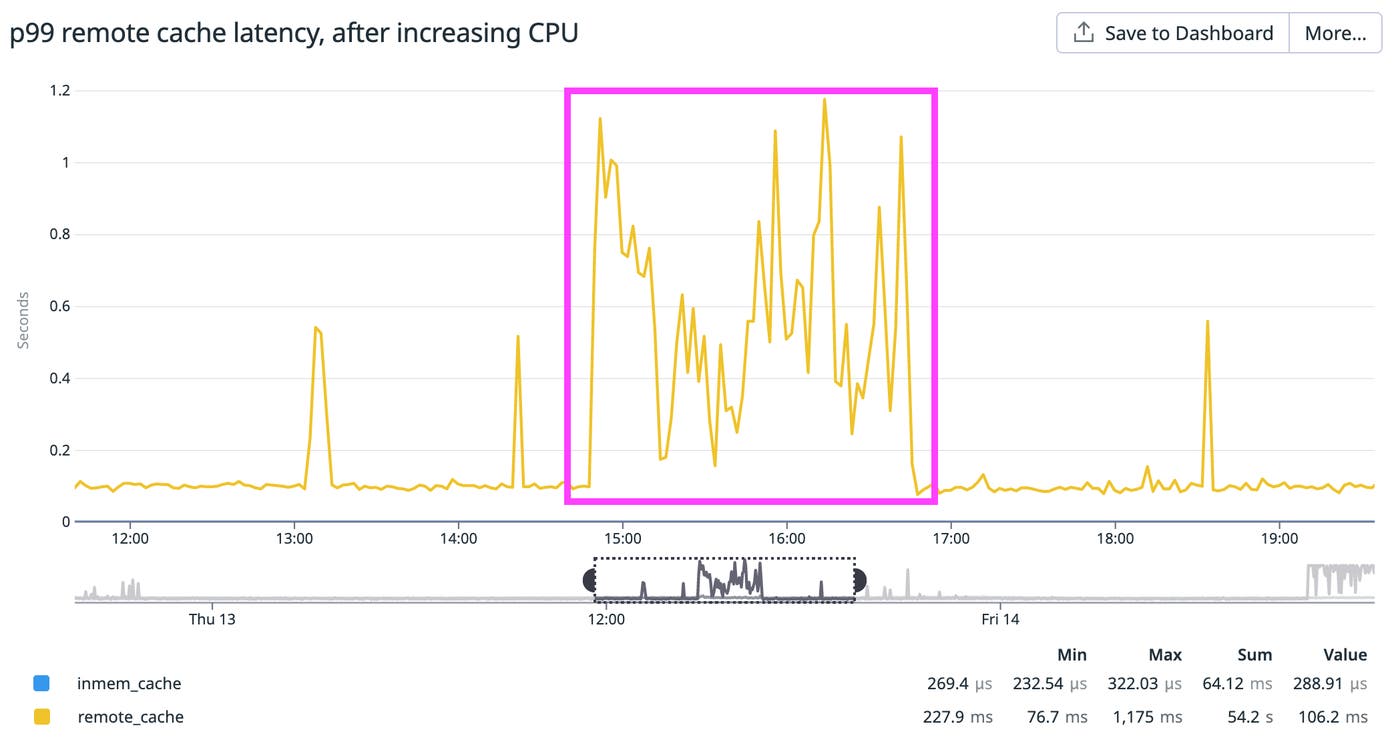
When we allocated more CPU to Envoy in our staging environment, our latency issue completely disappeared! However, when these changes were pushed to production, the issue still wasn’t fully resolved. Instead of plateauing at about one second, the p99 remote cache latency was now oscillating between 300 ms and one second during rollouts (highlighted below). This was a slight improvement, but clearly still higher than normal (~100 ms), indicating that there were still unresolved bottlenecks occurring at some point when counter fetched data from the remote cache. We also observed latency spikes sporadically occurring outside of each rollout window.
Patching a Linux kernel bug
Around this time, we consulted other teams at Datadog to see if they had previously encountered similar network issues in their applications. Discussions with our Compute team brought a potential lead to our attention: a Linux kernel bug that was creating a bottleneck between Envoy and the network adapter. Our counter application uses AWS’s Elastic Network Adapter (ENA) to transmit outbound packets from Envoy to the remote cache. This bug caused the Linux kernel to always map traffic to the first transmit queue instead of across eight transmit queues. This meant that the throughput of counter was much lower than expected, which explained the high volume of TCP retransmits during periods of heavy traffic (e.g., application deploys).
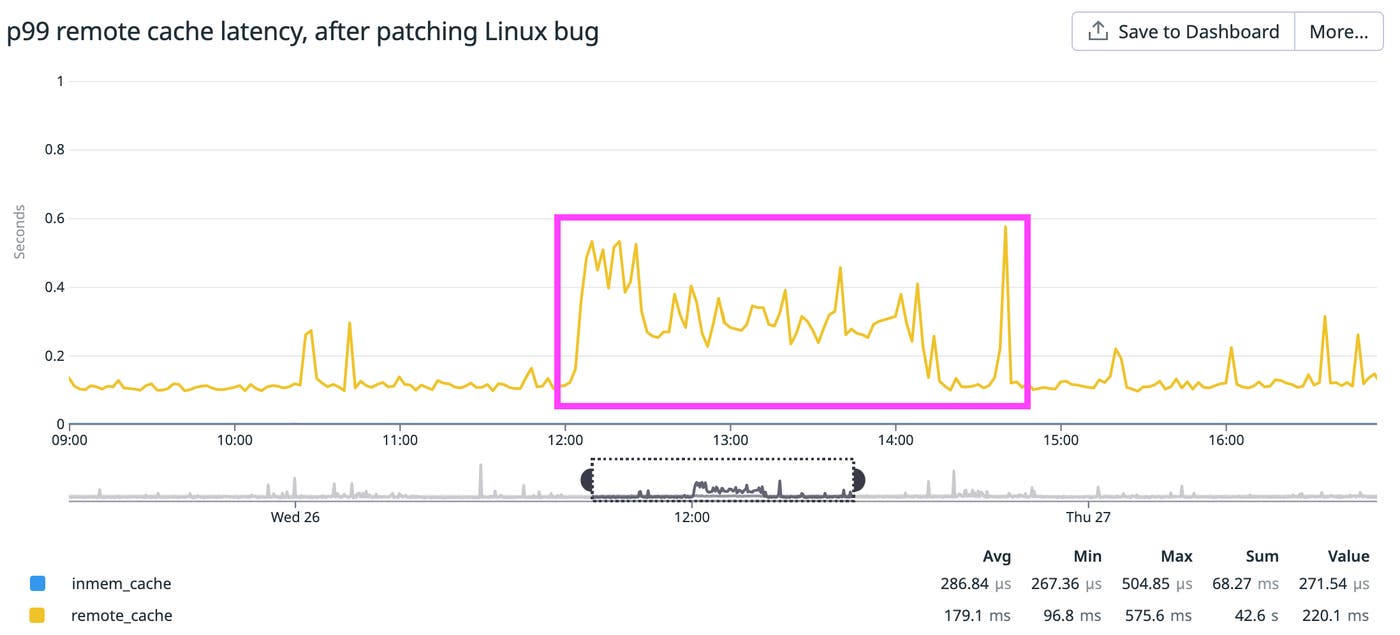
We applied a hotfix that distributed requests across all eight transmit queues and hoped that this would end our quest for low latency. However, this fix only resolved latency spikes during non-rollout periods, and latency during rollouts remained higher than normal (oscillating between 200 ms and 600 ms). We knew that we still needed to address another bottleneck before achieving a victory.
Optimizing AWS instance network configurations
It was encouraging to see that the round-trip latency was improving, but at the same time, we were frustrated that the issue was still ongoing after dozens of hours of debugging.
Now that we were distributing traffic across all of our ENA transmit queues, we suspected that we were saturating the network bandwidth of our instances and that switching to another instance type could help resolve the remaining issues. When investigating the network throughput, we noticed an unexpectedly high value of two key ENA metrics during rollouts: system.net.aws.ec2.bw_in_allowance_exceeded and system.net.aws.ec2.bw_out_allowance_exceeded.
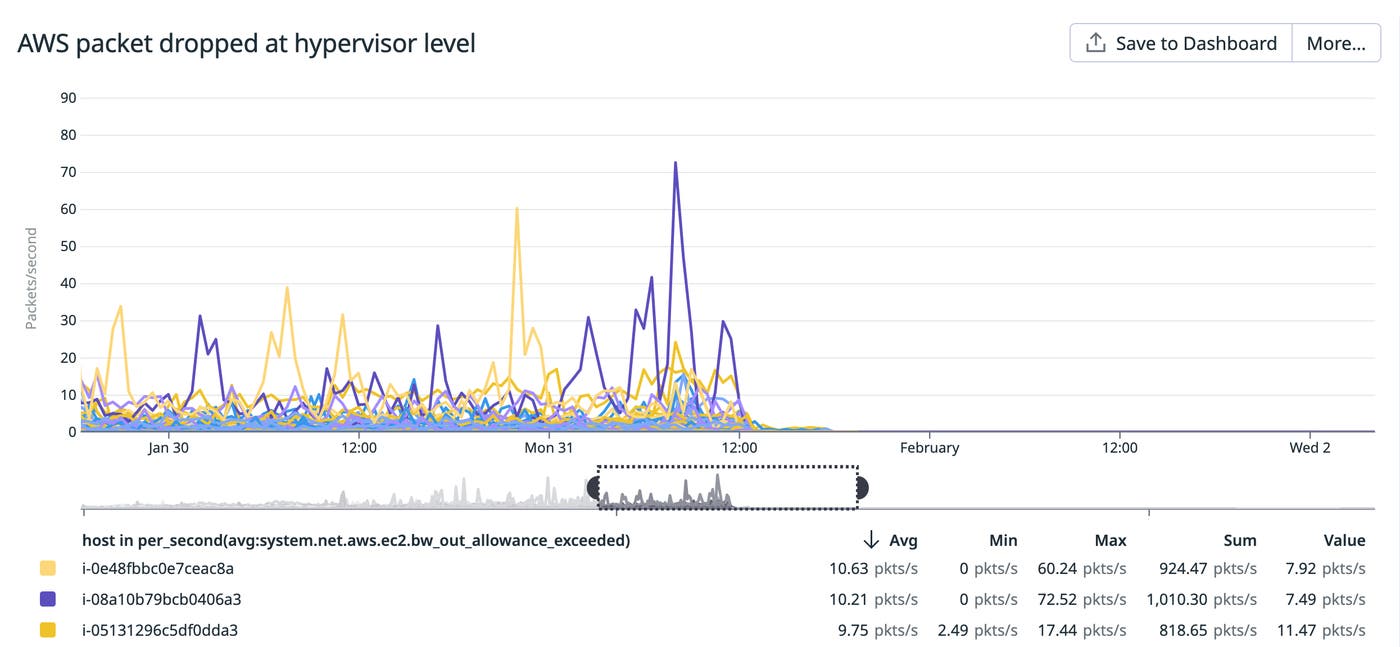
These metrics indicate when the network throughput of any EC2 instance exceeds AWS’s limit for that instance type, at which point AWS will automatically drop packets at the hypervisor level. We were exceeding our network bandwidth as packets were sent to and from the remote cache through the ENA. Packets dropped due to network limitations would then retransmit, which slowed down our requests to the remote cache during rollouts. To address this problem, we migrated to network-optimized EC2 instances that had a higher bandwidth allowance, which immediately minimized the number of packets being dropped at the hypervisor level.
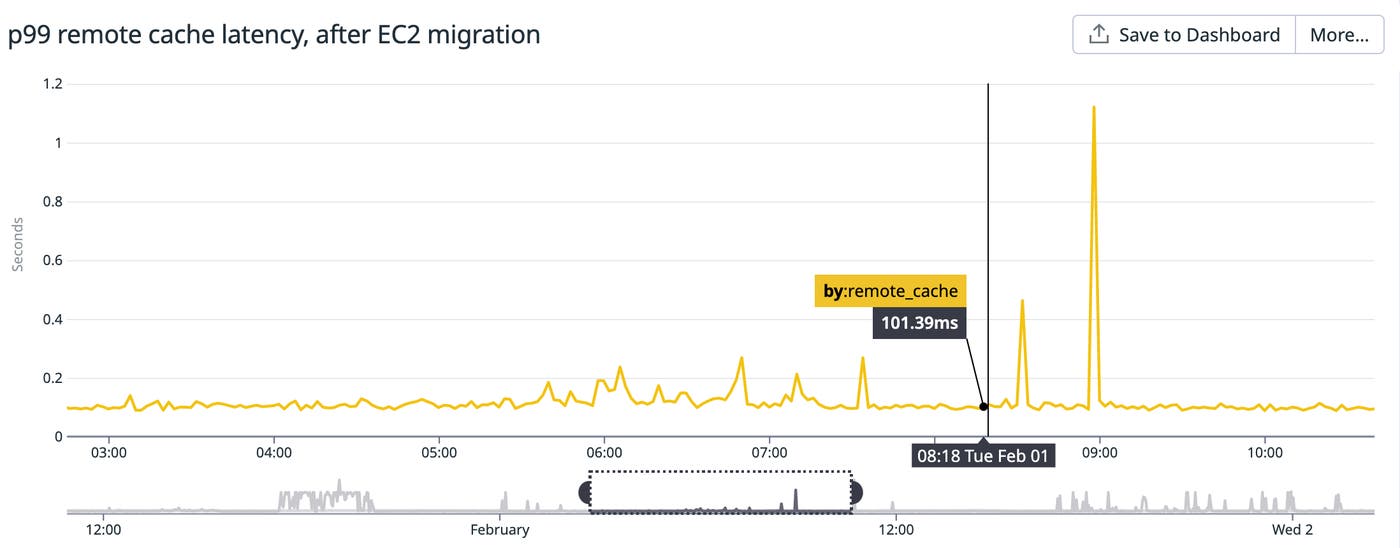
Following this migration, the p99 remote cache latency was mostly stable and hovered around 100 ms (normal levels), but we were still seeing occasional latency spikes of approximately one second.
Routing client requests away from terminating pods
Finally, as we were inspecting our application dashboard, we noticed that the latency spikes correlated with terminating remote cache pods. We discovered that clients were sending requests to terminating remote cache pods, which led to one-second timeouts and retries. Although our remote cache had a built-in graceful shutdown feature, it still was not successfully waiting for all Envoy clients’ in-flight requests to finish before shutting down.
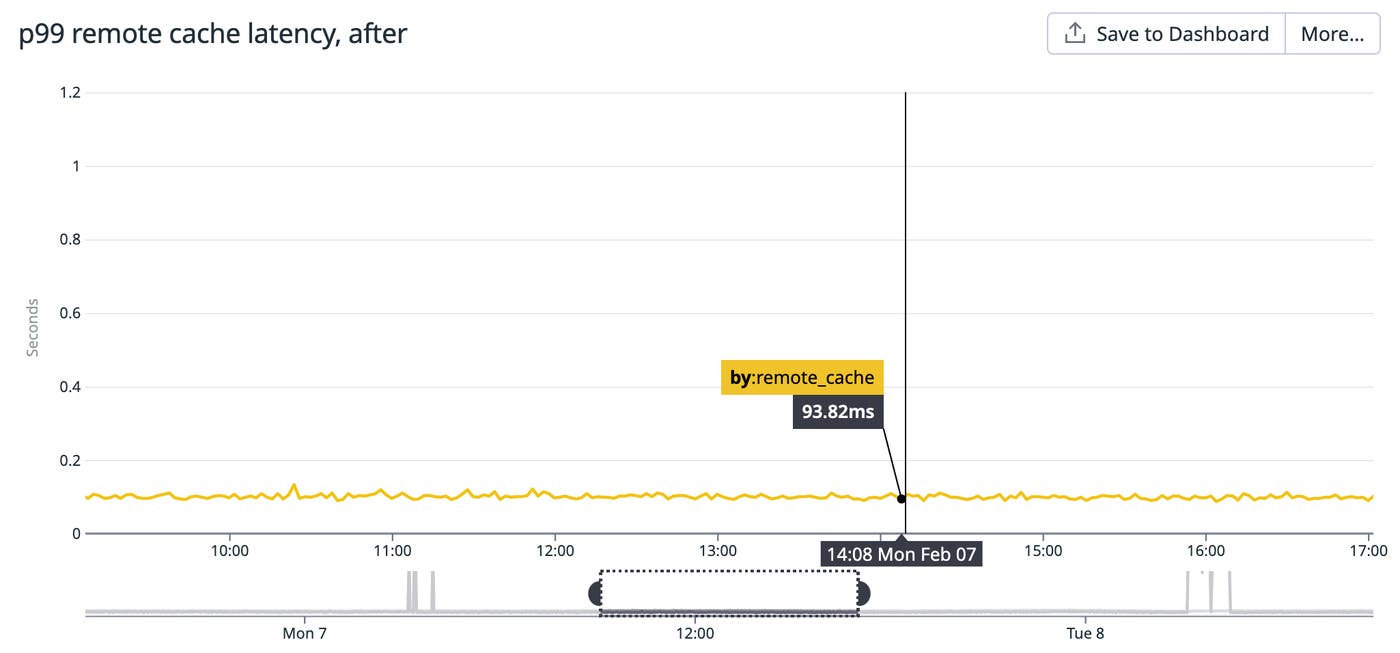
To address this issue, we implemented a preStop hook on remote cache pods, which sets an XXX_MAINTENANCE_MODE key to inform clients when a pod is about to be terminated. We also ensured that once the key was set, the pod would wait for all clients to successfully disconnect before terminating. On the client side, we configured Envoy to look for this key so it would know not to distribute requests to terminating pods. After this change was rolled out, the p99 remote cache latency consistently fell below 100 ms and the issue was finally resolved.
Recap
From the beginning of our journey to the end, we implemented several distinct checks and fixes that helped us resolve high network latency in our counter application. We:
- Ensured that the upstream remote cache was properly provisioned
- Allocated additional CPU cores to the sidecar Envoy proxy to address throttling
- Fixed an upstream Linux kernel bug that was restricting the number of ENA transmit queues being used
- Switched to an EC2 instance type that offered higher network bandwidth to reduce the number of packets being dropped at the hypervisor level
- Implemented a preStop hook so clients could successfully disconnect before remote cache pods terminated
Bolster your visibility and learn to look twice
The process of resolving this issue showed us that what appears to be a straightforward network latency issue can turn out to be rather complex. In order to address these kinds of issues more effectively in the future, we identified steps we could take to improve the observability of our network. We now realize the importance of alerting on AWS ENA metrics, such as bandwidth allowance metrics. Pod-level network metrics (e.g., a high number of dropped packets and retransmit errors) and host-level network metrics (e.g., increased scheduler and queue drops/requeues) would have notified us more directly to the problem during various stages of our investigation.
Fixing this network issue enabled us to confidently scale down our remote cache by a factor of six—and we expect that we have room to scale down even more. Although we migrated to a more expensive EC2 option, this reduction in scale will save us hundreds of thousands of dollars annually. Additionally, now that we’ve removed the noise of intermediary bottlenecks, the p99 remote cache latency is a more reliable indicator of load, which will provide better visibility when troubleshooting future issues in our usage estimation service.
We hope that you found this tale of debugging network performance interesting. If you would like to work on similar issues, Datadog is hiring!

