Jules Denardou

Doug DePerry
Datadog maintains multiple compliance and security layers and employs a number of controls to prevent and detect unauthorized access. This post highlights some recent work to improve our cloud-based monitoring and alerting pipeline.
The Datadog security team has created a robust, largely serverless security monitoring and alerting pipeline to monitor our extensive operations in the AWS cloud. Via a centralized security orchestration framework, we integrate with Slack, Duo and PagerDuty to notify, alert and authenticate potential security-relevant API calls. To create a highly available security monitoring and alerting pipeline we used several AWS service offerings. The pipeline sends data to a dedicated security-oriented AWS account while data collection is easily deployed to every Datadog AWS account via Terraform.
The Problem
As a Software as a Service company Datadog spends a lot of time in the cloud and relies on several service providers, one of which is AWS. With 15+ AWS accounts and a large customer base, Datadog is responsible for a lot of AWS API activity. This presents an interesting security problem: given an entirely cloud-based product and nearly 200 geographically dispersed engineers, how can we monitor multiple AWS accounts to ensure that they are safe from malicious actors AND prevent well-meaning engineers from accidentally exposing sensitive data via misconfiguration?
As you may know, every action performed in AWS generates an API call, whether it is initiated via the web console or command line tools. AWS helpfully provides various mechanisms through which customers may observe or log these calls to gain insight on what is actually happening within their accounts. This is the data we need to be able to detect potential security events, but efficiently and thoroughly monitoring a firehose of API calls without creating and staffing a Security Operations Center is no trivial task.
Narrowing Focus
We use CloudTrail to log all the AWS API calls on every account, but this is a massive firehose of data. So the first thing we did was to create a list of specific API calls that are relevant to the security of our accounts. Then, we divided the list into three severities, log, notify, and alert.
We log calls that are less worrisome than others or that may be useful later in a forensic investigation. Examples are CreateGroup or UpdateUser.
We notify the engineer that initiated the API call directly, and assert that they were indeed the one who performed the action. We do this in order to protect against the event of a compromised AWS user account. This prevents the security team from being inundated with false-positives by pushing verification of the event to the one who initiated the action. It also serves as a gentle reminder to the engineer that certain actions have security implications and require extra thought. Examples include CreateUser and PutUserPolicy.
Finally, the security team is alerted directly if the action is something that should rarely or never happen during the normal course of business, or is an obvious misconfiguration violating some security guarantee.
The best example of this is AuthorizeSecurityGroupIngress to 0.0.0.0/0, which opens an EC2 security group (think: firewall) to the entire Internet, thereby exposing whatever host or service the security group is intended to protect.
The Solution
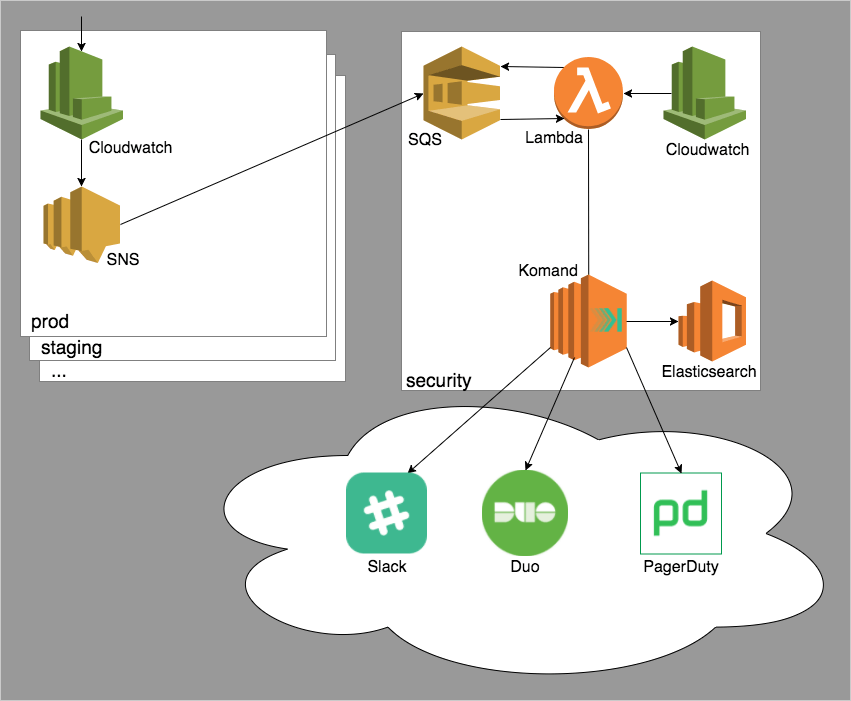
The diagram below illustrates the pipeline at a high level:

The pipeline begins with a Cloudwatch Event Rule. Cloudwatch allows us to provide a list of API calls we are interested in as triggers. When Cloudwatch sees one of the specified API calls, it can perform some action with the data. In this case, we have Cloudwatch notify an SNS Topic. An SQS queue within the security AWS account subscribes to the SNS Topic in each internal account we monitor. When a Cloudwatch event fires, it gets sent to SNS which sends the call cross-account to the SQS queue in the security account. This portion of the pipeline is architected in this way for two reasons:
- We need to centralize the data from each account within the security account and Cloudwatch cannot currently send data cross-account to SQS.
- Datadog engineers will occasionally perform multiple actions within a very short period of time due to our use of Terraform for AWS account configuration and management. To notify or alert on every API call individually would create a very disruptive experience for the engineer or the security team.
To get the API call data out of the SQS queue we created a Cloudwatch rule to trigger a lambda function every two minutes in the security AWS account. We thought this was a good balance between alerting speed and disrupting engineers with multiple notifications. The lambda sends the API call data to our security orchestration layer for further processing.
The Logic
To prevent being inundated by alerts, we are very selective with the API calls we process. Parsing the API call and all of its parameters, applying logic in a centralized way, and easily interacting with multiple disparate systems and APIs helps prevent the flood of false positives. Luckily there’s an app that does all of this. It’s called Komand and it’s a security orchestration and automation platform created by a company of the same name (recently acquired by Rapid7). We use Komand to create a workflow consisting of multiple individual plugins, decision points and branches. The plugins are self-contained code modules that perform a specific action, such as integrate with a third-party service or run custom code.
We use a number of plugins that Komand has created in combination with multiple custom-coded plugins to construct the workflow for our cloud alerting pipeline.
Our custom decision-making plugin parses the API call and its parameters and decides what to do based on a host of details: the calling user, the age of the call, the number/type/content of request parameters, and more. Based on the output of this plugin, we either alert the security team directly via PagerDuty because a security event occurred, silently log the call because nothing bad happened, or we send a notification to the engineer who made the call.
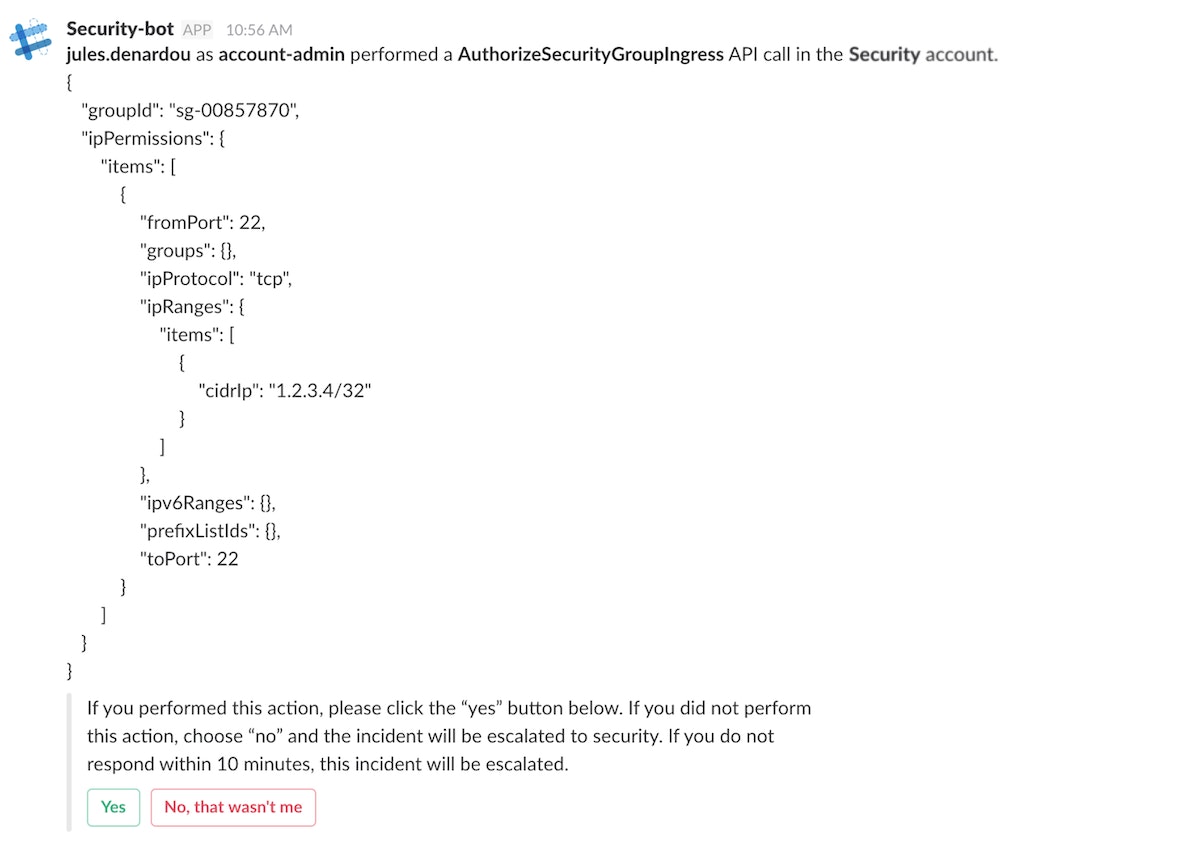
The user-notification flow sends the engineer an interactive message via Slack that contains API call details and asks them to verify the action.

If the engineer performed the action, they click the “Yes” button, which then kicks off a Duo push to verify their identity with a second factor. If the engineer does not answer in a timely manner, or indicates they did not perform the action, the workflow will alert the security team. The interaction with the various external services is all handled through Komand, which provides a central repository of latent authority and logic which allows us to develop this workflow quickly and efficiently.
All the details of each run of the workflow are logged and shipped to Elasticsearch. This lets us easily visualize all security alerting events allowing us to measure efficacy, make improvements and spot behavioral trends. In a future post, we will detail how the entire pipeline is monitored using Datadog.
Visibility is a big part of what we do at Datadog and security is no different. An effective security monitoring and alerting pipeline provides meaningful data and actionable intelligence to the security team, allowing us to efficiently protect the company and our customers.
If building security tools and infrastructure interests you, we’re hiring! Check out our careers page


