Sumedha Mehta

Colten Woo

Jason Mimick

Josh Lineaweaver
Amazon Elastic Container Service (ECS) Managed Instances offers developers a fully managed compute option that reduces the operational overhead of running Amazon Elastic Compute Cloud (EC2) workloads. Using ECS Managed Instances, you can access a broad range of EC2 instance types, reserved capacity, and advanced security and observability configurations without the pains of infrastructure management.
In partnership with AWS, Datadog is extending our ECS monitoring capabilities to provide full support for monitoring ECS Managed Instances. Using Datadog, you can analyze cluster performance, troubleshoot failing tasks, and correlate different types of telemetry data across your ECS environments, regardless of whether you use Fargate, EC2, or ECS Managed Instances. In this post, we’ll cover the benefits of ECS Managed Instances, as well as how to do the following:
- Troubleshoot your resources in the ECS Explorer
- Configure alerts for your ECS tasks with monitor templates
- Monitor your ECS environment with our out-of-the-box (OOTB) dashboard
What are Amazon ECS Managed Instances?
ECS Managed Instances are a fully managed compute option for Amazon ECS that allow you to run containerized workloads on Amazon EC2 instance types while offloading infrastructure management to AWS. This includes provisioning, patching, scaling, and maintaining the underlying hosts. Developers can use managed instances to access capabilities such as GPU acceleration, specialized CPU architectures, and high-throughput networking without taking on the operational burden of managing EC2 hosts. In our most recent State of Serverless report, our customer data showed that GPU usage is on the rise to support growing AI and data processing workloads. However, if your operators aren’t skilled in GPU host maintenance and cost management, it can result in underutilization, failed training jobs, and unexpected costs.
Developers can bridge this gap using ECS Managed Instances. The managed compute option provides the flexibility of EC2 instance types (such as those specialized for GPU workloads) with the operational simplicity of a Fargate managed service. It enables workloads ranging from machine learning training and inference to large-scale data processing, real-time analytics, and high-performance web applications. But as your applications rely on a broader set of compute options, you’ll continue to require deep visibility into resource health, task behavior, and performance data to keep your services reliable.
Troubleshoot your resources in the ECS Explorer
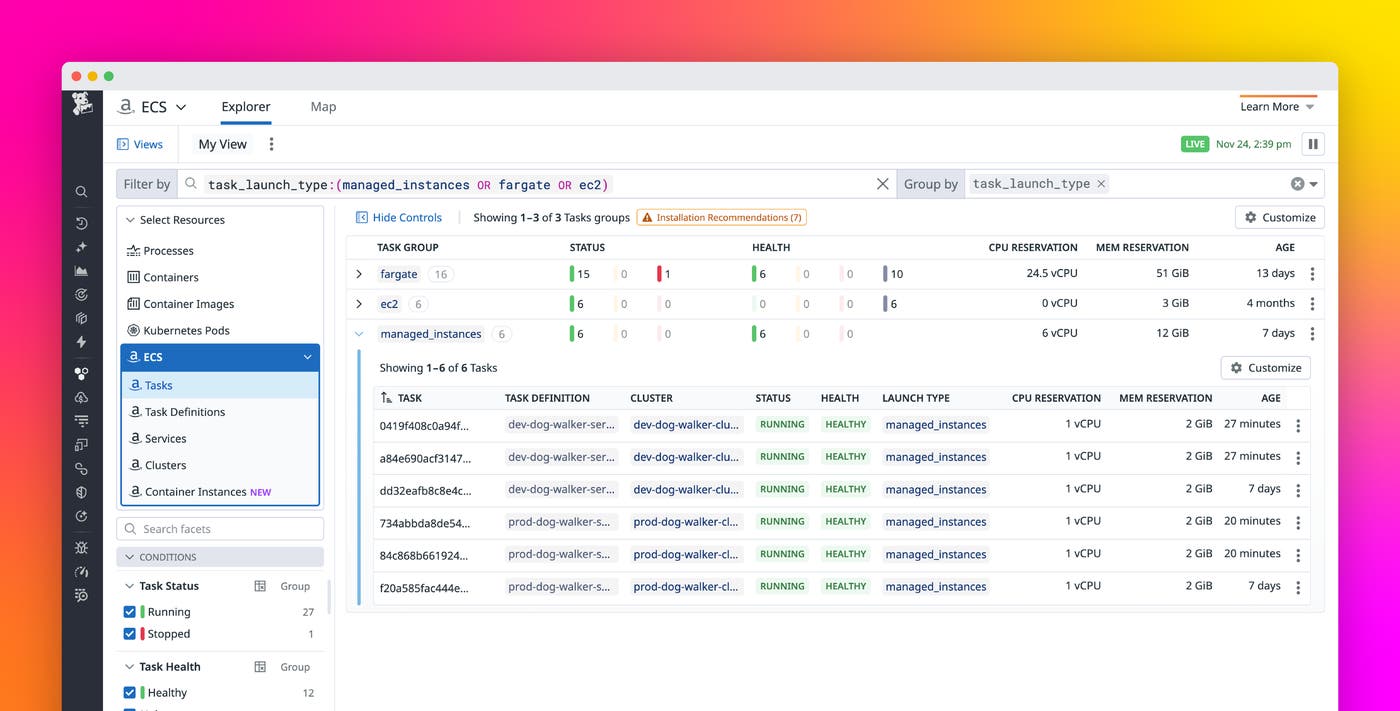
Datadog now extends its ECS monitoring to fully support ECS Managed Instances, ensuring that you have consistent observability across all ECS launch types. Using Datadog, you can monitor cluster state, host-level performance, container behavior, and application telemetry of different tasks across Fargate, EC2, and ECS Managed Instances.
The ECS Explorer provides a unified view of your ECS environment to help you understand service relationships, inspect resource configurations, and analyze performance signals. Inspecting a resource provides context into its configuration, YAML definitions, live status, and more. For each resource, Datadog can identify related resources based on live telemetry collected by the Agent. From this Related Resources tab, you can seamlessly navigate between the clusters, services, tasks, and containers tied to the resource you’re investigating.
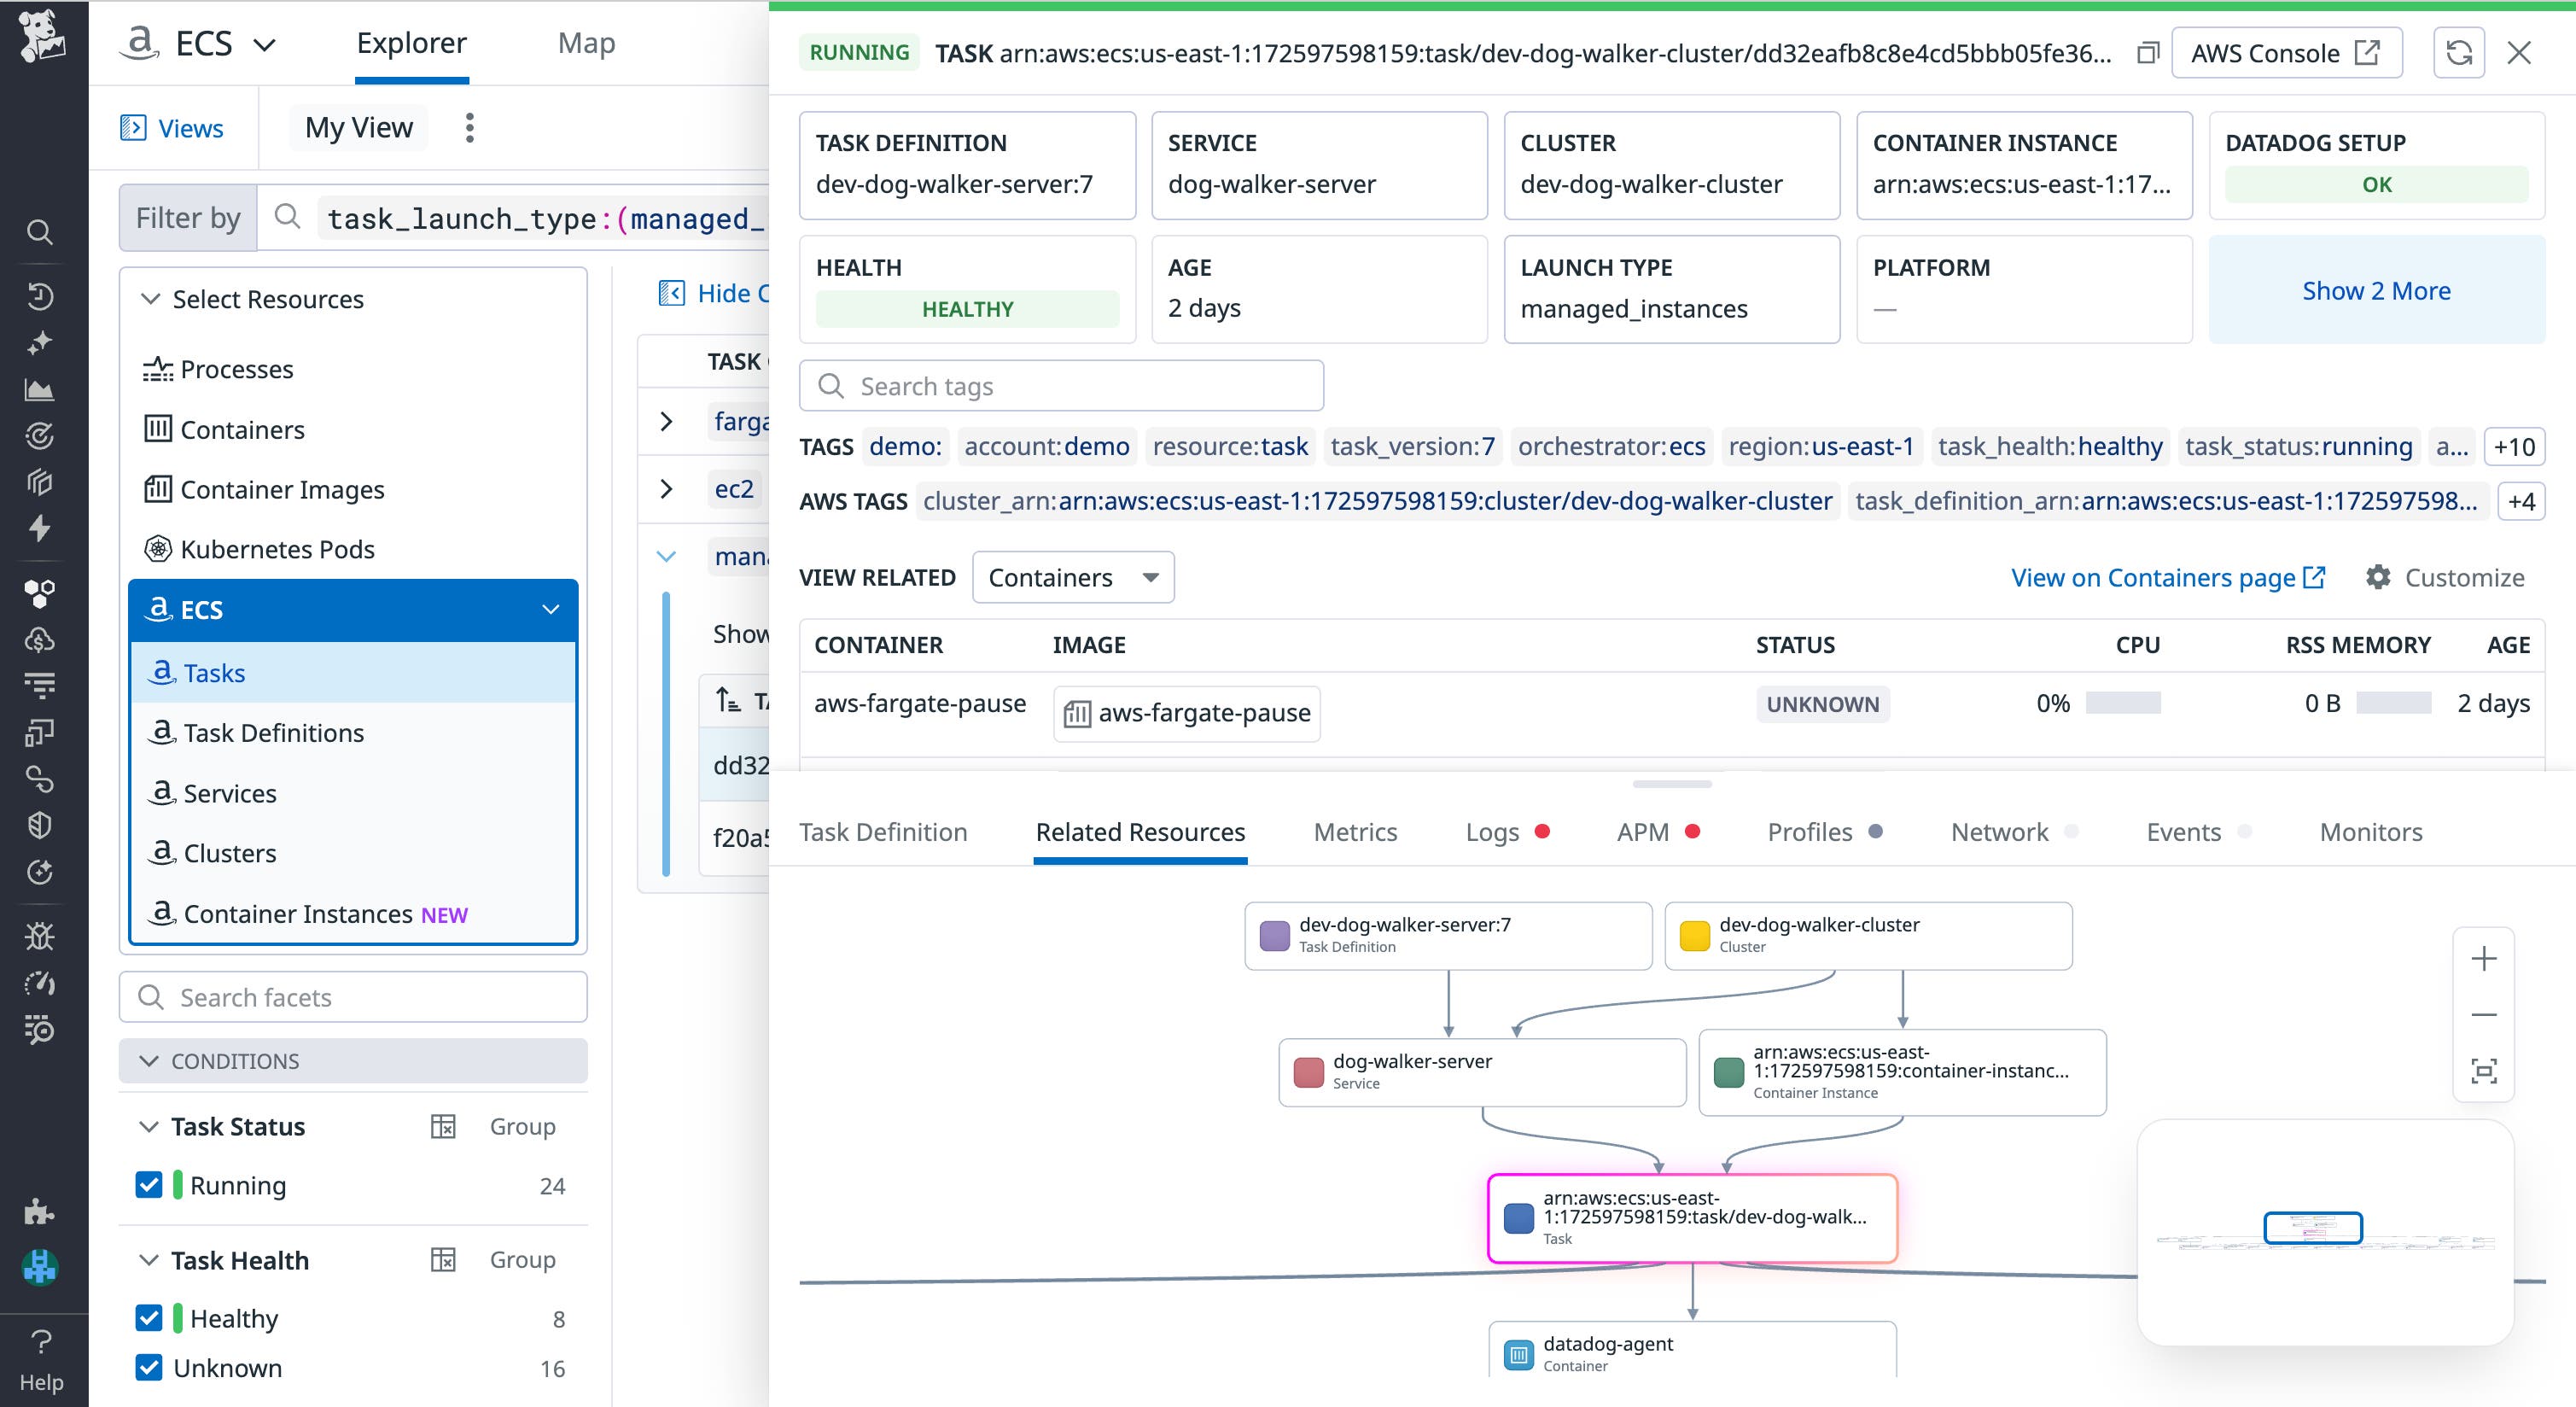
One of Datadog’s key monitoring capabilities is correlating signals across different telemetry collected by the Datadog Agent—and this feature now also applies to ECS Managed Instances. By inspecting a resource from a managed instance, you can view correlated metrics such as CPU, memory, and network performance; container and task logs; distributed traces; code-level profiles; and more.
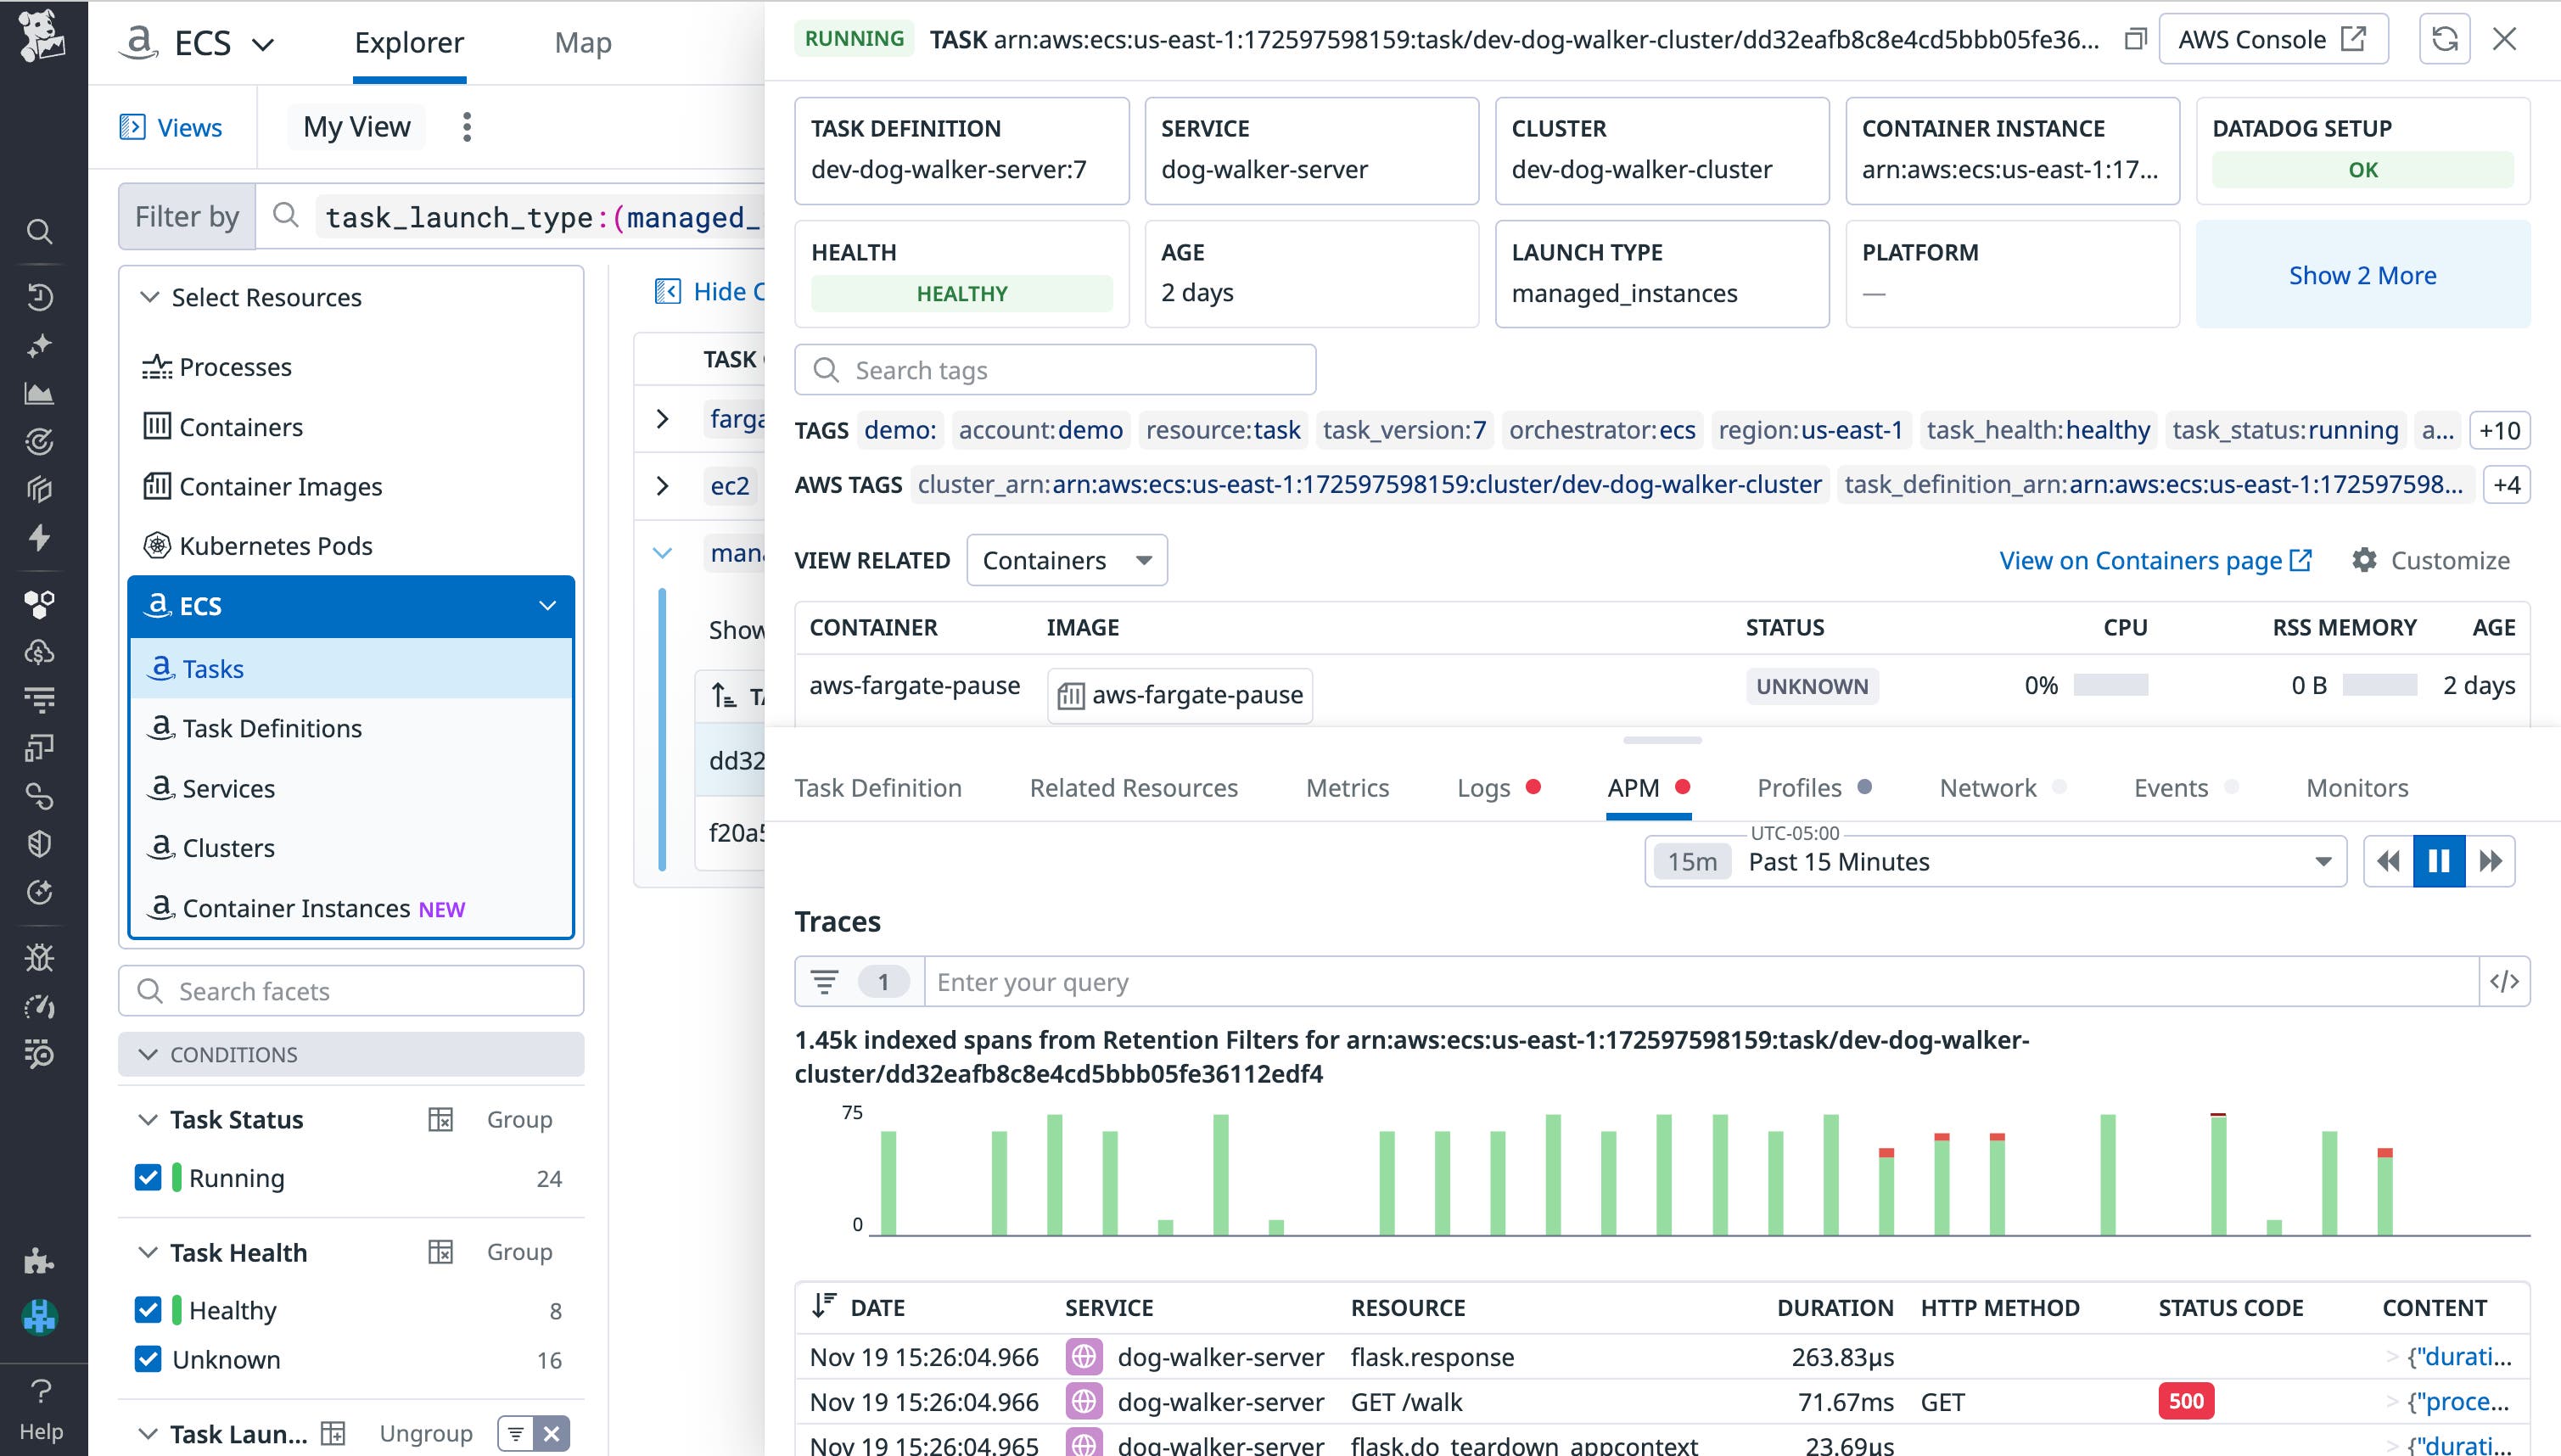
Because all ECS resource types emit real-time telemetry collected by the Agent, you can pivot from an issue—such as a failing task or a CPU-saturated node—to the relevant traces, error logs, or events within seconds. This consolidated workflow helps reduce mean time to resolution and improves the reliability of your deployments.
Configure alerts for your ECS tasks with monitor templates
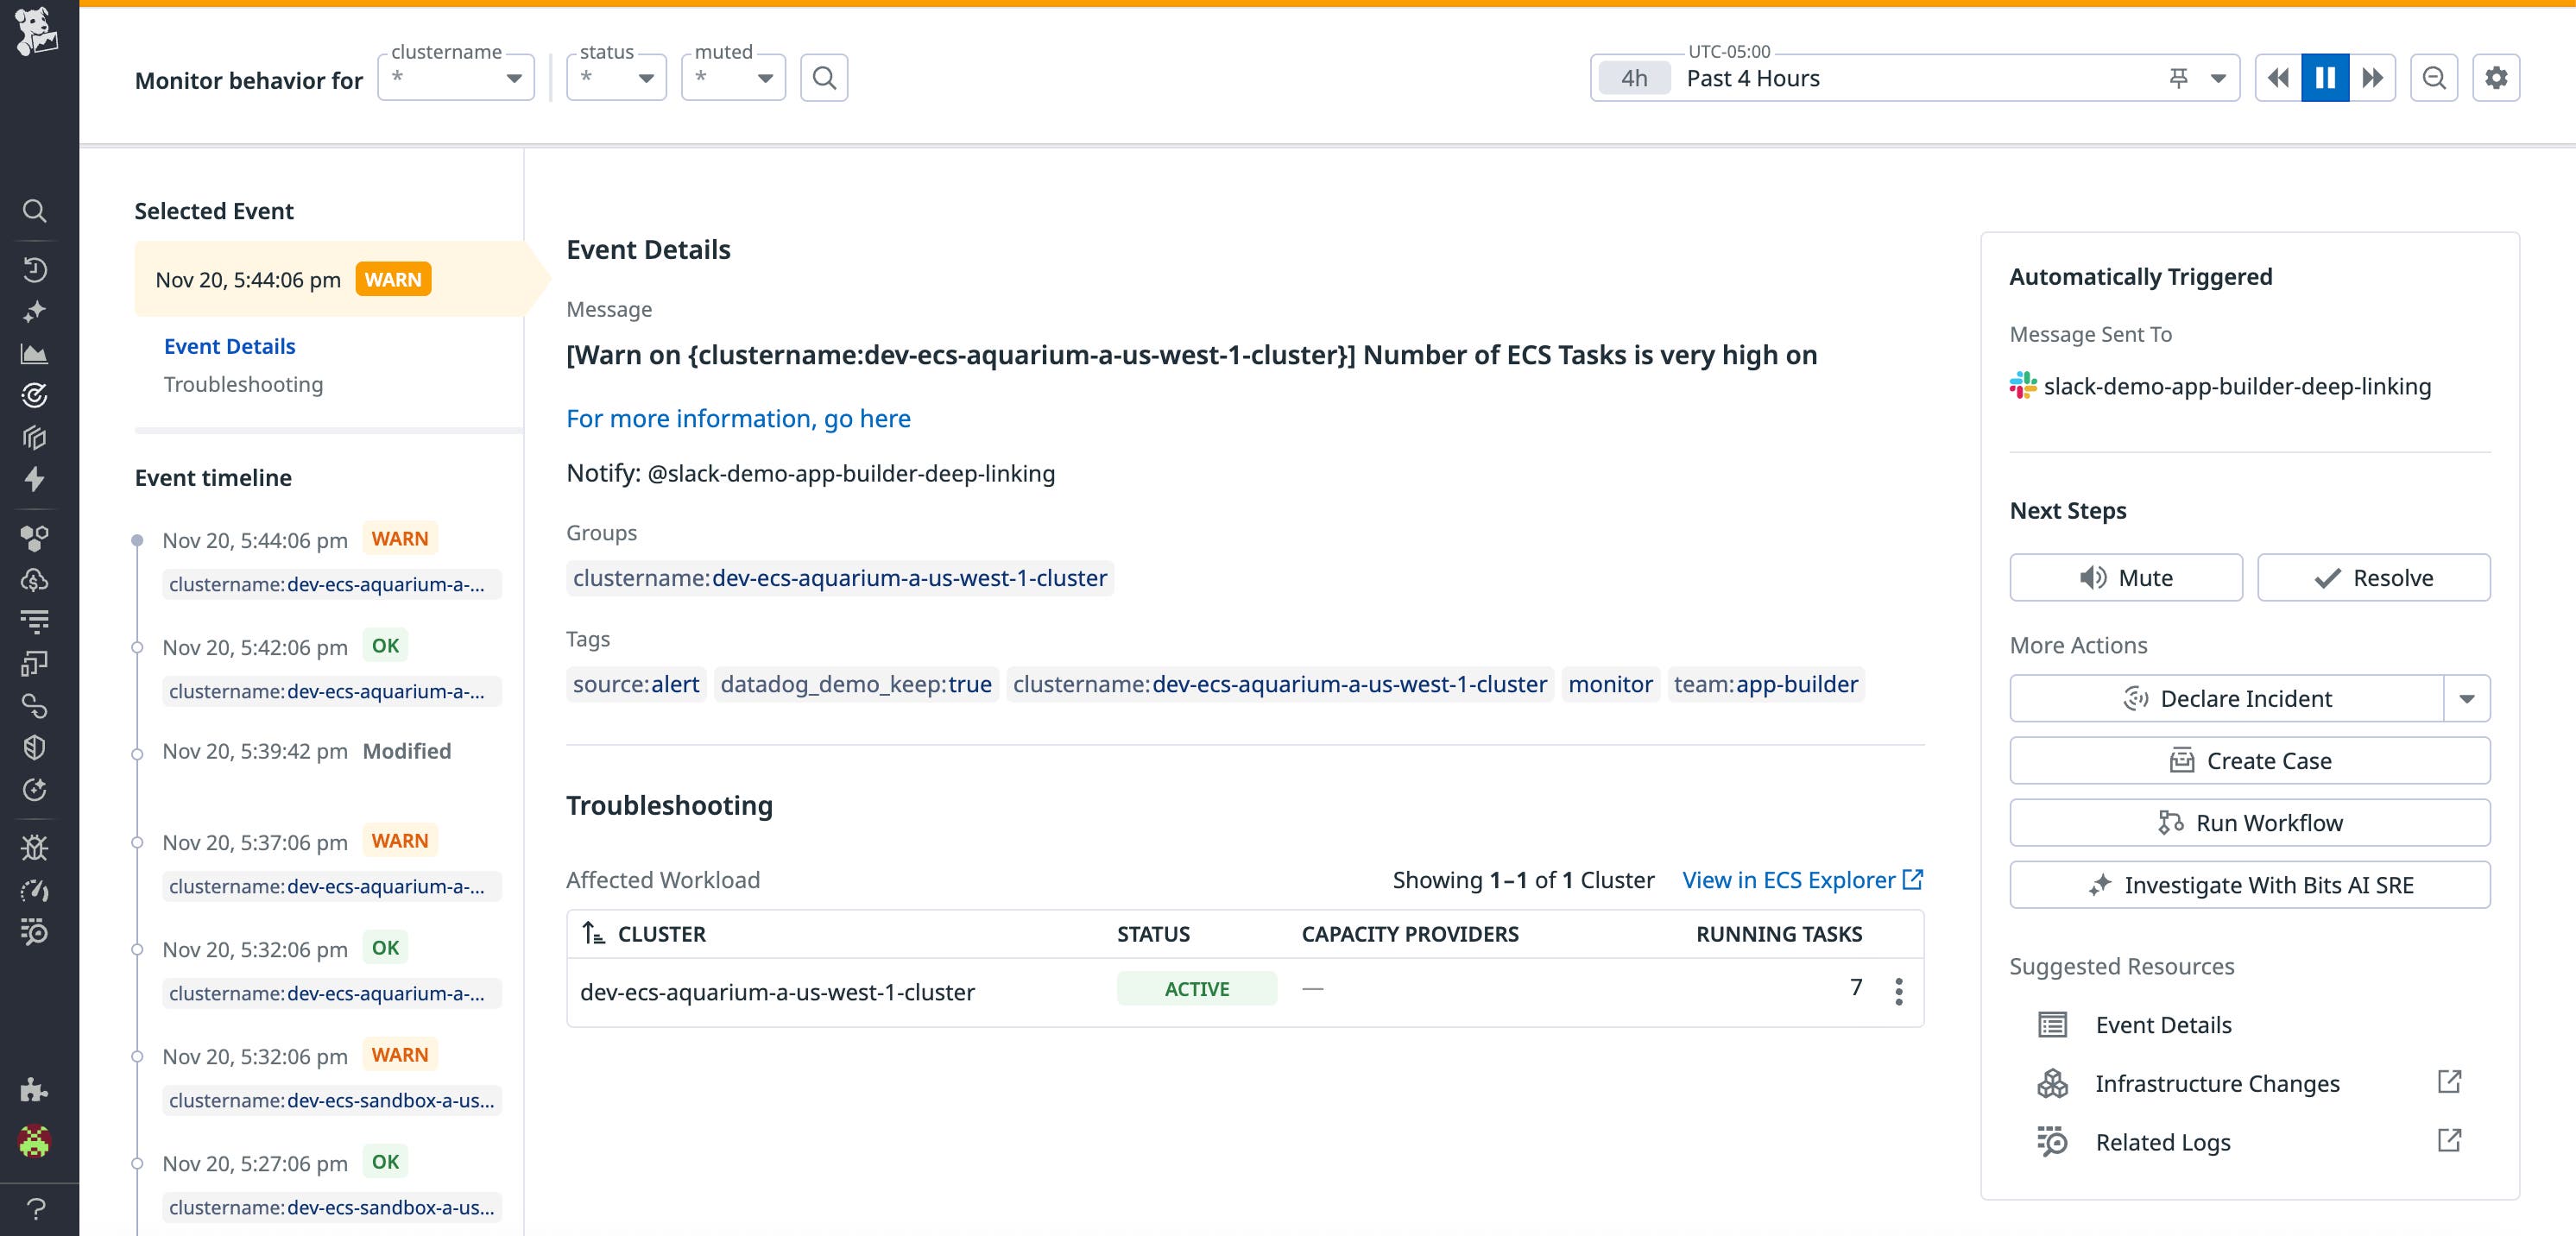
Datadog’s default monitors for ECS enable you to alert on common points of failure for your ECS tasks, such as exceeding resource thresholds, initialization failures, and differences between the number of actual and desired tasks running. When an alert that evaluates the state of your ECS tasks is triggered, Datadog will automatically identify affected workloads within the triggered monitor. Inspecting these workloads will bring you directly to the ECS Explorer, where your view will be scoped to telemetry corresponding to the affected workload.
Monitor your ECS environment with our OOTB dashboard
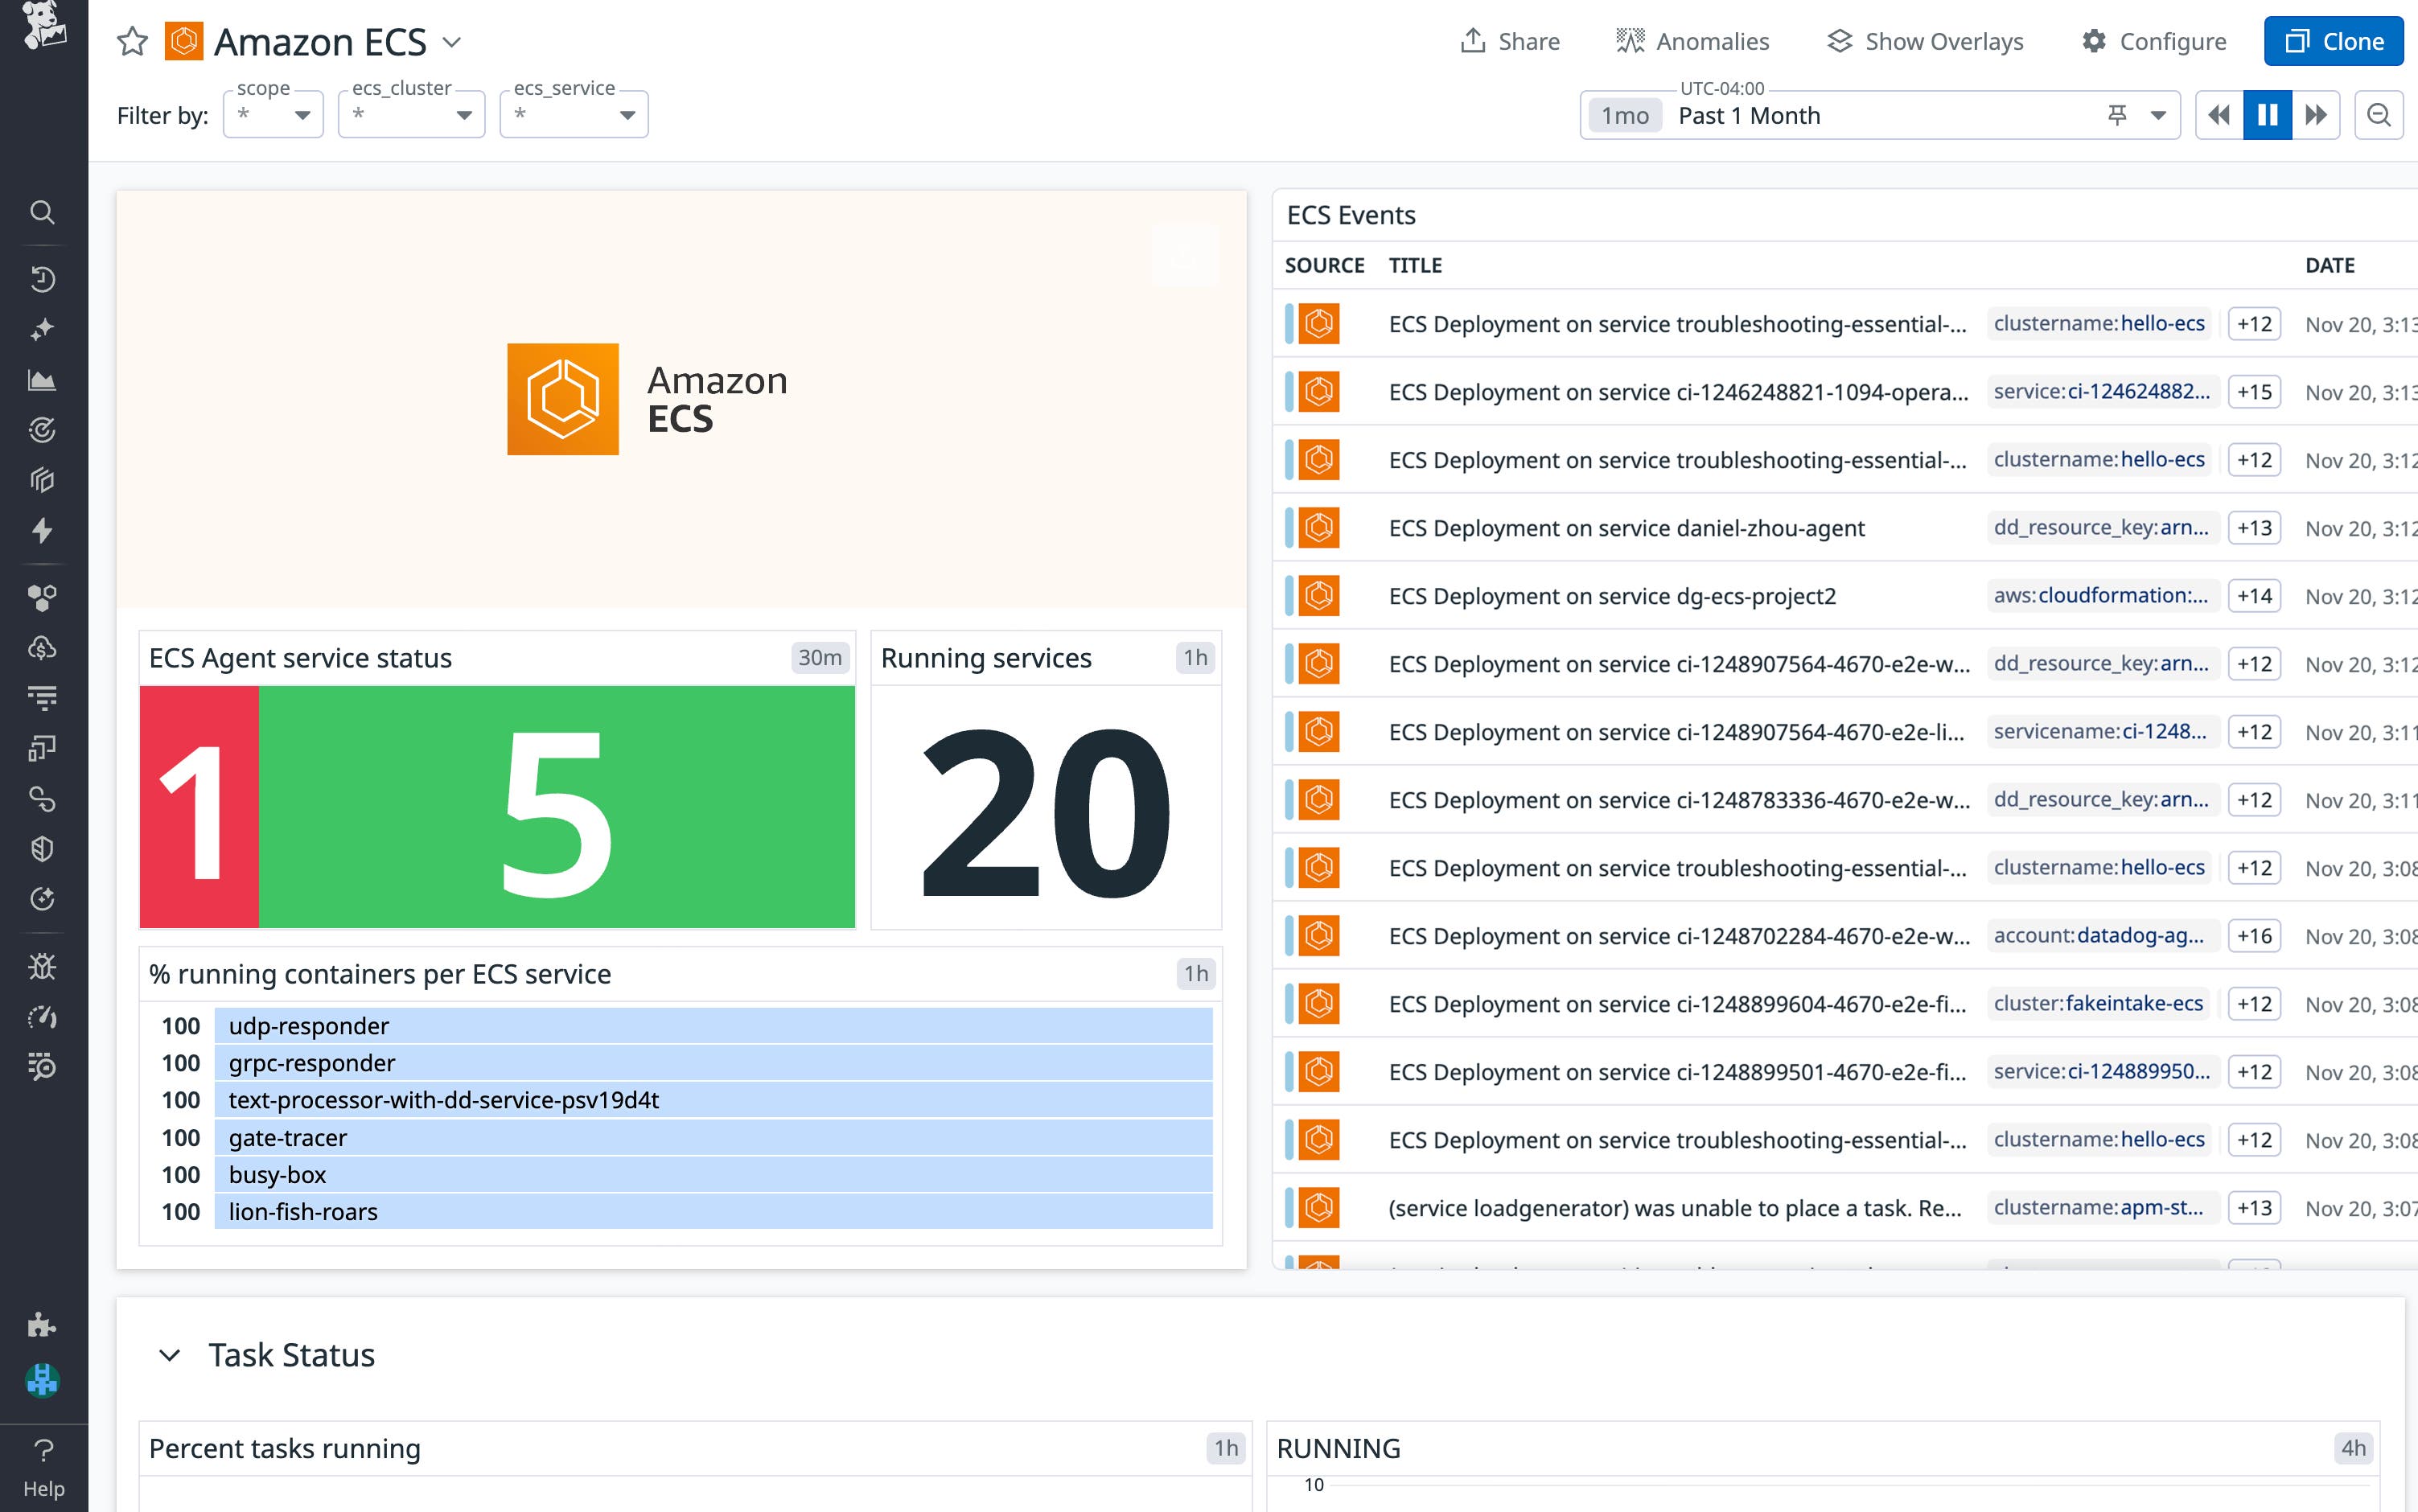
To jumpstart monitoring your ECS environment (including your ECS Managed Instances), Datadog offers an OOTB Amazon ECS dashboard. You can gain access to the dashboard by installing the Amazon ECS integration from its integration tile. Once installed, the dashboard gives you a high-level overview of your environment, including container statuses, pending task counts, and resource usage and utilization. You can scope the dashboard to specific services or clusters, or only your ECS Managed Instances, to home in on ECS services under your ownership or clusters pertaining to an ongoing investigation.
Improve visibility into your ECS workloads with Datadog
ECS Managed Instances provide a flexible, fully managed compute option for modern containerized workloads. With Datadog’s expanded support, you can monitor the health of these instances, understand their performance characteristics, and troubleshoot issues across your ECS environments using the same tools and workflows you rely on today.
To get started, visit our documentation for ECS monitoring. If you’re new to Datadog, sign up for a 14-day free trial.
