Addie Beach

Evgeni Wachnowezki

Siddharth Dwivedi
Modern distributed applications are composed of potentially hundreds of disparate services, all containing code from different internal development teams as well as from third-party libraries and frameworks with limited external visibility. Instrumenting your code is essential for ensuring the operational excellence of all these different services. However, keeping your instrumentation up to date can be challenging when new issues arise outside the scope of your existing logs. Additionally, adding custom telemetry often requires restarting or redeploying your applications, a lengthy process that can add days to your mean time to resolution (MTTR), increase the risk of system-wide outages, and leave observability gaps while you wait for processes to finish.
Datadog Dynamic Instrumentation enables you to instantly add logs to your code from the Datadog UI and start monitoring them with no restarting or redeploying your applications required. Within Application Performance Monitoring (APM), you can use the Dynamic Instrumentation interface to specify the method or line of code you want to instrument. The logs are immediately added to your application and you can start capturing diagnostic data right away. This enables users from across your organization to instrument any service with logs as soon as a need arises, without any impact to live services.
In this post, we’ll explore how Dynamic Instrumentation can help you:
- Easily capture crucial data without redeploying your apps
- Analyze app performance with enriched context
Easily capture crucial data at runtime
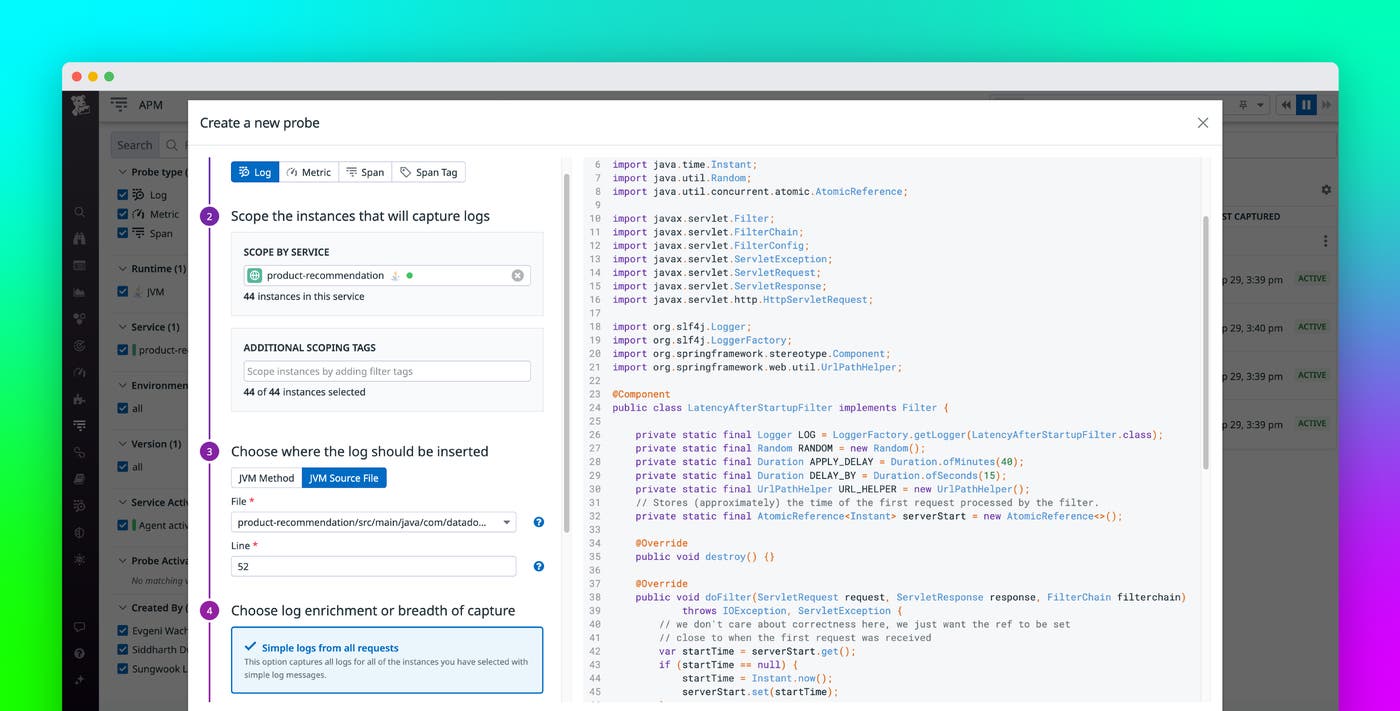
With Dynamic Instrumentation, any Datadog user with the right system and permission prerequisites can begin the troubleshooting process the moment an issue is detected, regardless of their development experience or familiarity with the application code base. You can add application logs directly from the Instrumentation page by creating a probe. Probes enable you to add instrumentation to your code without interrupting the runtime.
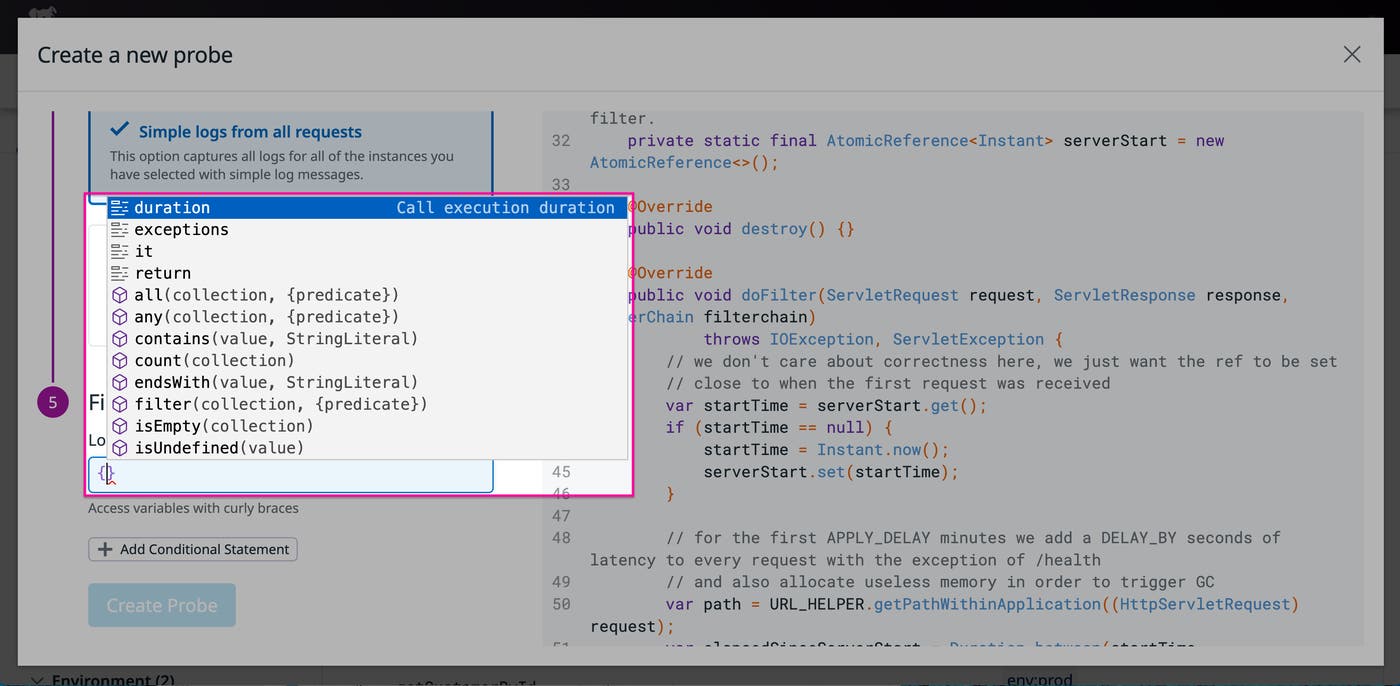
To add logs to your code by using Dynamic Instrumentation, you simply need to create a log probe and select the relevant environment, service, file, and lines of code. By using our source code integration, you can access the files you need to create the probe without ever leaving the page. You can also capture additional context for your logs via method parameters and local variables, as well as set conditions for when your logs should be generated.
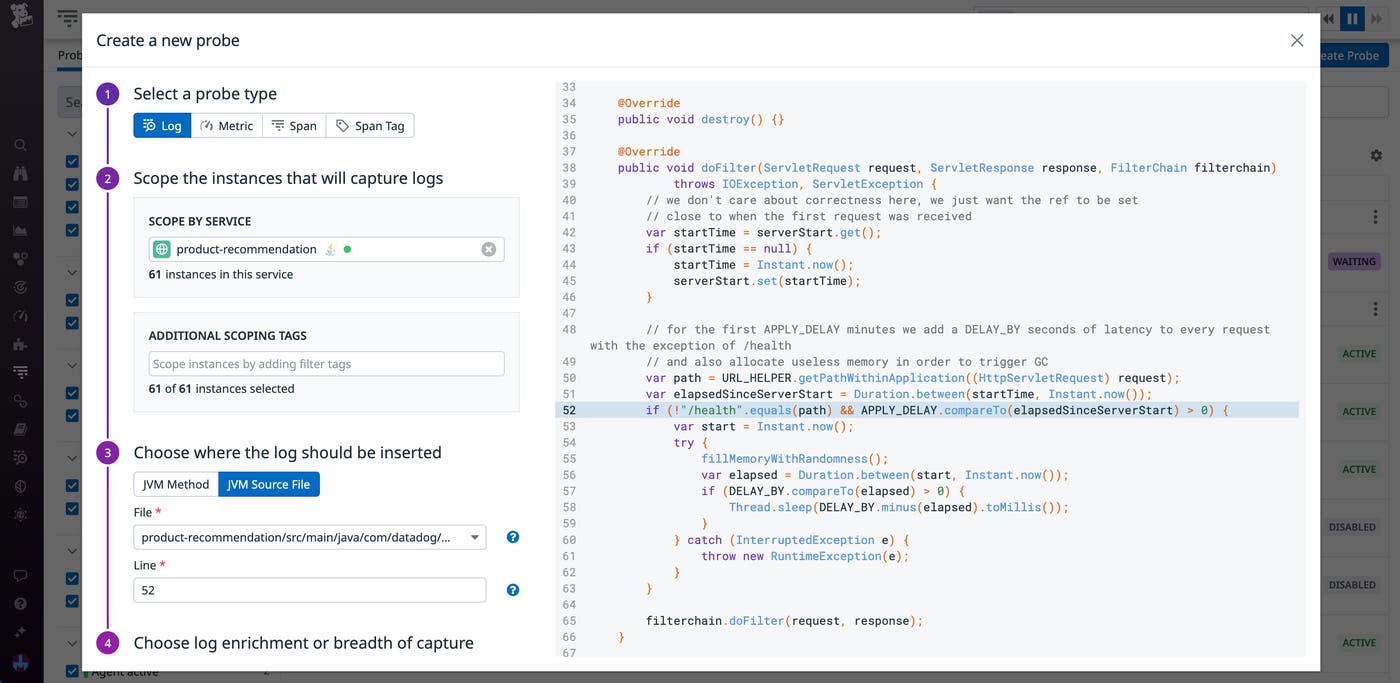
As soon as you add an identifying message to your log and create the probe, Datadog Log Management immediately begins collecting the relevant logs and organizing them for analysis.
In addition to minimizing system disruption, this enables you to add robust instrumentation to any application code without needing to contact the service owner to make changes. Let’s say you notice that a third-party library key to your application has recently been throwing errors that aren’t captured by any existing logs. With Dynamic Instrumentation, you can easily collect these error logs without reaching out to the service provider for guidance on changing the code. Simply specify the service related to the library and the problematic function when creating the probe.
Analyze app performance with enriched context
Because the logs captured via Dynamic Instrumentation are standard application logs (and are enriched as such), you can use tags and metadata to troubleshoot effectively within Datadog. Once the logs are captured by the probe, you can access them in Dynamic Instrumentation to view both additional context as well as details from the code itself, such as the stacktrace and related values. You can also jump directly to the log in Log Management to analyze more data, such as container and pod information.
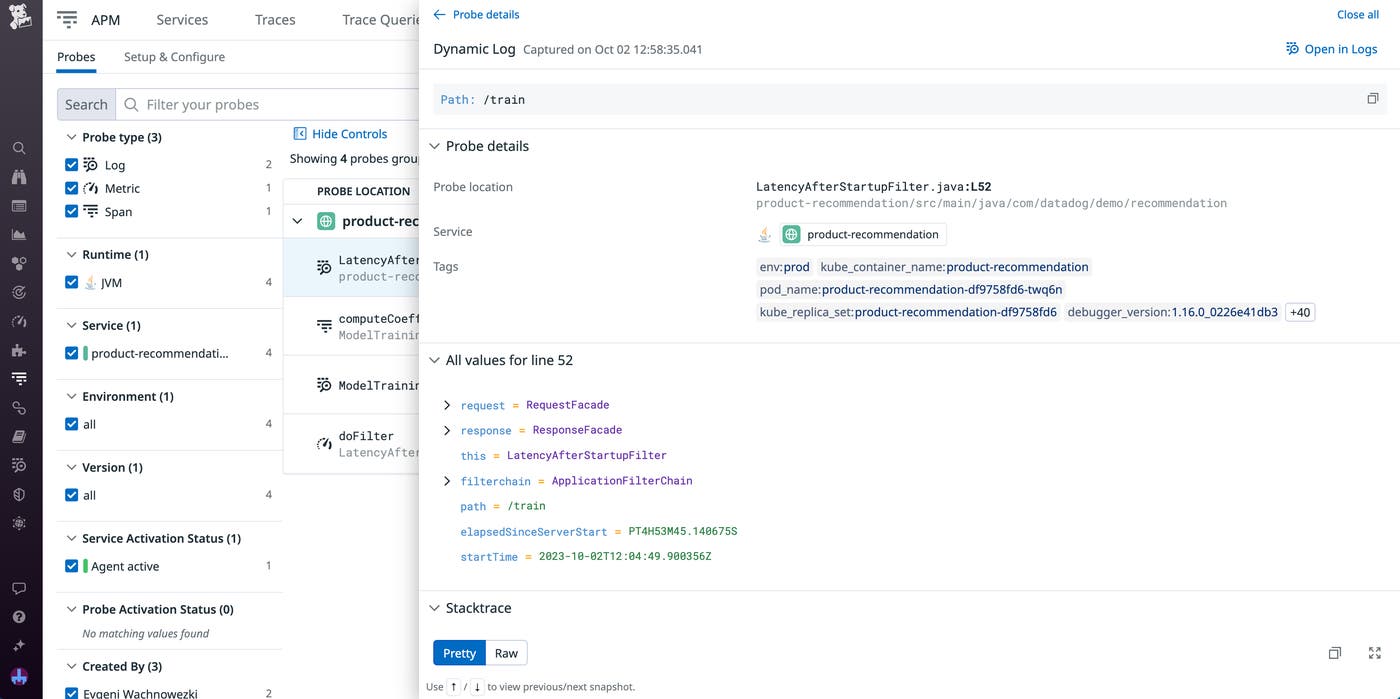
With this context, you can leverage Dynamic Instrumentation for temporary testing and problem solving in addition to long-term monitoring. For example, let’s say you want to determine whether a new method added to your code will impact the latency of your application. You can use Dynamic Instrumentation to add latency logging for both the old method and the new one by filtering your logs based on duration (shown below). Dynamic Instrumentation even enables you to specify the environment you’d like to gather logs from, making it easy to compare the current code in production against changes still in development. Once created, you can click the probes to access an overview of the latency logs for each method, helping you quickly identify any differences in performance.
Start using Dynamic Instrumentation for logs today
Datadog Dynamic Instrumentation enables you to easily add application logs to any section of your code, no matter the service owner or your technical knowledge. Additionally, by adding logs via the Datadog backend, you can update your monitoring strategy on the fly without needing to redeploy or restart applications. This helps you quickly close observability gaps and troubleshoot performance issues, all with minimal user impact.
You can use our documentation to get started with Dynamic Instrumentation. Or, if you’re not yet a Datadog user, you can sign up for a 14-day free trial.
