Bowen Chen

Scott Gerring
When developing software, the longer you intend to keep a system around, the more important it becomes to prioritize its code quality. But as more organizations move toward microservice architectures and adopt agentic AI and LLMs into their development workflows, many engineering teams have increased their emphasis on accelerating developer velocity, often at the expense of code quality. This can often result in code that fails to meet standards for performance, reliability, and security. Without quality control practices, the cost of remediating poor code can quickly outweigh any advances in developer velocity.
In order to create quality-testing workflows that can scale with AI-assisted development velocity, organizations need automation that decreases reliance on manual pull request (PR) reviews and human downtime. This can be achieved by shifting-left performance and reliability checks and best practices, so that issues in your generative code output can be corrected before they reach production environments.
In this post, we’ll walk you through real-world examples of issues found in a path tracer that we coded using Claude Code, and how different static analysis and dynamic analysis tools and techniques can help identify and address them. We’ll also discuss how agentic tools can be used in CI/CD to provide an additional layer of technical review.
Vibe coding a path tracer application
The extent to which a developer adopts AI into their workflows can vary greatly. In most cases, they’re likely using AI agents in tight feedback loops to deliver smaller-ticket items such as data preparation, boilerplate code, and other minor tasks. The most extreme case of agentic AI usage is “vibe coding,” an approach where the developer prompts an AI model to execute large tasks, such as building a complete system component or microservice and giving it control over all implementation details from start to finish. While this approach can exponentially decrease the manual planning and development time required of the developer, the resulting code generated is often not performant, accurate, or secure enough for production environments or to be used at scale. However, with the proper delivery guardrails in place, you might be able to correct generative code to meet your existing code quality standards.
Path tracers are a way of simulating the travel of light through a scene and are used often in the video game and movie industries. In our case, they also make for an interesting sample application for learning new tools. Path tracers tend to be much more complex than a generic REST API and require the use of more advanced language features (for instance, concurrent programming primitives), but the algorithms they use are readily documented. In addition, numerous sample repositories are available on the internet, which ensures that AI agents have sufficient reference material. And because path tracers model physical lighting that we’re familiar with from photographs, videos, and animations, we’re able to visually check whether the application is roughly functioning as intended or if it is broken.
The examples we’ll showcase in this post are taken from a path tracer that we vibe coded in Rust using Claude Code running the Claude 3.7 model. When vibe coding our path tracer, we gave Claude the following technical constraints:
- Core Module (
src/core/): vector math, ray definitions, intersection data structures - Camera Module (
src/camera/): camera models, ray generation from camera - Scene Module (
src/scene/): scene objects, primitives, mesh structures, and more - BRDF Module (
src/brdf/): material reflection models and light interaction - Renderer Module (
src/renderer/): path tracing implementation - Integrator Module (
src/integrator/): Monte Carlo integration for light paths - Parser Module (
src/parser/): scene description file parser - Main Module (
src/main.rs): CLI handling and orchestration
From here, we reviewed each project plan module-by-module with a hands-off approach, only verifying that the code compiled before committing. After committing over 5,000 lines of source code generated by Claude, we arrived at a working path tracer that successfully rendered images. The image below was rendered over 20 hours.

How we fixed generative code that was almost correct, but not quite
Through vibe coding, we were able to produce a working path tracer—but out of the 5,000 lines of generated source code, how many would be usable in a production environment? The automated checks we used fall into two broad categories:
- Static analysis: linters, type checkers, proof checkers, safety checkers, and more
- Dynamic analysis: benchmarking and profiling
In this section, we’ll take a closer look at issues within the source code generated by Claude and how the delivery guardrails in these two categories can help teams address problems in their AI-assisted code earlier in the development life cycle.
Static analysis guardrails
Static analyzers detect rule violations in your source code prior to runtime. You likely already use linting, a type of static analysis that can detect and correct style, formatting, and common bugs, since it’s built into most IDEs and language toolsets. But integrating other external static analyzers into your workflow can help you catch deeper semantic issues specific to your programming language, simplify code complexity, and even catch code that can degrade performance. For example, Clippy, the standard static analysis tool for Rust, provides lint groups for several categories of code issues, gives context into the potential impact of a lint violation, and suggests how to fix it.
After we vibe coded our path tracer to a functional state, we ran Clippy on our source code to surface any code quality issues. Normally, when deciding when to incorporate static analysis into your development life cycle, it’s a good idea to run analyzers such as Clippy during local development to create tight feedback loops, and then configure the same rulesets within your CI/CD pipeline as a final delivery guardrail.
In the example below, Claude needed to write a function that generated a random axis (x, y, or z). Claude chose to represent the axis using integer values of 0, 1, and 2. However, Rust does not have a built-in random number generator in its standard library (the community has settled on the ‘rand’ library). Claude’s solution was to create a mutable static variable COUNTER that is incremented upon each all of rand_axis() using an unsafe block.
fn rand_axis() -> usize { static mut COUNTER: usize = 0;
unsafe { COUNTER = (COUNTER + 1) % 3; COUNTER }}Not only is this function not truly random, by using a static mut, we risk creating data races if the function is called by multiple threads. The code within our unsafe block enables us to concurrently update COUNTER without synchronization; this violates Rust’s core aliasing tenets and risks undefined behavior and potential memory corruption. In practice, the data race actually contributes to the semi-randomness of our counter, but this kind of malpractice is a perfect example of bad code quality that we should address. Clippy detects this issue and warns us of the following:
warning: usage of `static mut` is discouraged --> src/main.rs:1:1 |1 | static mut COUNT: usize = 0; | ^^^^^^^^^^^^^^^^^^^^^^^^^^^^ help: consider using a `Mutex` or `AtomicUsize` instead | = note: `#[warn(clippy::use_self_static_mut)]` on by defaultWe also found several instances where the code that was generated was close to being correct but fell just short. This was often due to implemented functions and capabilities that the code simply never called upon. To help catch these cases, we made use of the Rust compiler’s dead_code lints to detect instances of unused functions or fields. Using these dead code compiler warnings, we were able to discover incomplete implementations such as the code below, which includes a fuzz field in our Metal construct that adjusts the roughness of the metal’s reflection. However, in our code that instantiates a metal object, we forgot to write code to actually read this field.
warning: field `fuzz` is never read --> src/scene/material.rs:52:5 |50 | pub struct Metal { | ----- field in this struct51 | albedo: Vec3,52 | fuzz: f64, // Controls roughness of the reflection | ^^^^In another case of dead code, Claude implemented a bounding volume hierarchy (BVH), a way of subdividing a scene to make ray casting much faster. This is more than a minor performance optimization, as ray tracers that do not use a BVH or similar technique are unusably slow. However, the constructor in our code never actually calls the function to create a BVH. Claude had realized that the application needed a BVH, implemented one, and then simply never used it. While this doesn’t directly impact our output image, we can drastically reduce the cost and rendering speed of our application by simply connecting the dots and ensuring that our path tracer uses the BVH code.
warning: associated functions `new` and `build_node` are never used --> src/scene/bvh.rs:24:12 |22 | impl BVHNode { | ------------ associated functions in this implementation23 | /// Create a new BVH from a list of primitives24 | pub fn new(objects: Vec<Arc<dyn Primitive>>) -> Self { | ^^^...29 | fn build_node(objects: Vec<Arc<dyn Primitive>>) -> Self { | ^^^^^^^^^Dynamic analysis guardrails
Static analysis guardrails can help us fix our code’s correctness and semantics, but it doesn’t always guarantee that our code will be performant. The code snippet shown below is from our generated path tracer application, and it creates a shared progress reporter responsible for tracking the rendering progress of our image (for example, the percentage of pixels that have been rendered relative to the completed image).
impl SharedProgress { /// Create a new shared progress reporter pub fn new() -> Self { Self { reporter: Arc::new(Mutex::new(ProgressReporter::new())), } }
/// Update progress pub fn update(&self, progress: f64) { if let Ok(mut reporter) = self.reporter.lock() { reporter.update(progress); } }}Pixels are divided across a set of worker threads in order to leverage the full power of the CPU. Each time a worker thread finishes rendering a pixel, it calls this update function, which must then acquire a mutex in order to update the shared progress reporter. As you might expect, this was an incredibly slow method that frequently resulted in lock contention while the code waited for the mutex to become free, rather than rendering more pixels. Static analysis tools likely won’t flag the code above, since the tools and rulesets the code is being evaluated against don’t have context into how frequently the update function is being called, and they also don’t know if this is a sensible use of resources for the given problem domain.
After we corrected our code to the point where we had a working application, its runtime was far greater than expected, so we had to take a deeper look into its performance and, in this case, the host system’s resource usage. While rendering, the host’s CPU was at 100 percent utilization, which is typically optimal when running highly parallel tasks such as those required in path tracing. However, upon taking a closer look, we noticed that 85 percent of that time was spent in the kernel, which was unexpected, since a path tracer shouldn’t need to do kernel-related tasks (e.g., reading and writing files or performing network I/O). This information helped us quickly surface that there was a mutex lock issue.
In this case, a bit of domain knowledge combined with investigation helped us surface this issue, but if you’re frequently deploying code changes, it can be easy to tunnel-vision on passing existing CI/CD checks and overlook performance degradations. Continuous profiling of your production environment using the Datadog Continuous Profiler or other profilers can help you monitor how a recent deployment affects the performance of your application by comparing profiling snapshots taken before and after the deployment to identify how changes to your methods impact CPU, wall time, memory allocation, and more.
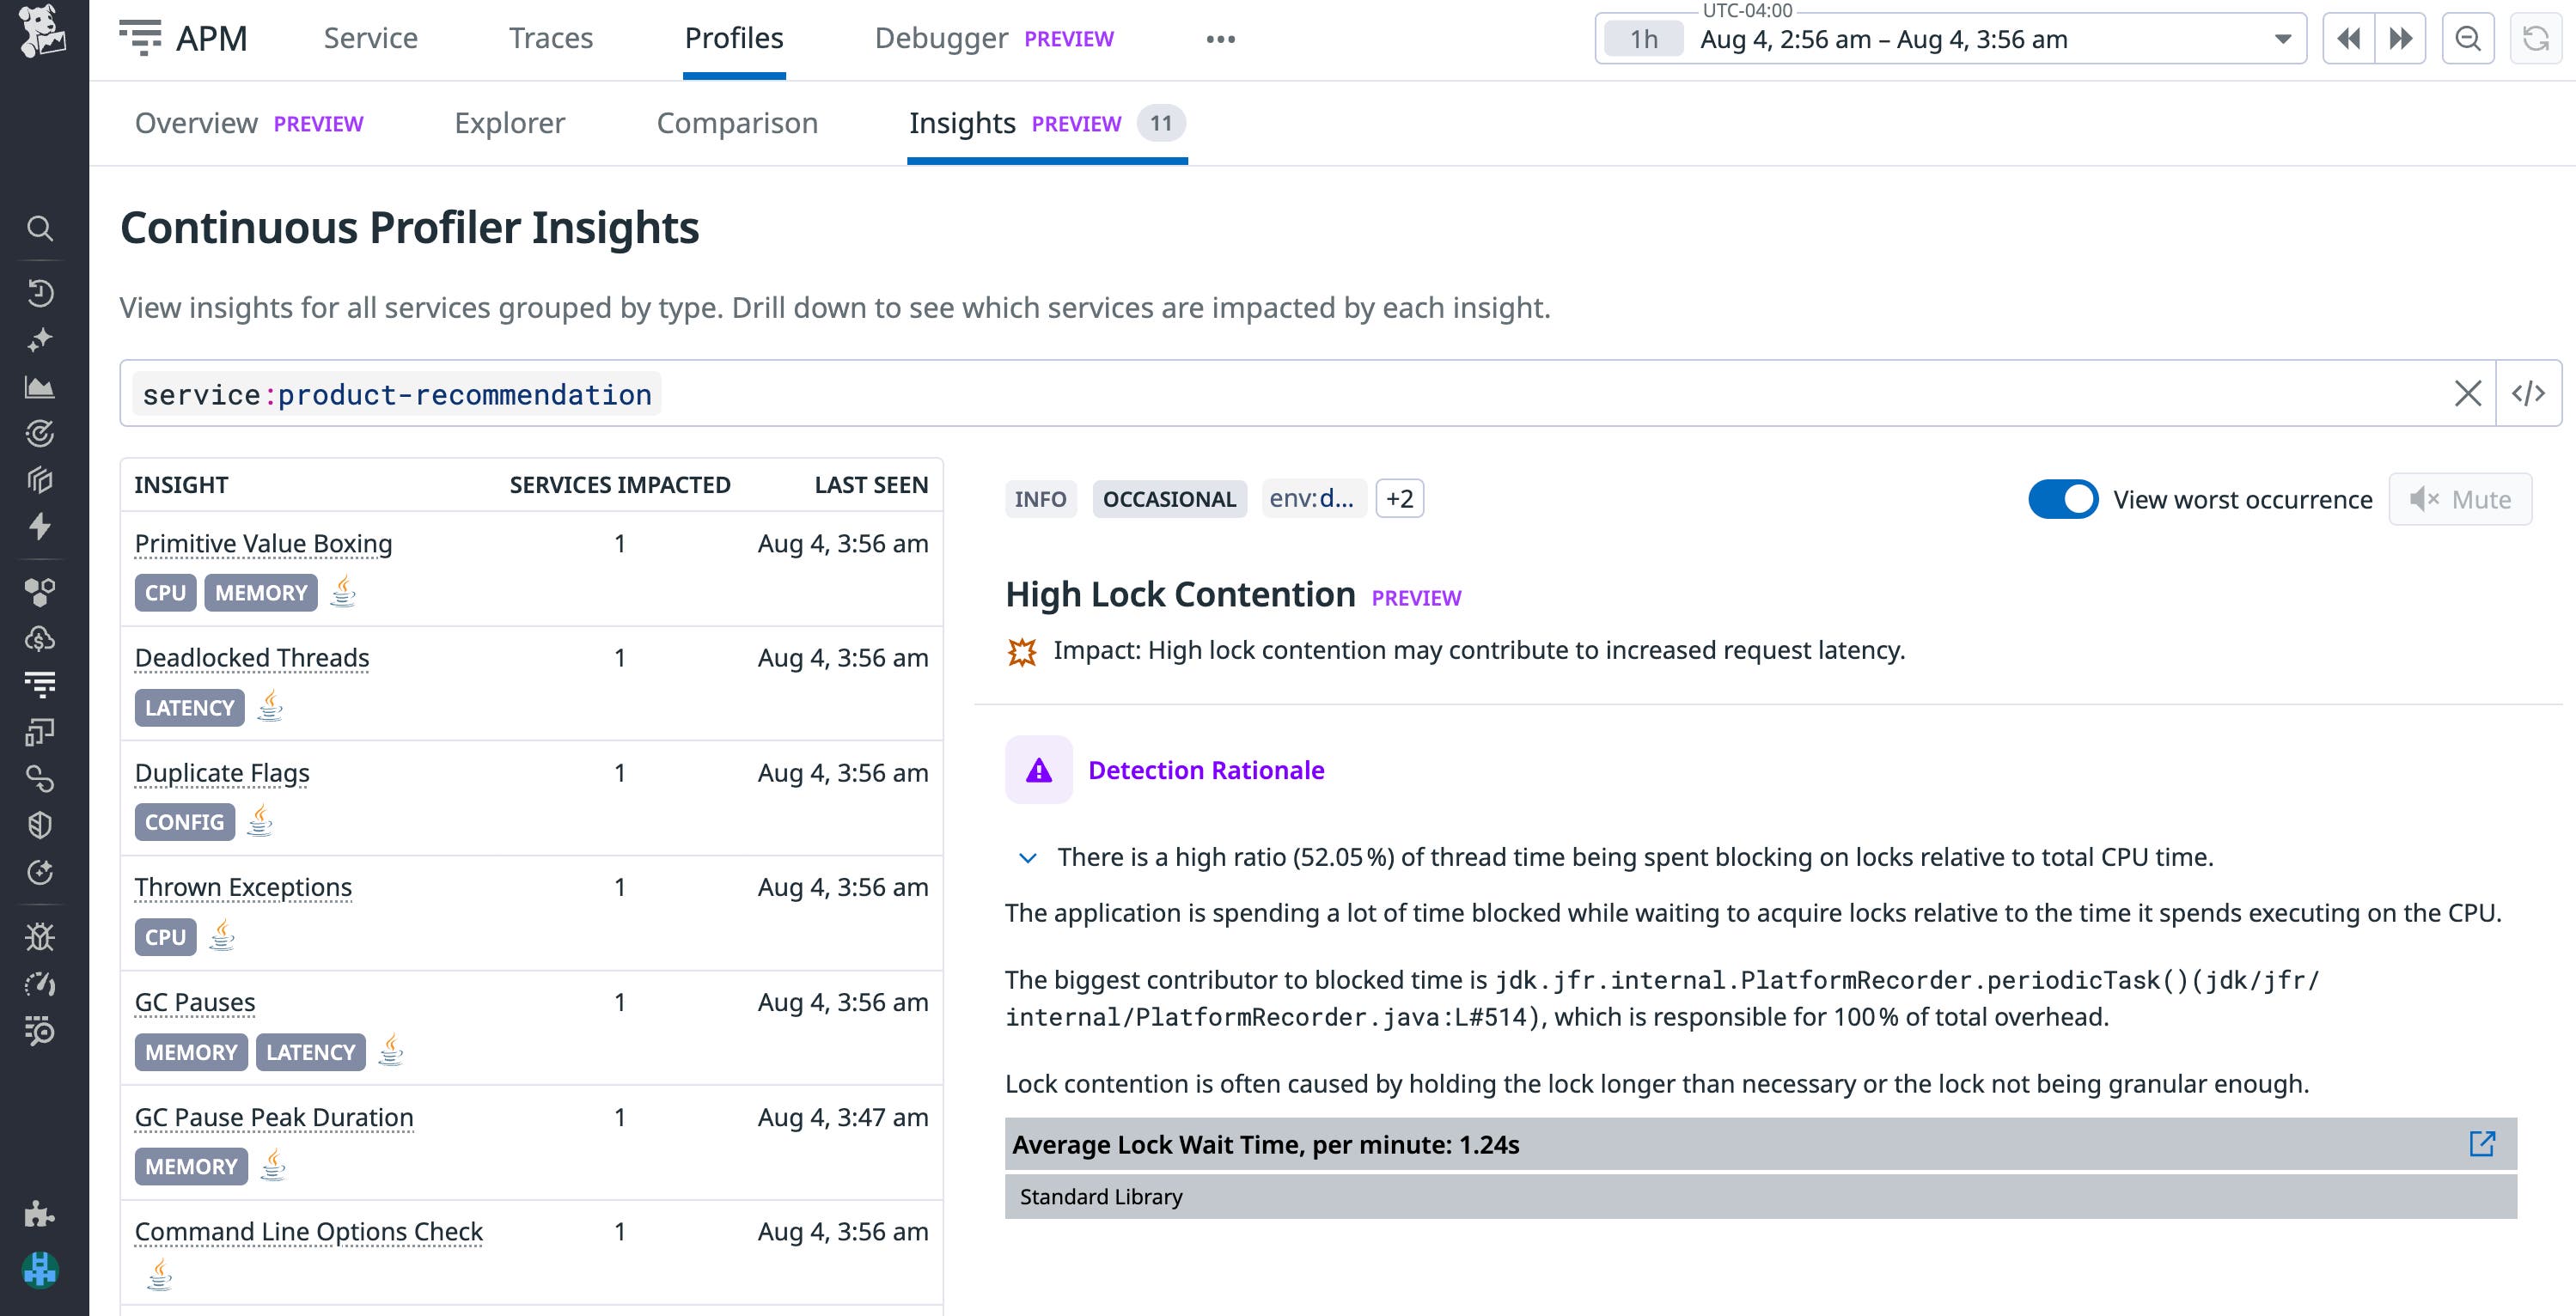
Investigating code profiles and understanding if your code is spending time on the wrong tasks requires solid knowledge of both profiling and how your system is intended to behave. Continuous Profiler Insights (available in Preview) automatically surfaces common issues such as high lock contention (as we saw in the mutex code example), deadlocked threads, primitive value boxing, and how the issue was detected, as well as next steps for remediation. Identifying these issues by hand can be quite difficult and requires a level of familiarity with profiling tools that many developers are not comfortable with; Insights makes this process faster and more accessible for less experienced developers.
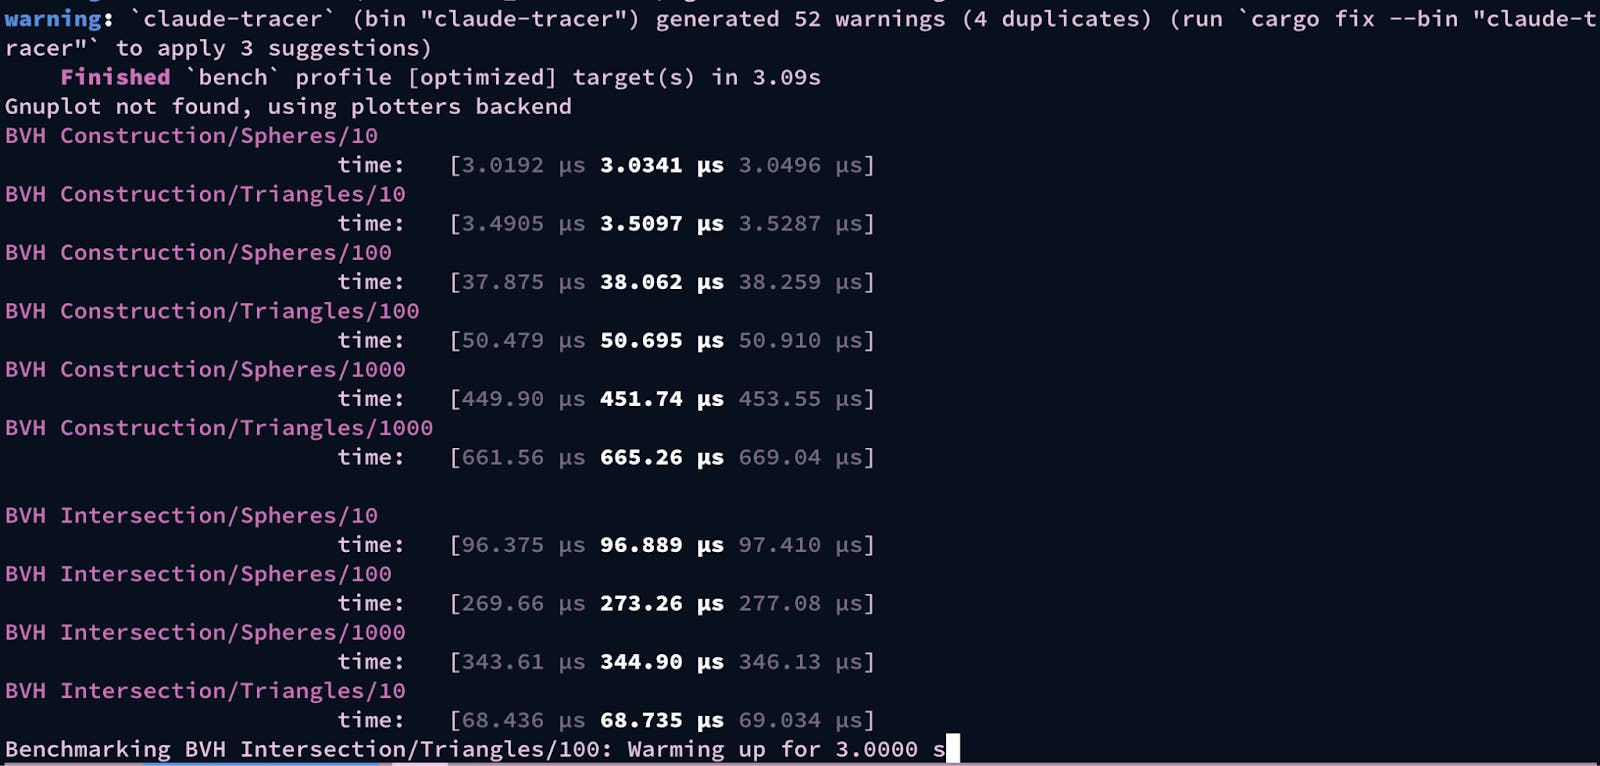
While profiling is critical for collecting performance insights and tracking long-term performance trends, it doesn’t help you establish performance guardrails to catch degradations before they reach production. To do this for performance-critical code such as our path tracer, we suggest adding a microbenchmark suite, such as Criterion or Rust’s built-in benchmarking tests. By running the benchmark code over hundreds of sample runs, microbenchmarking helps you measure performance with higher confidence and makes it easy to run comparisons against your current run, so you can gain quick insights into whether your code changes are improving code performance or causing regressions.

Revisiting our path tracer example, BVH is a perfect example of code that would benefit from being wrapped in microbenchmarks. Using a BVH for path tracing comprises two high-level steps:
- Building the BVH: In static scenes, this only occurs once during initialization or loading. During this process, objects in the scene are organized into a nested tree structure.
- Traversing the BVH: This occurs each time a ray is cast during rendering, which can occur billions of times when rendering a scene. The path tracer uses this algorithm to find the closest object in the path of a ray.
Since there is no universally optimal method for either step, adding benchmark tests to these code blocks enables us to weigh the performance of different build and traversal algorithms in local development to optimize both startup latency and overall frame time. By tracking benchmarks during local development and integrating their runs into our CI, we can shift left and catch performance regressions for performance-sensitive code before it reaches production. For example, this includes the BVH traversal algorithm, where the difference of microseconds can result in drastic increases in frame time.
How AI tools can create additional delivery guardrails in CI/CD
While you may be more familiar with using agentic tools for development, many AI products now support AI capabilities for agentic code review and context resolution. For example, you can use GitHub Copilot to review PRs. Copilot will provide a summary of the changes requested and comment on any issues it detects. By providing Copilot with a markdown file of instructions, you can guide its review to adhere to your organization’s internal security guidelines or focus only on specific facets while ignoring others.
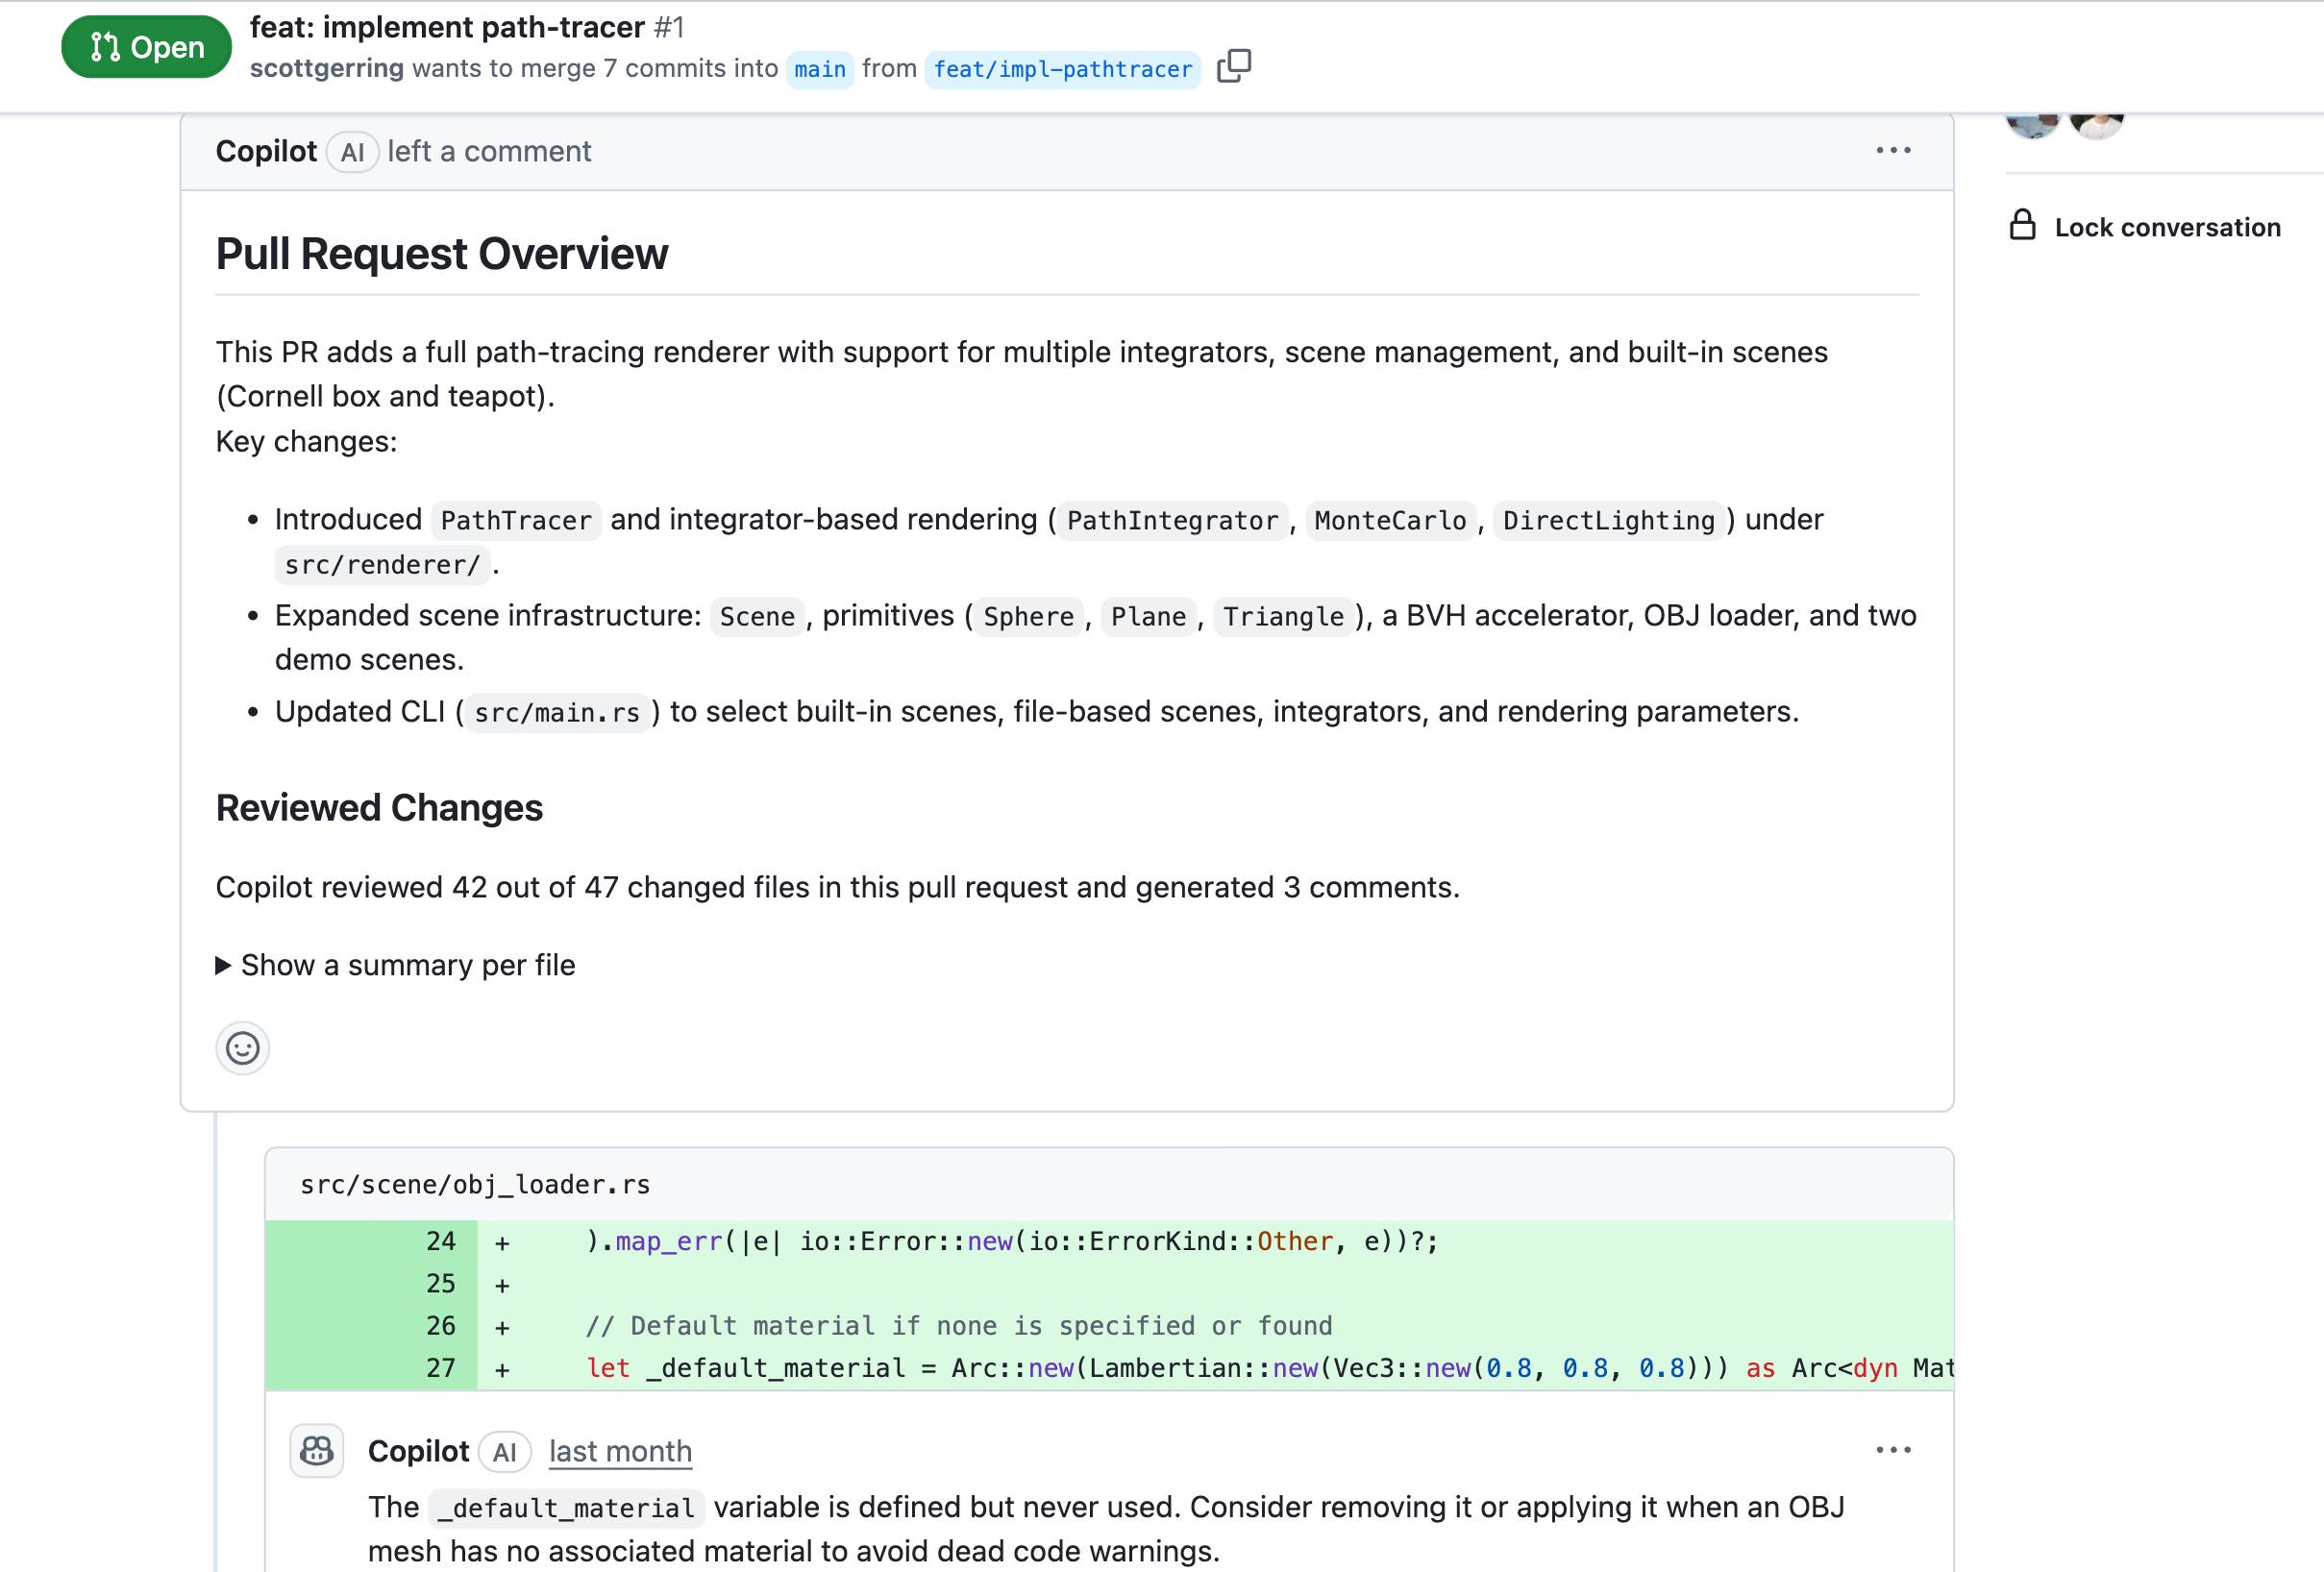
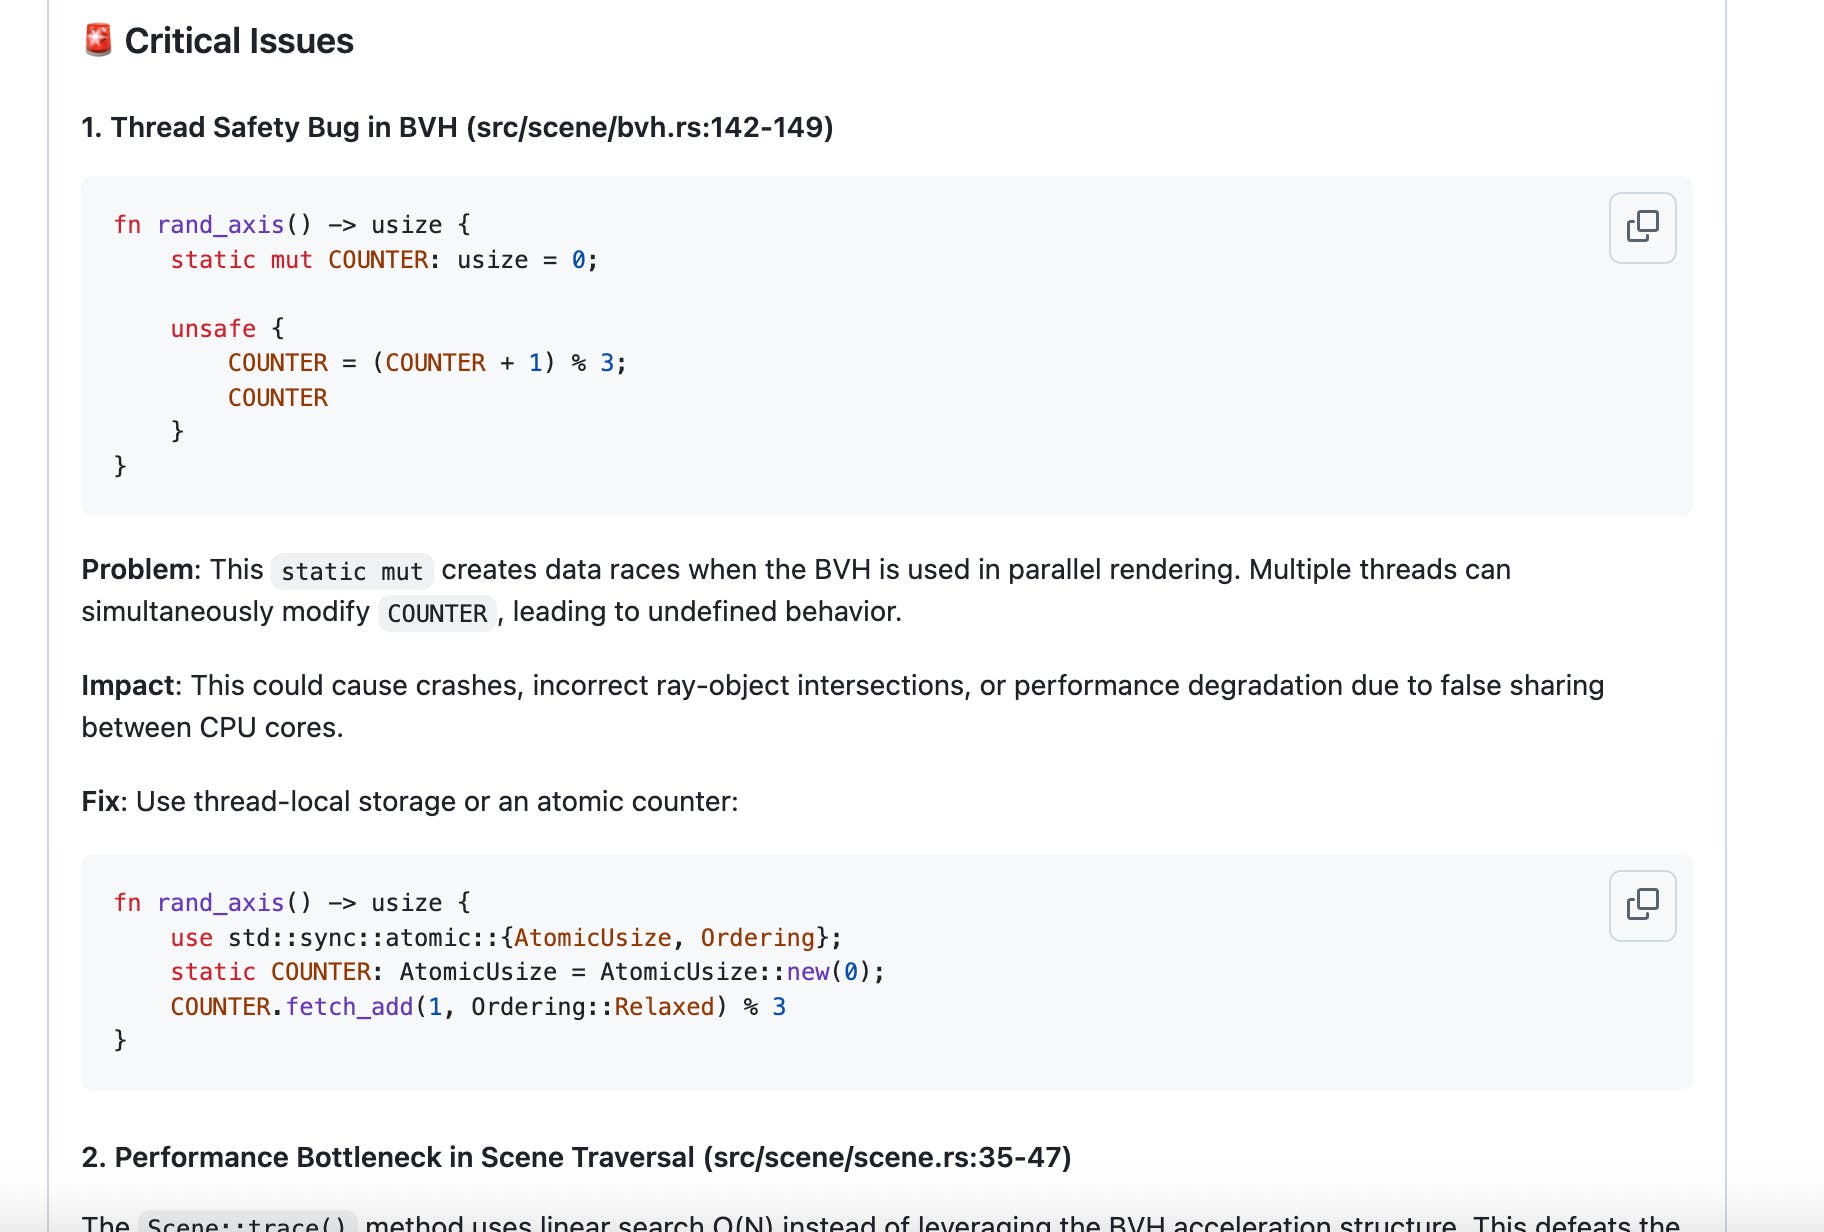
In the case of our path tracer application, we can also use Claude code as an investigative tool to help us uncover issues in our PR. For example, after opening a PR, we asked Claude the following:

In response, Claude was able to identify several of the issues we’ve discussed in this post, and the agent suggested fixes for these problems. Even though, of course, it was Claude that generated these issues in the first place! While we aren’t suggesting you replace manual PR reviewers with AI reviewers, using tools such as Copilot and Claude to conduct automated PR reviews can help you shift-left much of the detection and investigation that needs to be done before your code reaches peer review.
Keep code quality top of mind when developing with AI
In this post, we covered a few examples of poor code in a vibe coded path tracer application that we were able to detect and address using static analysis tools, profiling, and benchmarking. Regardless of how heavily you leverage AI-assisted coding tools to complete your daily tasks, we hope that you’ll consider some of the practices recommended in this post. If you’d like to learn more about how to use agentic AI and LLMs more effectively, check out our blog post on AI usage tips from Datadog engineers and our best practices guide for building an LLM evaluation framework. In a followup post, we’ll cover security guardrails that can help you ensure that your code is secure and compliant prior to delivery.
If you don’t already have a Datadog account, sign up for a free 14-day trial today.


