Michael Richey
A loss in infrastructure and applications observability can leave SRE and DevOps teams without insight into the real-time state of their production systems, causing them to temporarily pause code deployments and limit their ability to troubleshoot issues or respond to critical alerts. In modern cloud environments, where services are distributed and deeply interconnected, this lack of visibility can escalate quickly. A failure in a shared dependency—such as a managed database or object store—can cascade across multiple services and regions, amplifying system downtime and user disruption. Without continuous telemetry data and system health signals, teams may struggle to make informed decisions during high-stakes incidents impacting their business and end users.
These types of failures aren’t theoretical—we’ve seen them firsthand. Following our March 2023 outage, we launched a company-wide initiative to improve regional isolation across Datadog sites. But even with those investments, dependencies on third-party providers can introduce availability risk. In a more recent example, a Google Cloud outage affected customers who stored all of their Datadog telemetry data in Google Cloud regions, highlighting how reliance on a single provider can create unanticipated blind spots during incidents.
Our customers have asked how they can continue observing their systems using Datadog during service disruptions. Datadog Disaster Recovery (DDR), now available in Preview, addresses this need by allowing organizations to fail over to an alternate, unaffected Datadog site. This helps preserve visibility and telemetry data continuity when their primary site is impacted.
In this post, we’ll walk through how DDR helps organizations maintain observability during infrastructure disruptions, along with practical steps on how to get started.
Active-Active: A traditional but expensive approach to disaster recovery
For their most critical services, some organizations adopt an active-active architecture that distributes application traffic across multiple cloud providers and geographical locations. This approach ensures service continuity during a provider outage by allowing applications to remain responsive through alternate regions. To support a similar level of resilience in observability, the Datadog Agent can be configured to forward telemetry data to multiple Datadog sites, enabling active-active observability.
An example Datadog Agent configuration for shipping telemetry data to multiple Datadog sites requires Agent version >= 6.17 or 7.17.
In datadog.yaml:
additional_endpoints: "https://app.datadoghq.com": - apikey2 "https://app.datadoghq.eu": - apikey3Datadog is configured this way internally. During the June 12, 2025, Google Cloud outage, we continued to receive telemetry data and alerts from Google Cloud-based services through our non-Google Cloud sites. While this approach offers the highest level of resilience, similar to the active-active approach at any layer of infrastructure, it can be expensive and operationally complex. Organizations may not be able to justify the return on investment for active-active architecture and determine that a different, more cost-effective approach is better suited to their needs.
DDR enables Active-Passive observability
As an alternative to the highly resilient but expensive active-active architecture, many organizations opt for an active-passive design. In this model, a primary system handles all requests under normal conditions, while a secondary system remains on standby and takes over only during a failure. With DDR (our active-passive observability solution), customers can maintain infrastructure and application visibility during cloud provider region outages by pre-configuring Datadog Agents and integrations to redirect telemetry data to an alternate, geographically distant Datadog site. This helps customers preserve observability without the cost and complexity of an active-active setup.
Active-Passive observability configuration
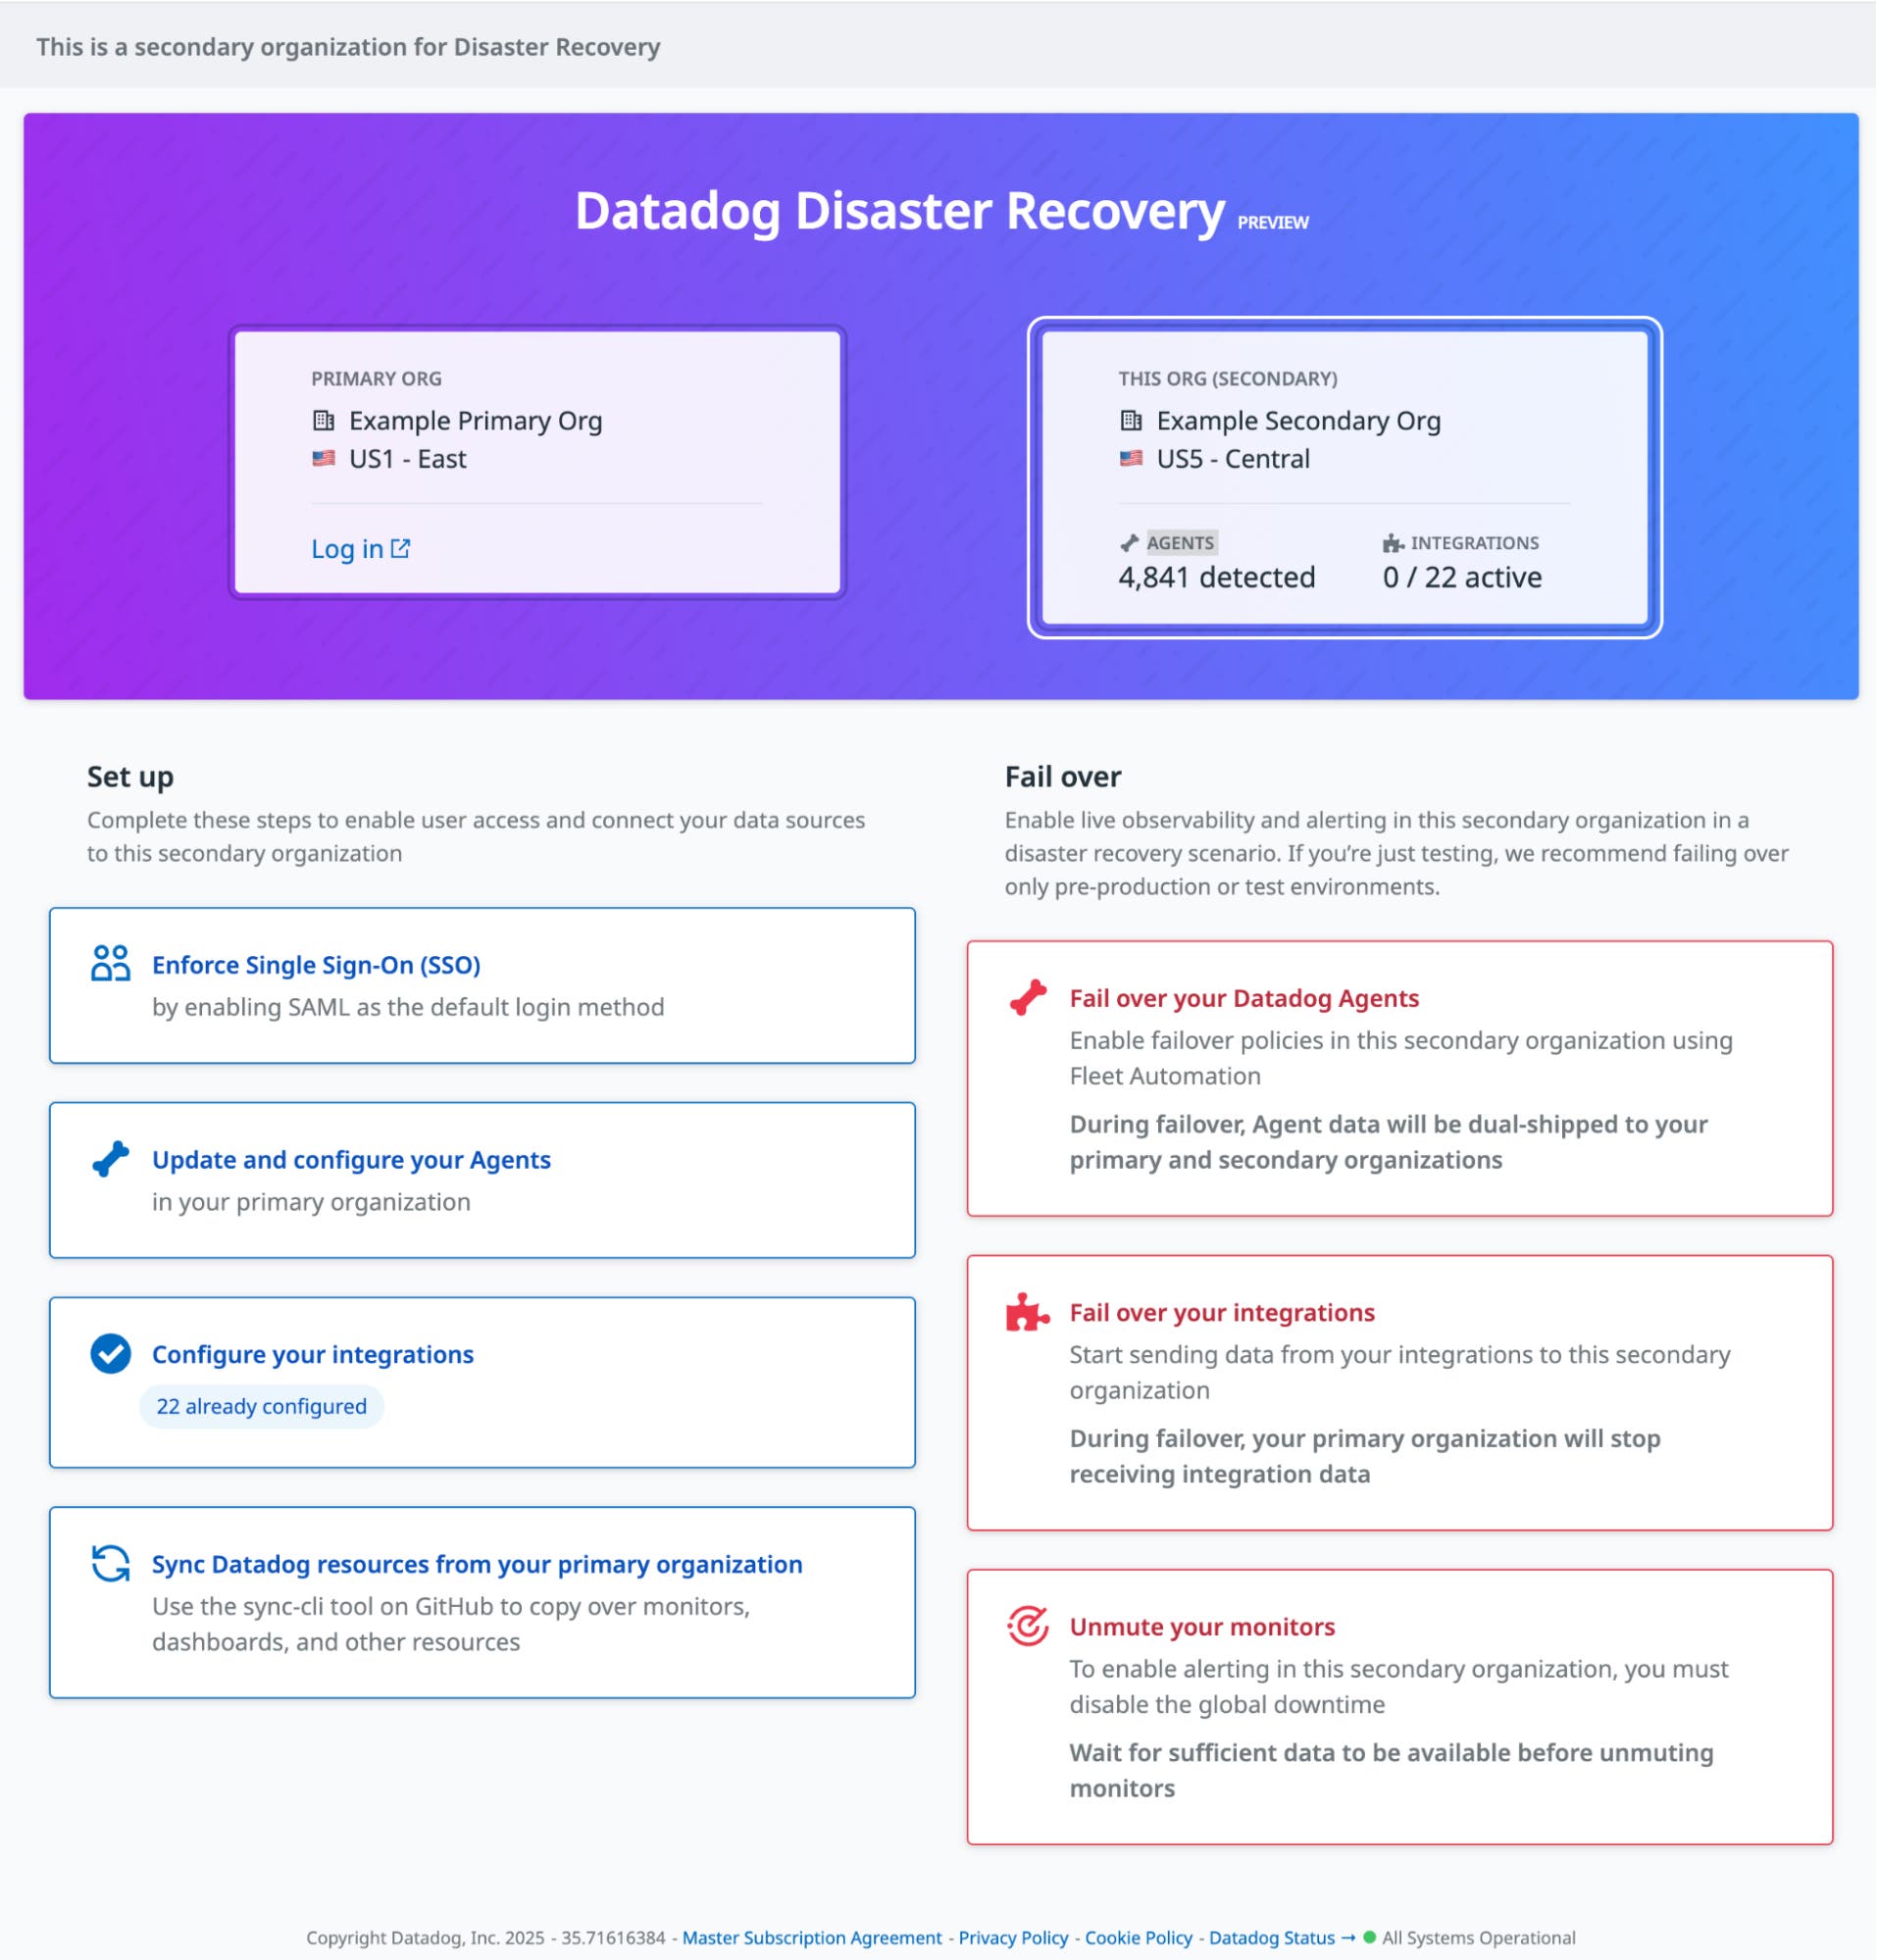
After joining the DDR Preview, customers provision an account on a secondary Datadog site to serve as their passive or secondary observability endpoint. Using the Datadog API and their active site’s API and Application Keys, they can securely authorize the secondary site to receive Datadog Agent telemetry data in the event of a failure.
To replicate Datadog resources (i.e., dashboards, monitors, etc.) between primary and secondary sites, customers can use the Datadog-provided, open-source command-line tool, datadog-sync. Customers can also use Terraform or other infrastructure-as-code tools to replicate these resources. However, it’s important to note that replication must be completed before an outage occurs and performed regularly thereafter to ensure configurations at the secondary site remain in sync with the primary site. While we recommend updating the secondary site daily, customers can choose the cadence that aligns with their operational needs.
Here is an example using sync-cli to copy dashboards, monitors, and their dependencies to a secondary Datadog site:
datadog-sync migrate \ --resources="dashboards,monitors" \ --force-missing-dependencies \ --source-api-key="..." \ --source-app-key="..." \ --source-api-url="https://api.datadoghq.com" \ --destination-api-key="..." \ --destination-app-key="..." \ --destination-api-url="https://api.datadoghq.eu"Datadog offers over 850 integrations for customers to observe critical third-party systems, apps, and services. Many of these integrations are subject to vendor-specified API rate limits or quotas that prevent them from being configured for active-active observability. When customers configure integrations on their passive observability site, they are paused by default and remain in a passive state until activated during a failover.
Active-Passive observability failover
When to trigger a failover is best left to each organization’s discretion. While some scenarios—like the June 12, 2025, Google Cloud outage—are clearly disruptive, others are more nuanced and context-dependent. Failover is initiated by an organization on demand from the secondary site, based on operational needs, not just infrastructure failure.
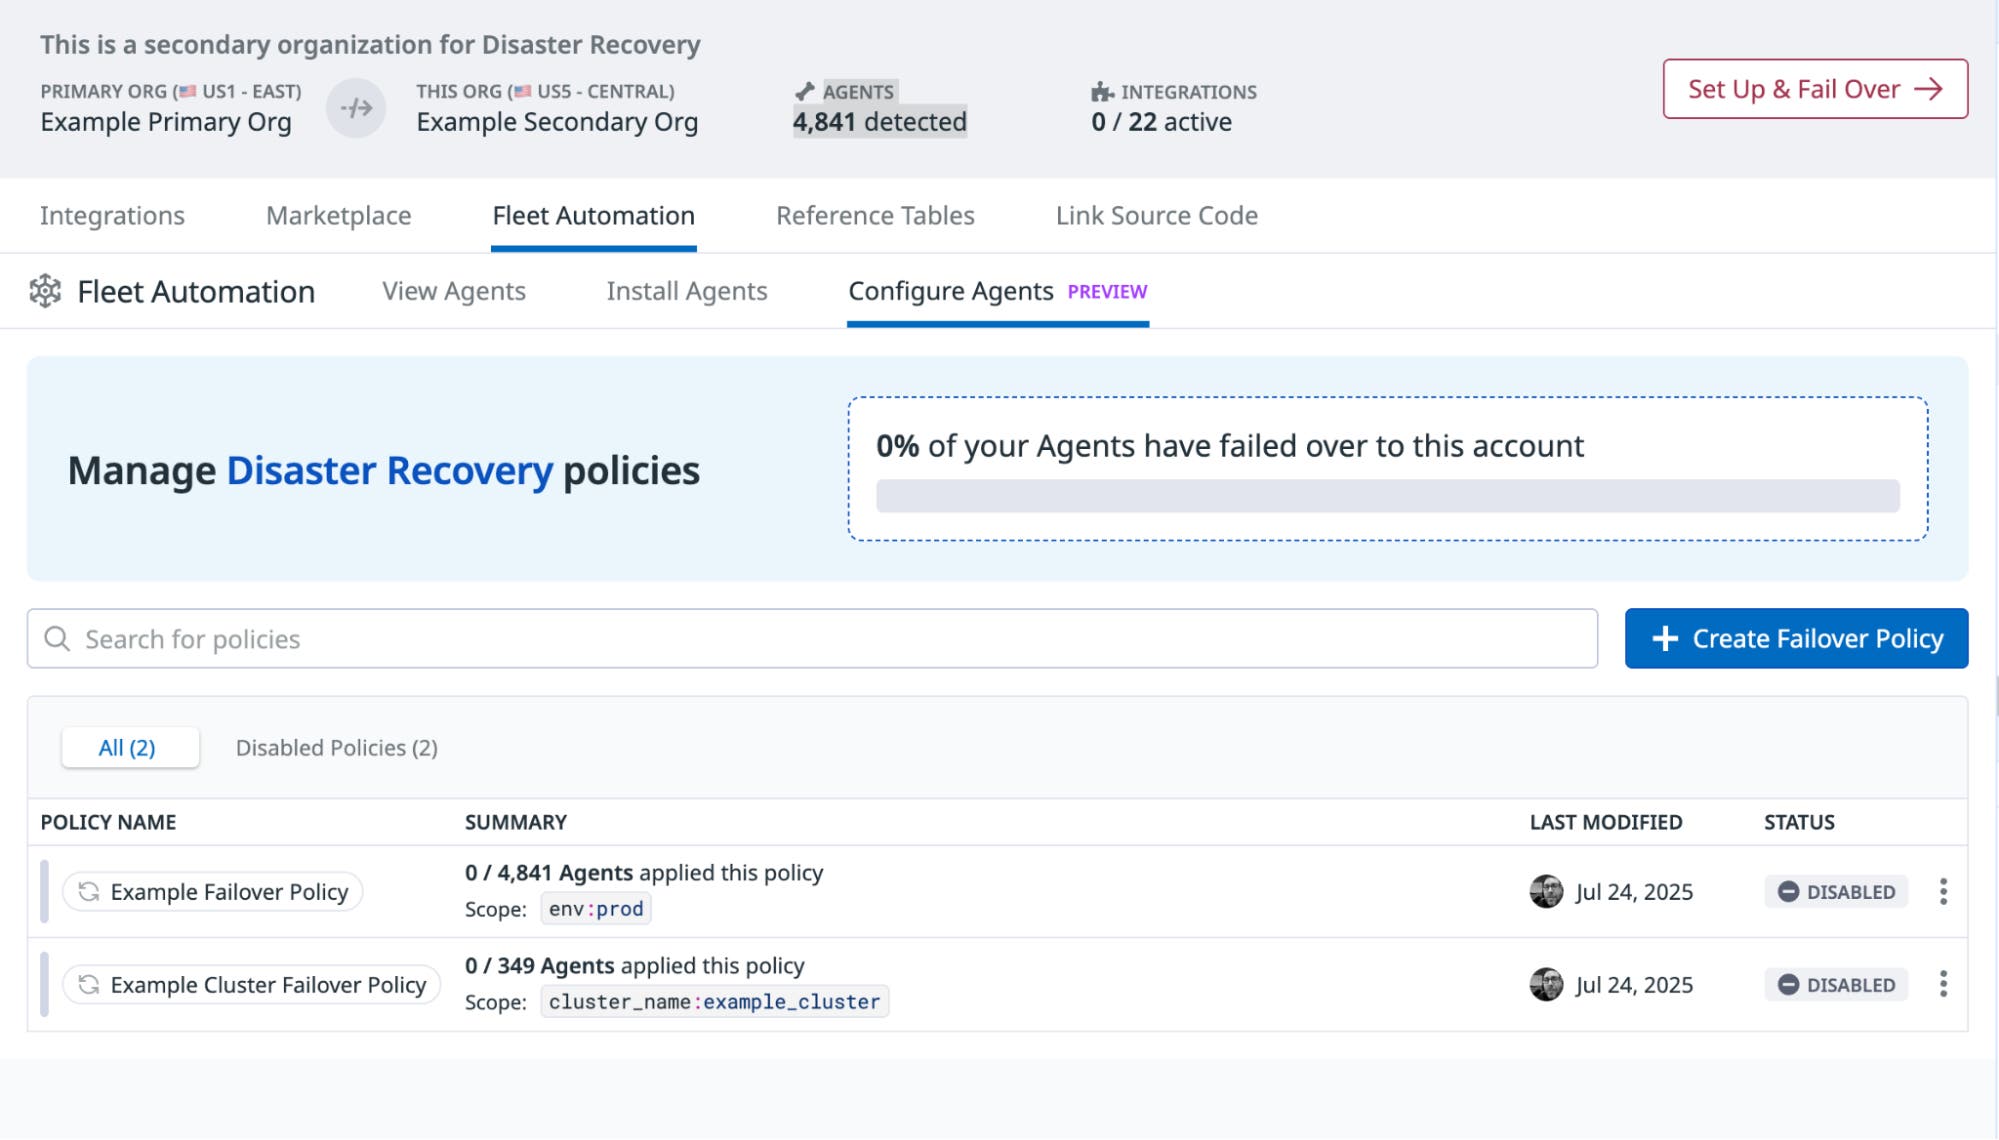
Triggering failover is easy with Datadog’s Fleet Automation and Remote Configuration capabilities. From Fleet Automation, users can create a new policy or reuse an existing failover policy and apply it to their Agents. Within seconds, Agents begin dual-shipping telemetry data to both the primary and secondary observability sites.

Additionally, DDR failover can be triggered through an Agent configuration update.
In datadog.yaml:
multi_region_failover: enabled: true # allow the agent to failover failover_metrics: false # set to true to send metrics to secondary site failover_logs: false # set to true to send logs to secondary site failover_apm: false # set to true to send traces to secondary site site: datadoghq.eu # secondary site api_key: ... # secondary site api keyThe Agent command line interface can be used to update the Agent configuration and trigger a failover:
agent config set multi_region_failover.failover_metrics trueagent config set multi_region_failover.failover_logs trueagent config set multi_region_failover.failover_apm trueWith the click of a button, integrations configured at the secondary site become active, and telemetry data is routed to the secondary site. The telemetry data is used in the respective dashboards and monitors that were replicated from the primary site to ensure SRE and DevOps teams can continue observing their services, roll out code deployments, and troubleshoot issues.

Meet observability continuity goals with DDR
In this post, we discussed the approaches Datadog offers for customers to continue observing their systems during cloud provider region outages and meet their observability continuity and regulatory compliance goals. As customers increasingly build services that are distributed and dependent on a technical stack outside their direct control, there’s no reason to lose visibility into the operations of infrastructure and applications during large-scale outage events. For more information on disaster recovery, submit a request for DDR Preview or reach out to your Datadog Account Manager.
Or, if you’re new to Datadog, get started with a 14-day free trial.


