Michael Chen
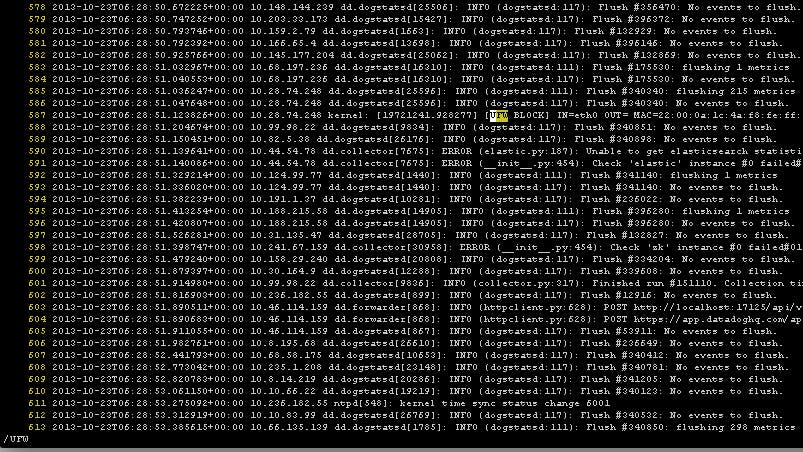
Error monitoring and tracking are essential for identifying issues in software development and fixing bugs. For uncommon, host-specific problems in particular, the ability to pinpoint the source machine of an error is a hugely important undertaking. Typically, software teams need to pore over long, esoteric log files like the one pictured below in hopes of finding a useful error message. And, that’s just the starting point after the team has become aware that there’s an issue.
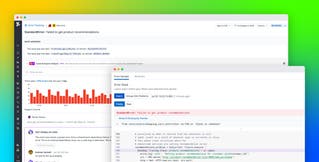
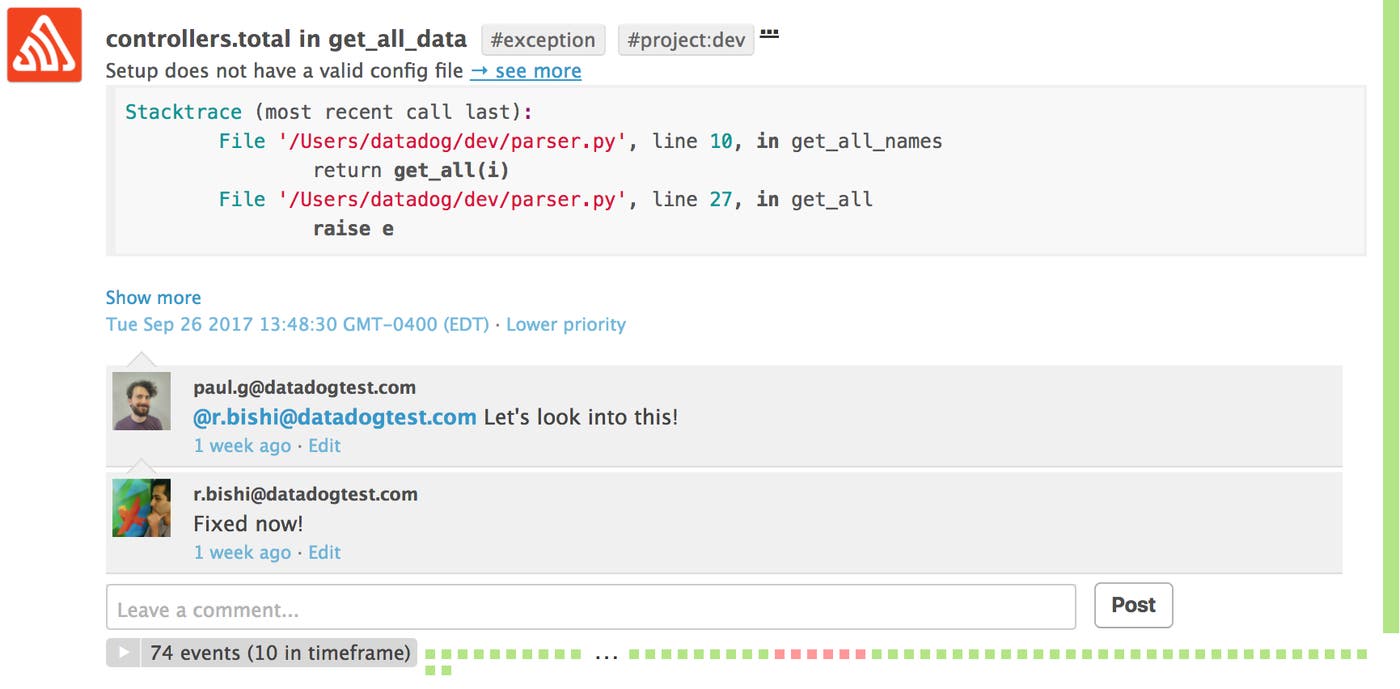
With Sentry, an event logging platform primarily focused on capturing and aggregating exceptions, error monitoring, recognition and tracking are automated. Notification alerts appear in your inbox as soon as Sentry picks up exceptional events, allowing for quick relief to potentially fatal bugs. Also, Sentry’s dashboard automatically updates events and generates exception stack traces, saving time from activities that would otherwise be undertaken manually. In short, Sentry streamlines the entire debugging process, and allows dev teams to focus their debugging efforts where it counts.
With our Sentry integration, you can send Sentry events to your team on Datadog! Here are some of the benefits of using Datadog with Sentry.
Search and comment on errors and bug fixes
Once configured, new Sentry events will automatically be forwarded to Datadog. Errors will appear on your Datadog event stream, where you and your team can add comments or suggestions on how to fix them. You can also delegate tasks by sending notifications to other team members as a rapid response system. Notifications are delivered as emails with the previous conversation attached to provide context about the issue.
Correlate errors with metrics and data points from other systems
Datadog allows for the creation of dashboards to quickly discover relationships between your errors and system performance. After creating a timeboard in Datadog with a metric of interest from any system you’ve integrated, you can overlay events from Sentry. In the graph below for example, we’ve plotted how exceptional events have impacted the frequency of timeouts. Finding correlations between your errors and metrics can give you a better understanding of unusual metrics timeseries, saving time on detecting sources of future spikes or periods of idle activity.

Create synthetic error dashboards
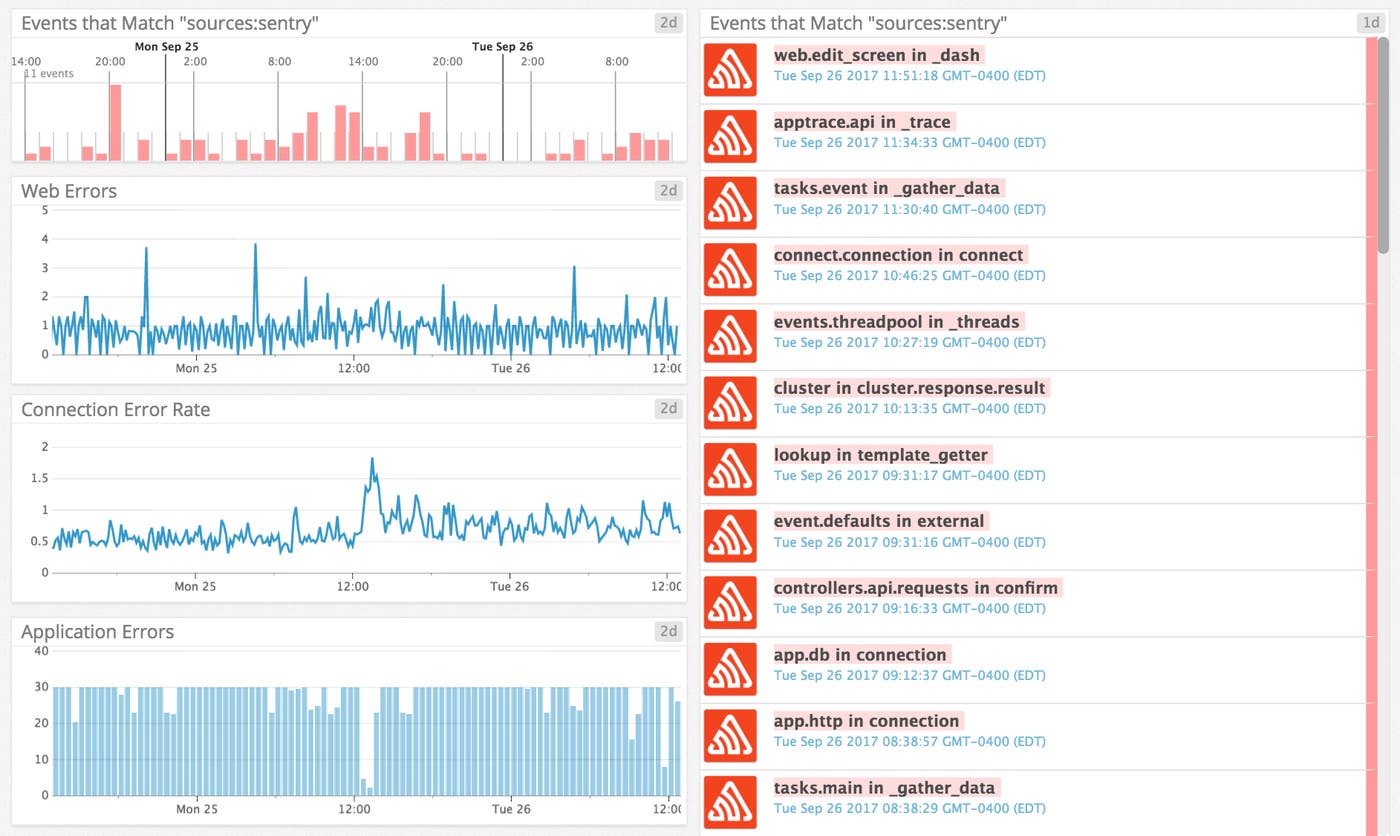
You can use also Datadog to create custom dashboards with events and data from Sentry. Simply create a new dashboard with an Event Timeline and/or Event Stream widget with the query sources:sentry and add your metrics. An example of a custom dashboard is shown below. Importantly, you can mix and match data from Sentry and any other integrated system into similar dashboards of your own creation.
Adding the Sentry integration to your Datadog account only takes a few minutes. Just follow the simple steps below.
Setting up Datadog’s Sentry integration
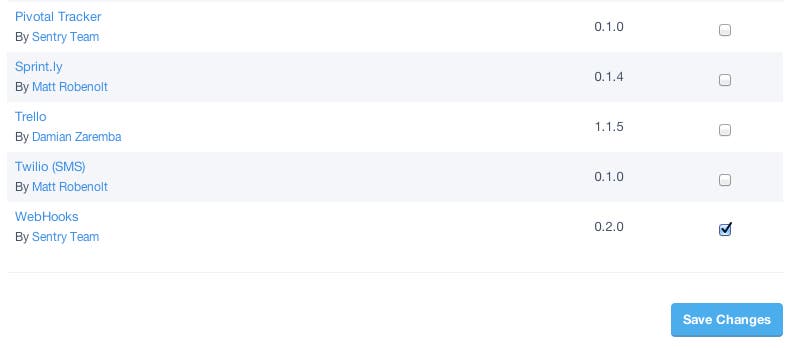
- In your Sentry account, enable the integration for WebHooks.
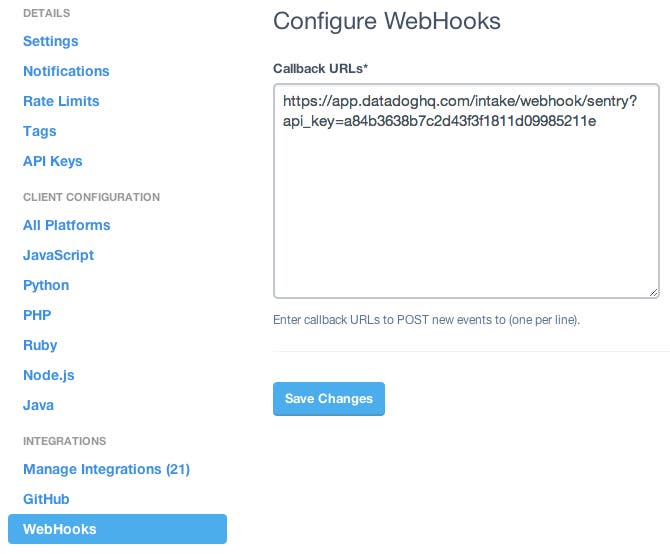
- On the WebHooks integration page, add your webhook URL as
https://app.datadoghq.com/intake/webhook/sentry?api_key={API_KEY}. Your Datadog API key can be found on the settings page.
And you’re done!
You can improve your team’s debugging experience, and resolve issues faster by signing up for a free trial of Datadog and adding the Sentry integration. The whole process should take just minutes.


