Bowen Chen

Till Pieper
Director, Product Management

Reilly Wood

Jason Thomas
Senior Staff Engineer
As development teams adopt AI-powered tools and build services that make use of AI agents, they want to extend their AI capabilities to incorporate familiar tools and observability data. However, AI agents struggle with regular API endpoints and frequently fail when parsing complex nested JSON hierarchies or incorrectly handling errors. As a result, these agents often fail to retrieve relevant results.
In response to these challenges, we’ve built the Datadog remote MCP Server, which is able to ingest prompts from users and AI agents and map them to corresponding Datadog resources and data. By doing so, the MCP Server supports logistical challenges such as authentication, HTTP request handling, selecting the correct endpoint, and ensuring that responses include highly relevant context—all of which were previously potential points of failure for AI agents.
OpenAI and Datadog have joined forces to embed the new MCP Server within the OpenAI Codex CLI, a multimodal agent that can be used directly in your terminal. It gives on-call engineers a conversational assistant that can read code, tap Datadog context in real time, and run commands securely. Once connected to the MCP Server, Codex can instantly surface errors, incident details, and live latency graphs, then even patch Terraform-based monitors without your leaving the terminal.
What is the Datadog MCP Server?
At its core, Datadog’s remote MCP Server acts as a bridge between Datadog and MCP-compatible AI agents like Codex by OpenAI, Claude Code by Anthropic, Goose by Block, or Cursor. It creates a layer on top of Datadog’s endpoints that derive the intent from natural language prompts, decide if the prompt falls within the server’s capabilities, and if so, make a call to the tool and endpoint that addresses the scope of the agent query.
At release, the Datadog MCP Server supports the following tools and categories:
Logs & Traces
get_logs: retrieves a list of logs based on query filters.list_spans: helps investigate spans relevant to your query.get_trace: retrieves all spans from a specific trace.
Metrics & Monitoring
list_metrics: retrieves a list of available metrics in your environment.get_metrics: queries timeseries metrics data.get_monitors: retrieves monitors and their configurations.
Infrastructure Management
list_hosts: provides detailed host information.
Incident Management
list_incidents: retrieves a list of ongoing incidents.get_incident: retrieves details for a specific incident.
Dashboards
list_dashboards: discovers available dashboards and their context.
Using these tools, the MCP Server is able to respond to AI agent and user prompts to assist with troubleshooting, root cause analysis, incident response, and more. In the following section, we’ll walk through a troubleshooting example where we use these tools made available by the MCP Server to correlate errors in our Redis data stores to active incident response efforts.
Troubleshoot service errors with AI using MCP Server tools
Now that you know what the MCP Server is and its available suite of tools, you may be wondering, how can these tools assist me in a real-world use case?
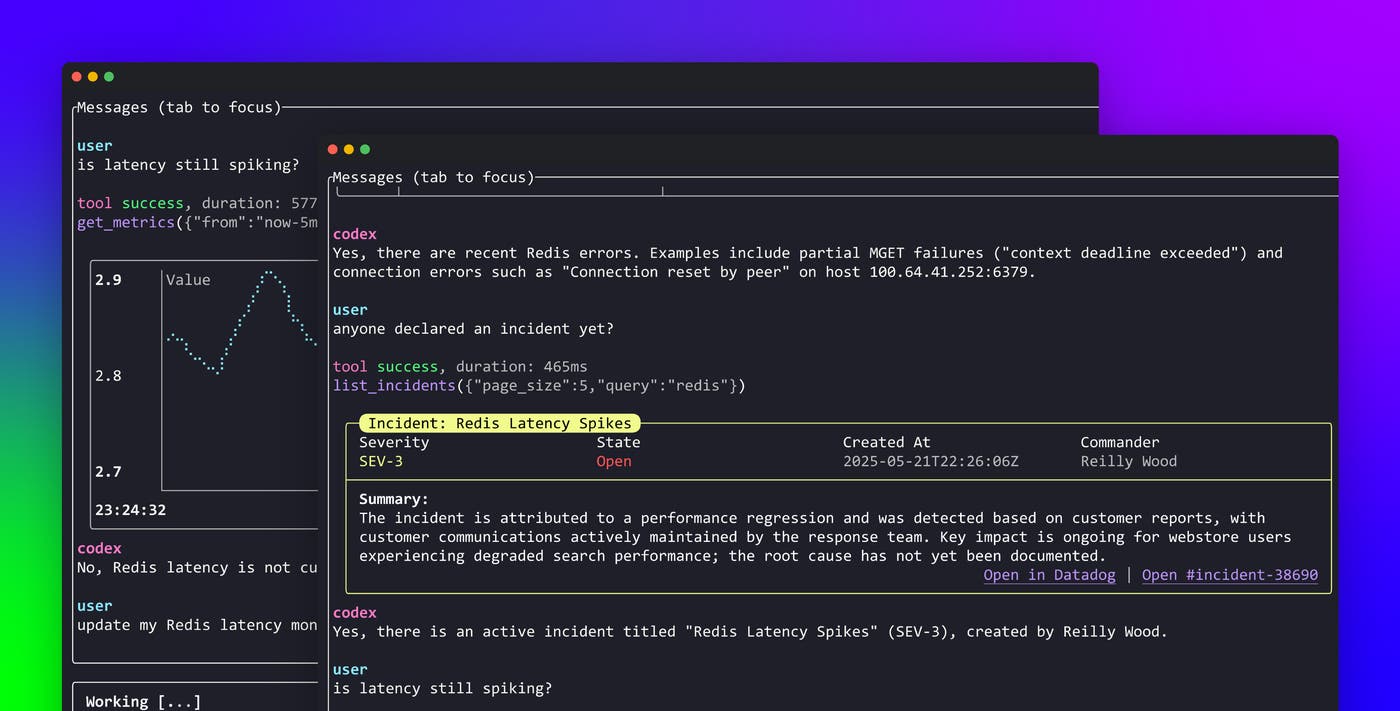
In the following example, we’re using the Rust-based Codex CLI into which we have integrated the Datadog MCP Server in collaboration with our friends at OpenAI. We’ll start by asking Codex to check if there are any Redis errors in our environment. The MCP Server helps Codex select the right tool to call in response to the prompt—in this case, the get_logs tool—and Claude analyzes the retrieved data to help answer our initial prompt. After analyzing the error logs retrieved using the MCP Server, Codex identifies an active issue where customers are encountering partial MGET failures as well as connection reset errors.
We’ll first want to see if an incident has been declared and whether responders are actively investigating the issue. The MCP Server helps Codex fetch a list of active incidents in our environment using the list_incidents tool. Using this information, Codex is able to identify that there is currently an ongoing SEV-3 incident caused by Redis latency spikes resulting in degraded search performance for customers.
From this point, we can ask Codex whether the Redis latency spikes are still persisting. The MCP Server enables Codex to find the relevant metric using the list_metrics tool, and then query the metric using the get_metrics tool. Using the timeseries data points retrieved using the get_metrics tool, Codex is able to generate a graph of our Redis host latency directly within the same window, enabling us to visualize latency spikes without context switching. After determining that Redis host latency has stabilized, we can ask Codex to alert our responders to latency spikes earlier. This prompts Codex to lower the alert threshold in our Redis latency monitor by updating the source code of the underlying monitor resource.
Incorporate Datadog into your AI workflows
The Datadog MCP Server enables you to retrieve logs, traces, and incident context—with many other capabilities in development—using AI agents that support the MCP standard. This feature is currently available in Preview, you can learn more about requesting access in our documentation. You can also see an example of how the MCP Server is used by Datadog’s Cursor extension in this blog post, where we walk through a troubleshooting example using MCP Server tools.
Learn more about new Datadog features released during this year’s DASH conference here. Or, if you don’t already have a Datadog account, sign up for a free 14-day trial today.

