Michael Cronk

Mahip Deora
High-performance computing (HPC) clusters rely on fast, reliable shared storage so that expensive CPU cores and GPUs aren’t left idle waiting for data. When bandwidth or I/O bottlenecks emerge, your workloads can slow down as your cluster spends more time on blocked reads, metadata lookups, and sync operations than actually computing. Parallel file systems like Lustre can deliver the aggregate bandwidth these workloads need, so keeping Lustre performing consistently is critical to getting full value from your HPC infrastructure.
Datadog’s Lustre integration gives you detailed visibility into your parallel file system under real workloads. Lustre telemetry data enables you to track file system and metadata operations (such as creates, renames, directory scans, and attribute updates), I/O throughput, and file system health. By monitoring metadata servers (MDSes), metadata targets (MDTs), object storage servers (OSSs), object storage targets (OSTs), and clients, HPC teams can detect bottlenecks, troubleshoot job slowdowns, and optimize storage performance across large-scale environments.
In this post, we’ll walk through how the integration helps you:
- Monitor file system and metadata operations to detect bottlenecks before they stall jobs
- Analyze throughput and per-job access patterns to troubleshoot job slowdowns
- Track storage servers, file system health, and network
- Monitor changelog events in Datadog Log Management
Detect metadata bottlenecks
Many HPC workloads are metadata-heavy, which means metadata servers and targets often become the bottleneck for I/O performance. MDSes and MDTs create and traverse large directory trees, touch many small files, and frequently update file attributes. When MDSes are stressed, users can experience slow I/O even though CPU, GPU, and network metrics look healthy. In this section, you’ll see how the Datadog Lustre integration helps you monitor your cluster’s metadata activity and metadata pressure so you can detect bottlenecks before they affect users.
Analyze metadata usage
The integration collects core metadata metrics that describe activity in your Lustre file systems, including life cycle operations and attribute changes, as well as reads, seeks, and lookups. You can visualize these metrics by using an out-of-the-box (OOTB) Lustre dashboard, grouping by file system or metadata target to see where in your HPC cluster these activities are concentrated.
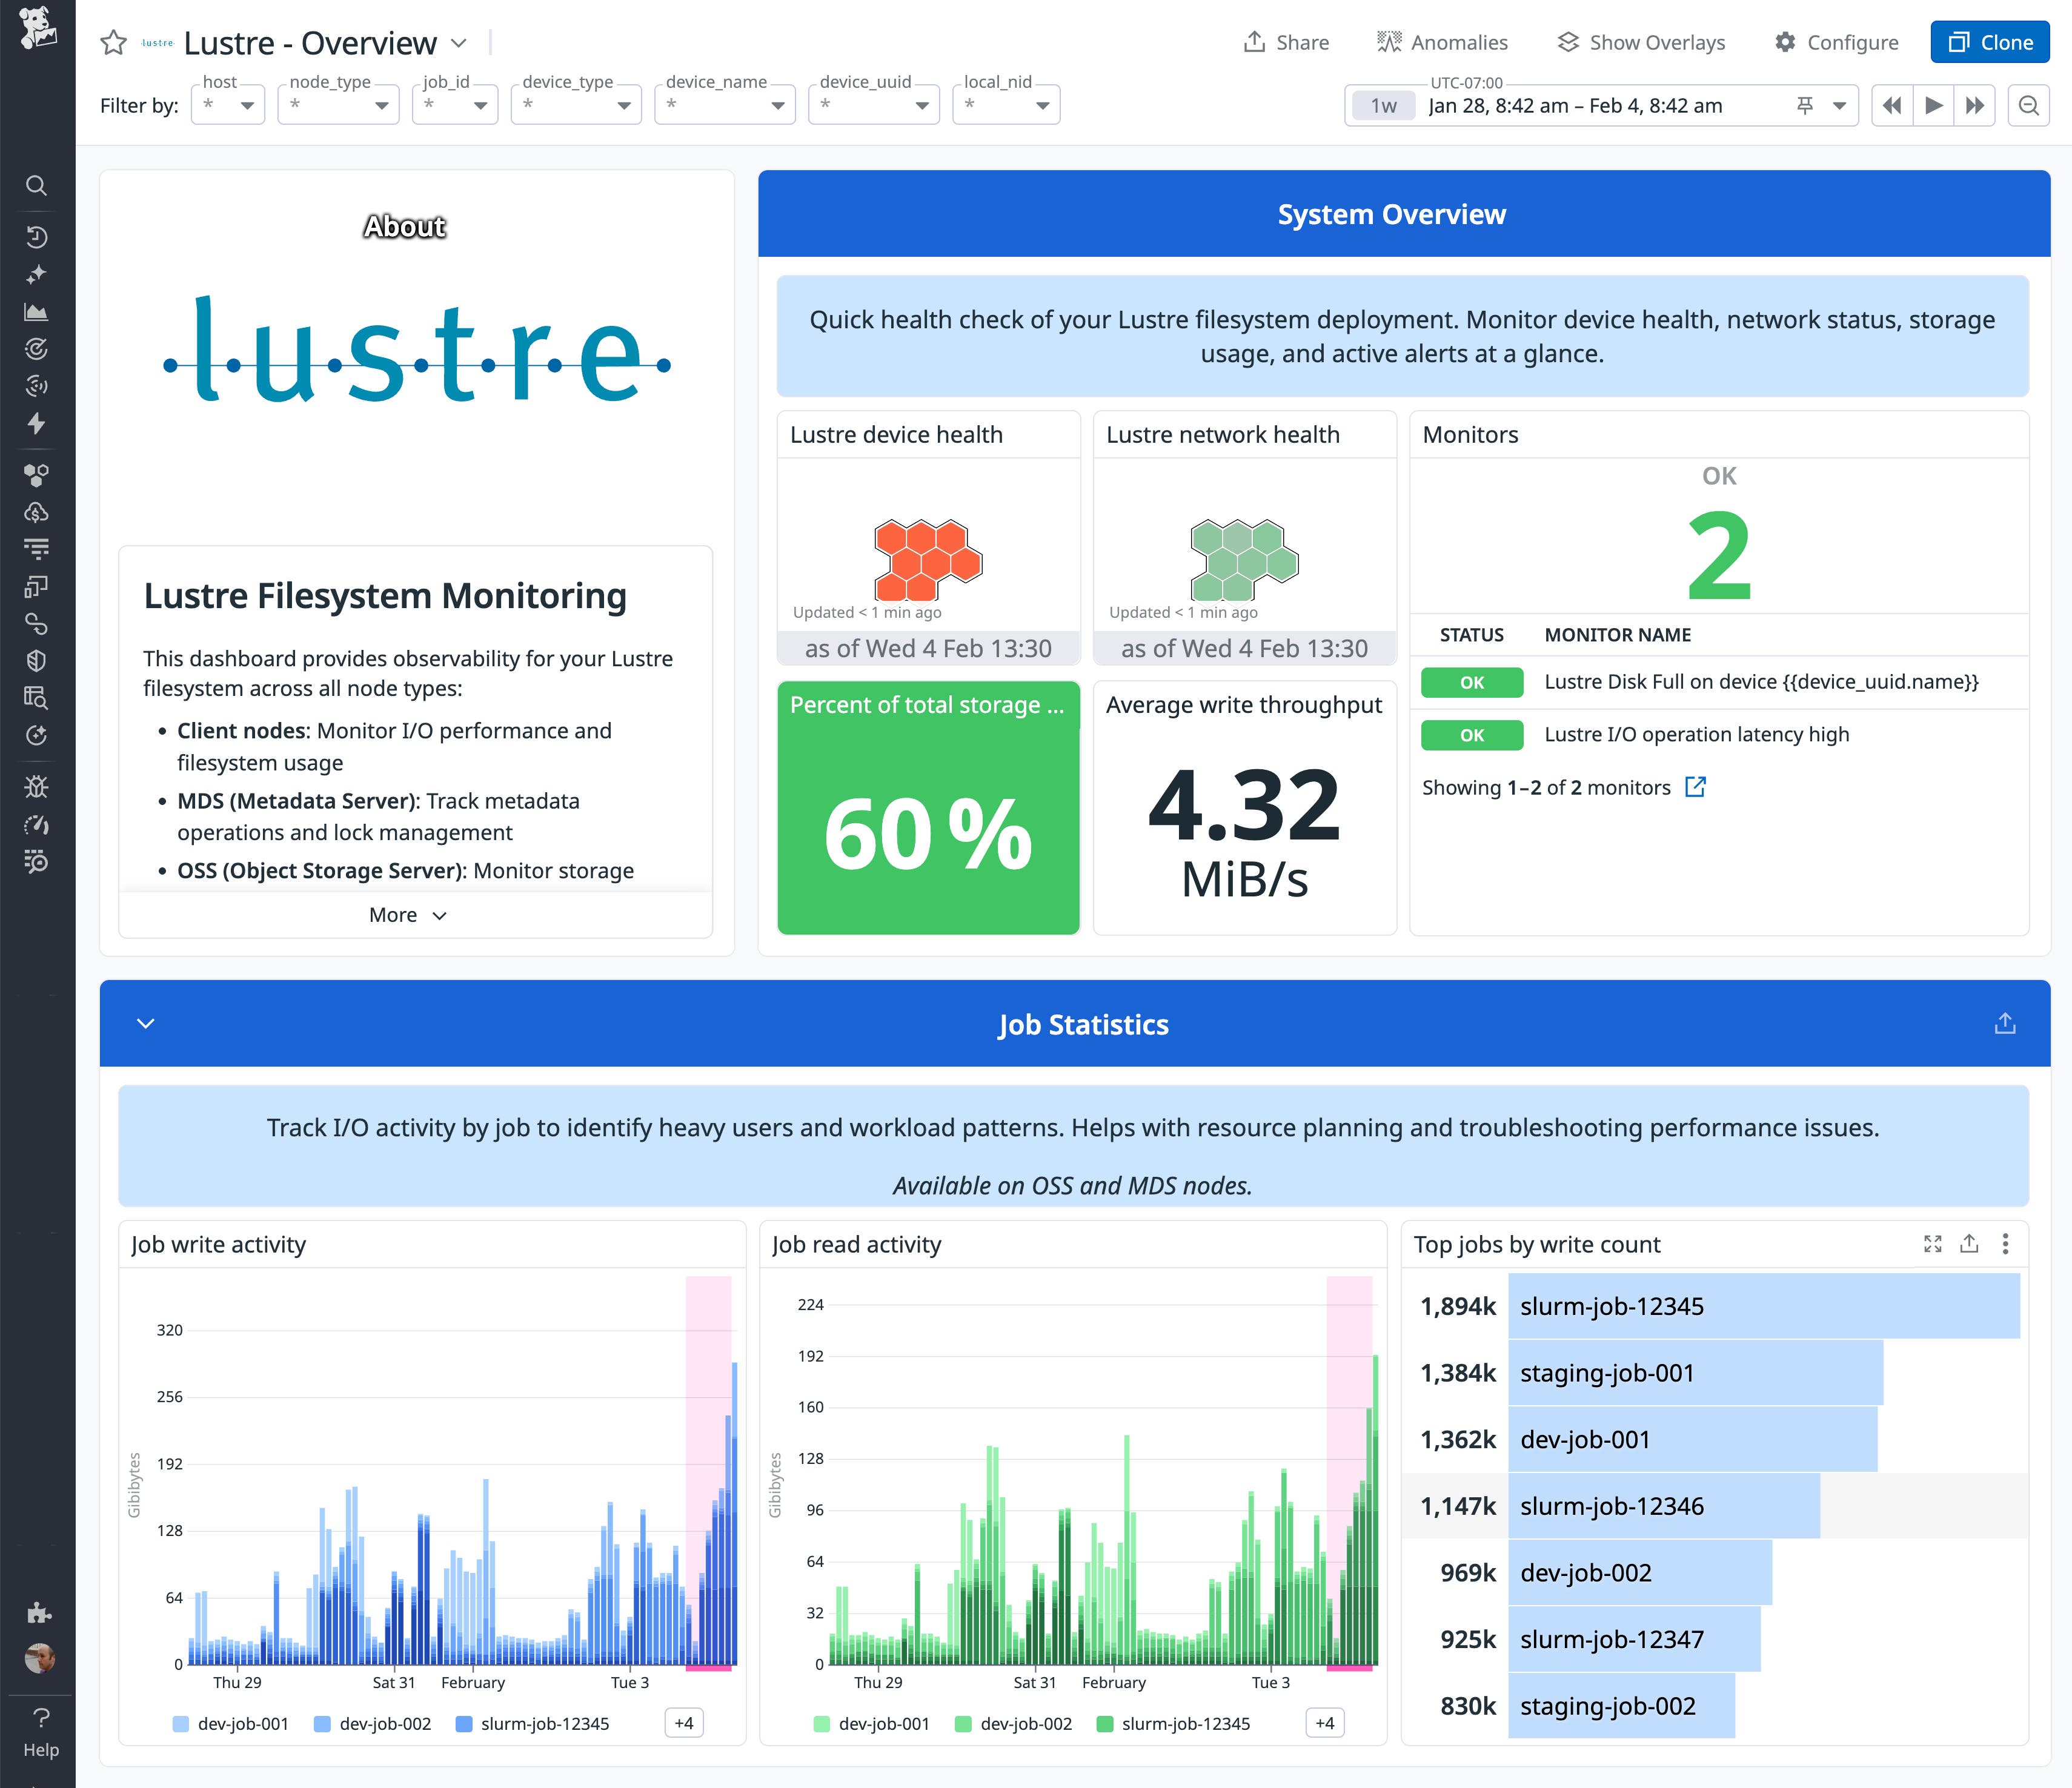
In the following screenshot, the dashboard graphs the lustre.filesystem.read_bytes.sum and lustre.filesystem.write_bytes.sum metrics, which show a series of spikes in Lustre file system read and write activity. This pattern is common at the start of HPC workflows, when jobs scan directories and initialize input data. Sustained high read activity on a single file system can indicate concentrated access, helping explain slow directory listings and longer runtimes for jobs that traverse large directory trees.
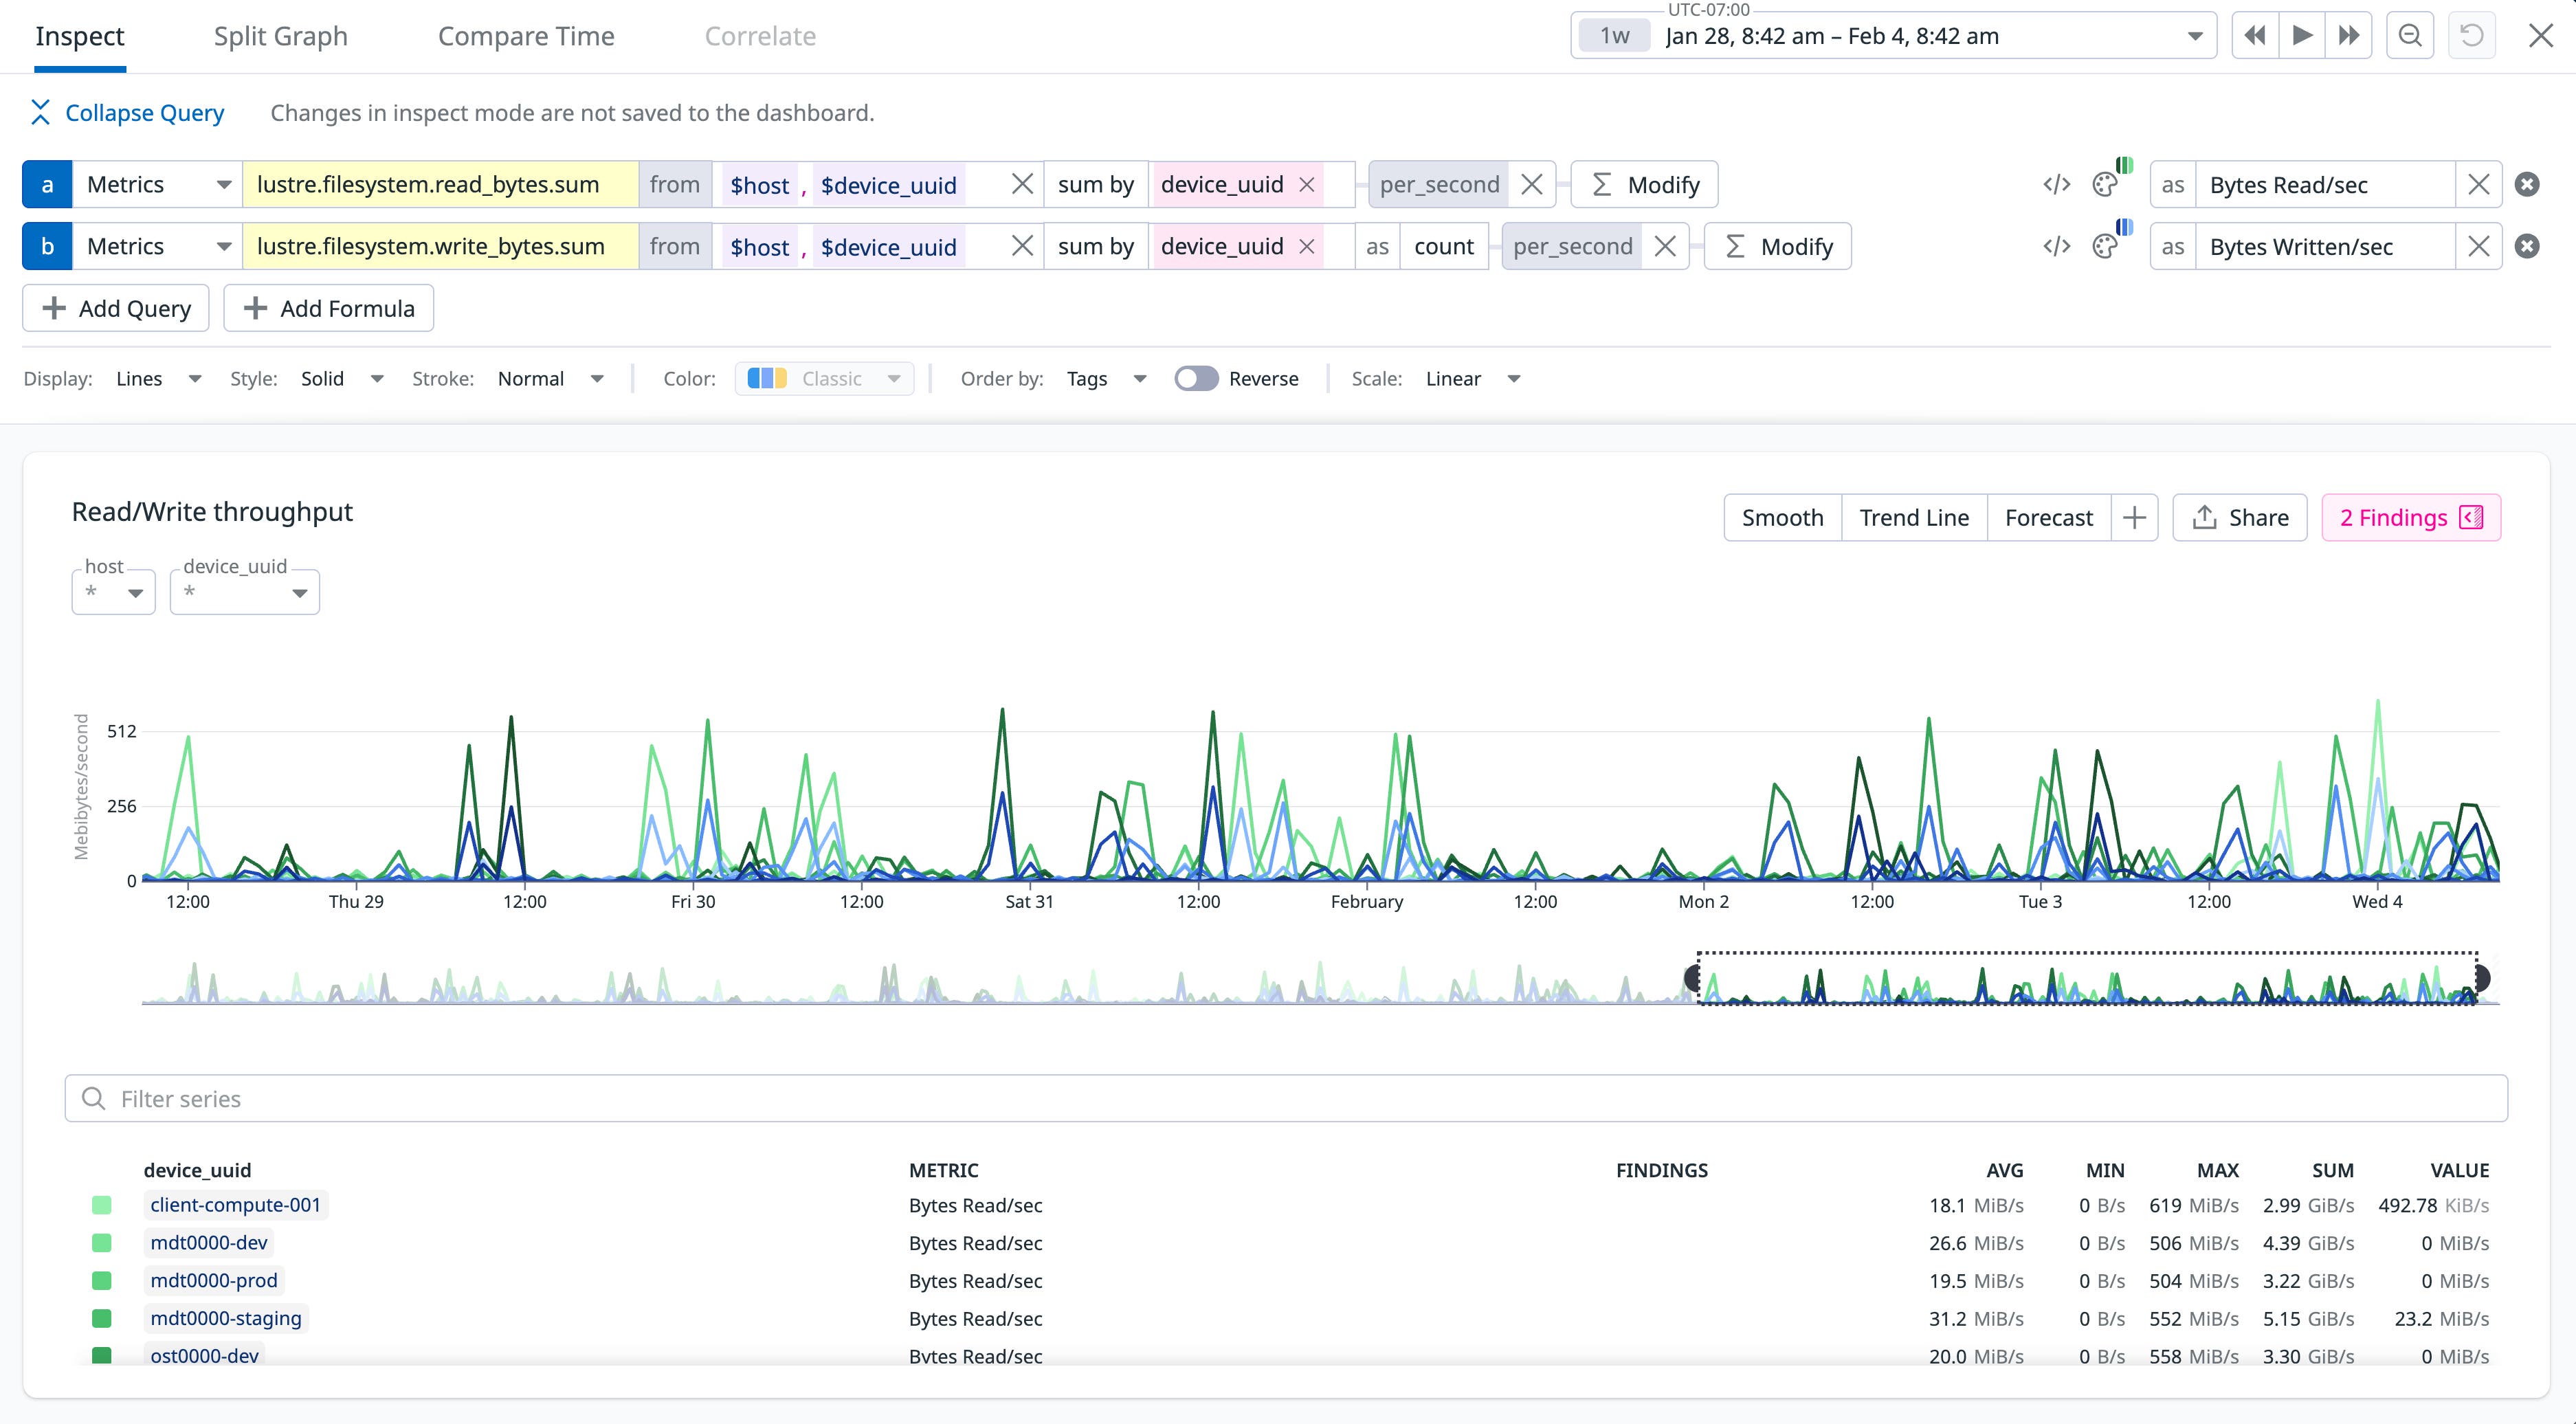
By monitoring these and other metrics, such as lustre.filesystem.mkdir.count and lustre.filesystem.openclosetime.count, storage teams can track activity and detect bottlenecks before they lead to job overruns, errors, or latency.
Track per-job metadata pressure
Metadata pressure is the strain placed on metadata servers by high-frequency file operations. When your workloads slow down due to metadata pressure, Datadog enables you to troubleshoot efficiently by correlating Lustre metrics with job scheduler data, host metrics, and telemetry data from other parts of your HPC stack.
For example, if users report that a research workflow hangs during certain stages, you may see a correlated increase in directory operations and metadata latency on a particular file system. You can filter to home in on specific jobs, then view their scheduler metrics to identify the root of the problem. If a single job creates a large number of files, you may see rising scheduler latency (such as in your Slurm integration metrics) even if your resource utilization metrics are flat.
Correlating metadata pressure with individual jobs can inform your mitigation and tuning efforts. For example, it can show you when to change directory layouts, adjust striping patterns and file-per-process patterns, or update scheduler policies so fewer metadata-heavy jobs run at the same time.
Troubleshoot job slowdowns
Your cluster’s I/O throughput is a major factor in the performance of your workloads. When Lustre can’t deliver data fast enough, jobs can spend more time waiting on reads and writes than they do computing. Bottlenecks like this can be caused by limited bandwidth, uneven I/O across a few hot OSTs, or high latency.
Datadog’s Lustre integration surfaces cluster-wide and per-file system throughput metrics to help you spot bottlenecks and saturation. Tracking read and write throughput, operation counts, and latency helps you identify file systems or OSTs that are overloaded. This can also help you spot periods when the cluster isn’t using available bandwidth effectively. The OOTB Lustre dashboard makes it easy to see which file systems or OSTs are approaching saturation and whether utilization is balanced or skewed toward specific targets or clients.
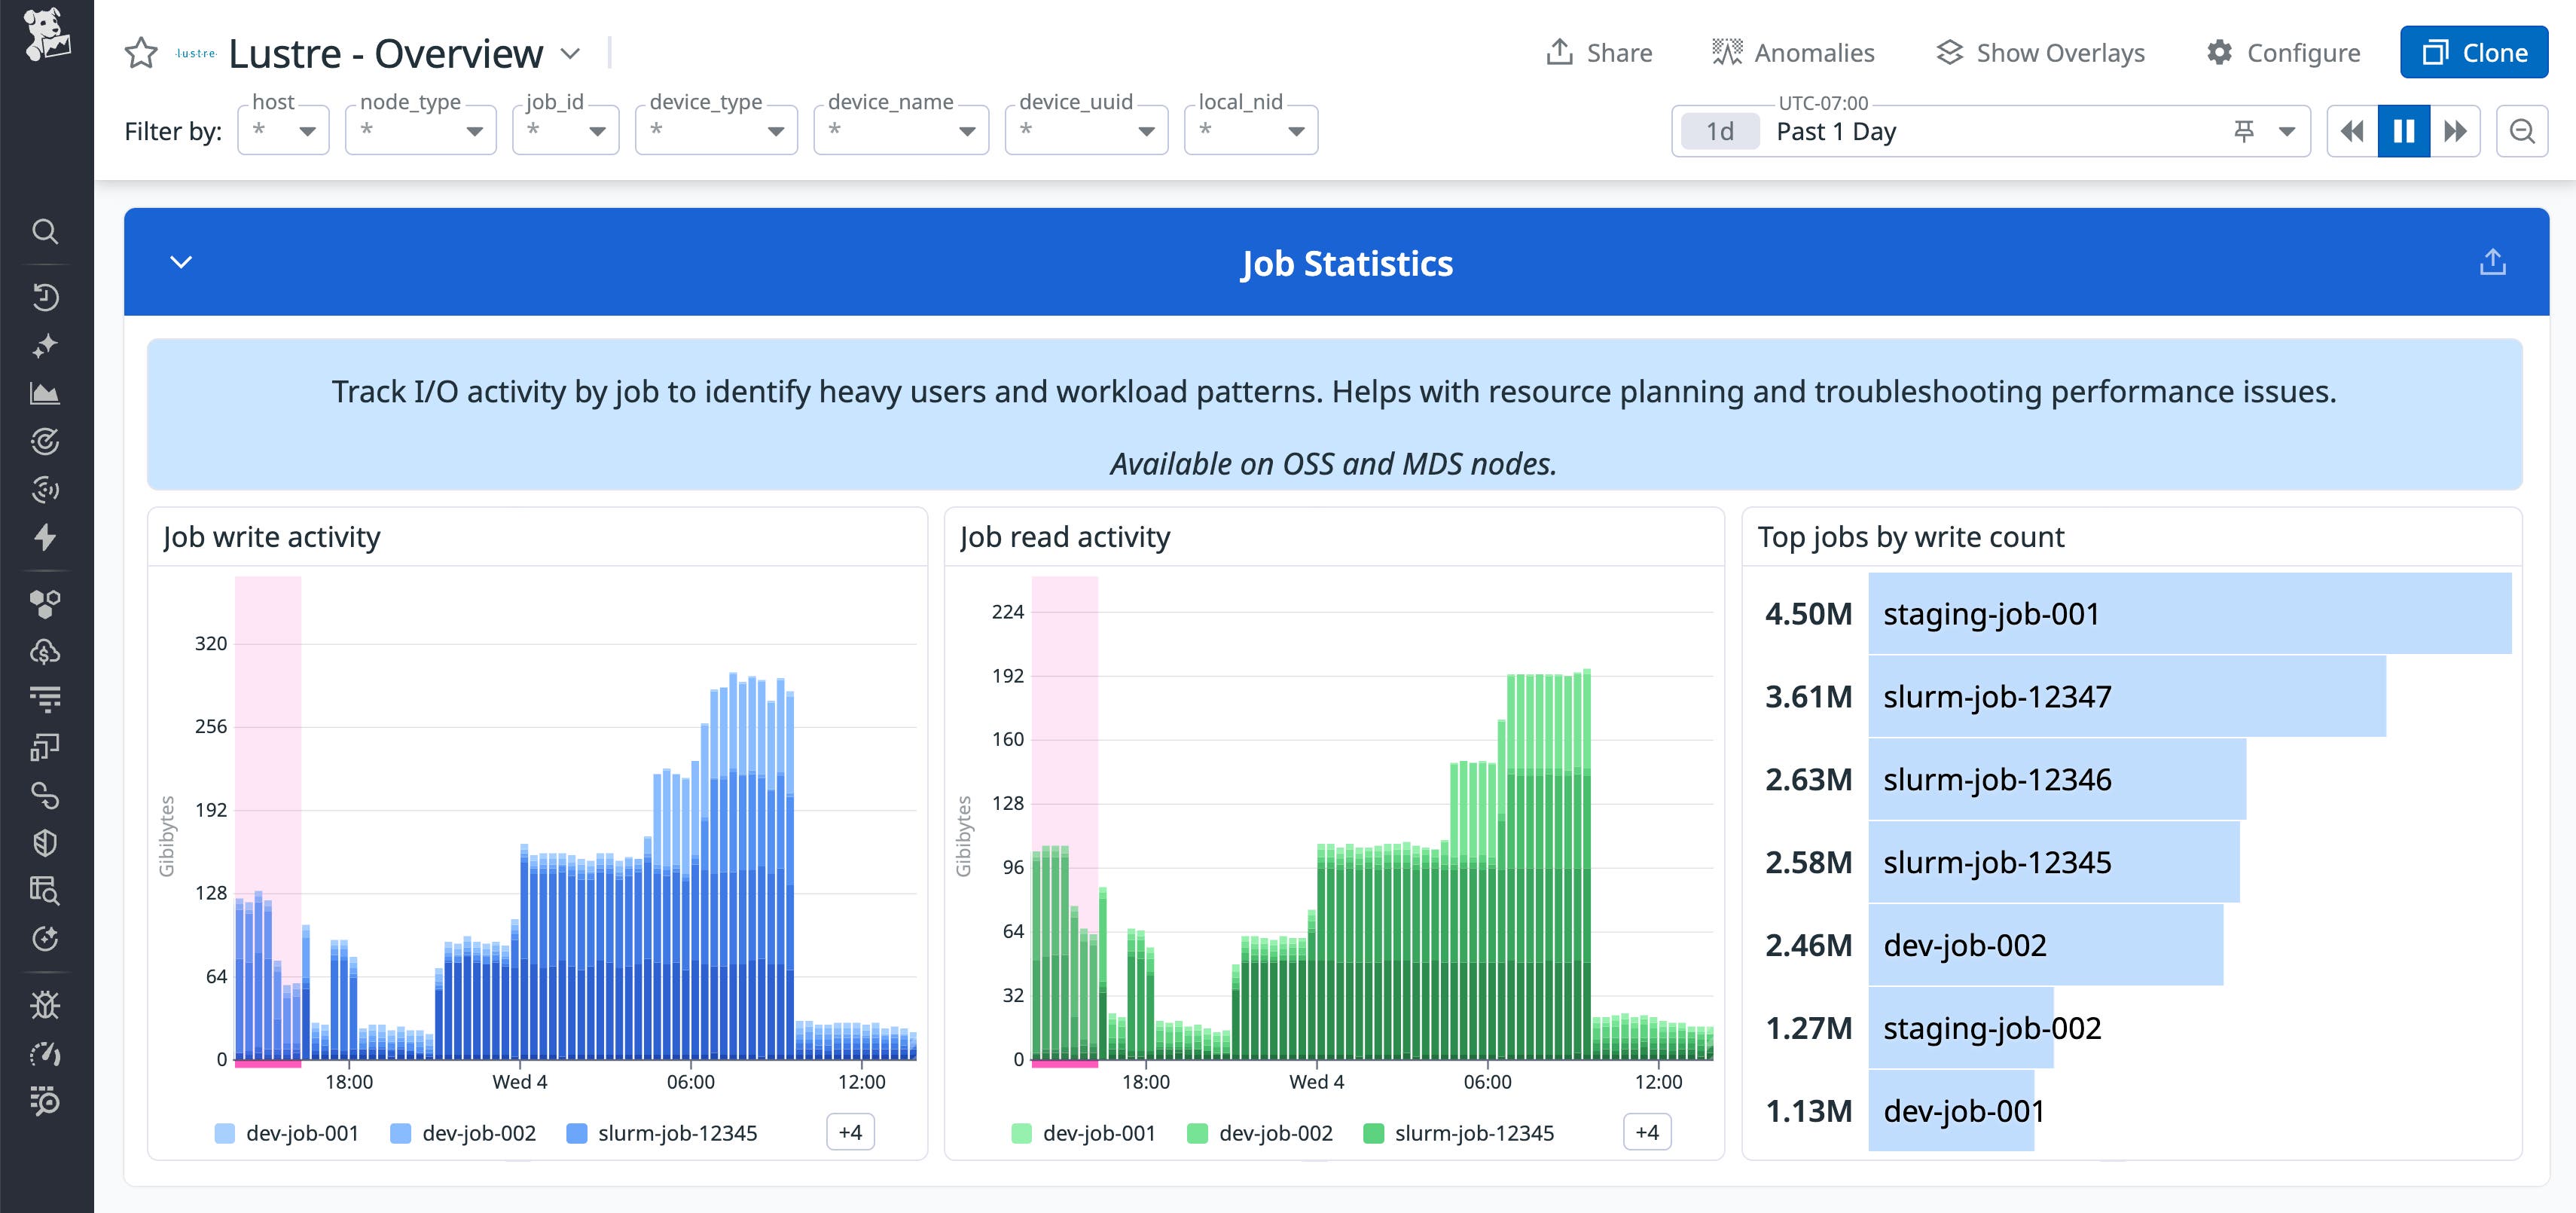
Lustre job statistics metrics (lustre.job_stats.*) give you a per-job view of file system behavior. For each job, you can see:
- Read and write operation counts and latency
- Bytes read and written over the life of the job
- Other I/O operations such as creating and renaming files and directories
This visibility into Lustre job stats helps you efficiently troubleshoot job slowdowns. For example, a training job that seems CPU-bound may actually be issuing many small random reads to a narrow set of OSTs, or a noisy neighbor job may be driving most of the I/O on a busy file system. With Datadog, you can identify the specific cause of the problem by its unique job ID so you can target your mitigations based on data instead of guesses.
By enabling you to correlate your Lustre job stats with host, GPU, network, and scheduler metrics, Datadog helps you see whether job slowdowns are caused by storage issues or, for example, resource starvation. This helps you better understand how workloads use Lustre so you can optimize storage performance by tuning striping patterns, rebalancing data, or revising applications to improve their I/O patterns.
Monitor storage and network health at scale
To keep a large Lustre deployment healthy, you need more than metadata and throughput metrics—you also need to know whether your file system components, capacity, and network are performing as expected. Datadog’s Lustre integration tracks total and available capacity per file system and health status of OSTs and MDTs. This lets teams plan for growth before they hit capacity limits, avoid overfilling specific pools, and balance workloads across available storage. It also helps you detect uneven capacity usage, when some file systems are nearly full while others have plenty of space available.
Datadog also collects metrics that show what’s happening on your storage servers and network. When users report slow I/O or jobs running longer than expected, OSS metrics help you quickly spot issues with queue depth or buffer availability. LNET metrics let you track interface throughput and correlate spikes in errors or retransmissions with drops in throughput to understand whether storage or the network is limiting performance. Because Datadog provides visibility across your environment, you can correlate Lustre health with host metrics, GPU monitoring, and network performance to see whether a problem originates in storage, compute, or the network and respond accordingly.
Monitor changelog events
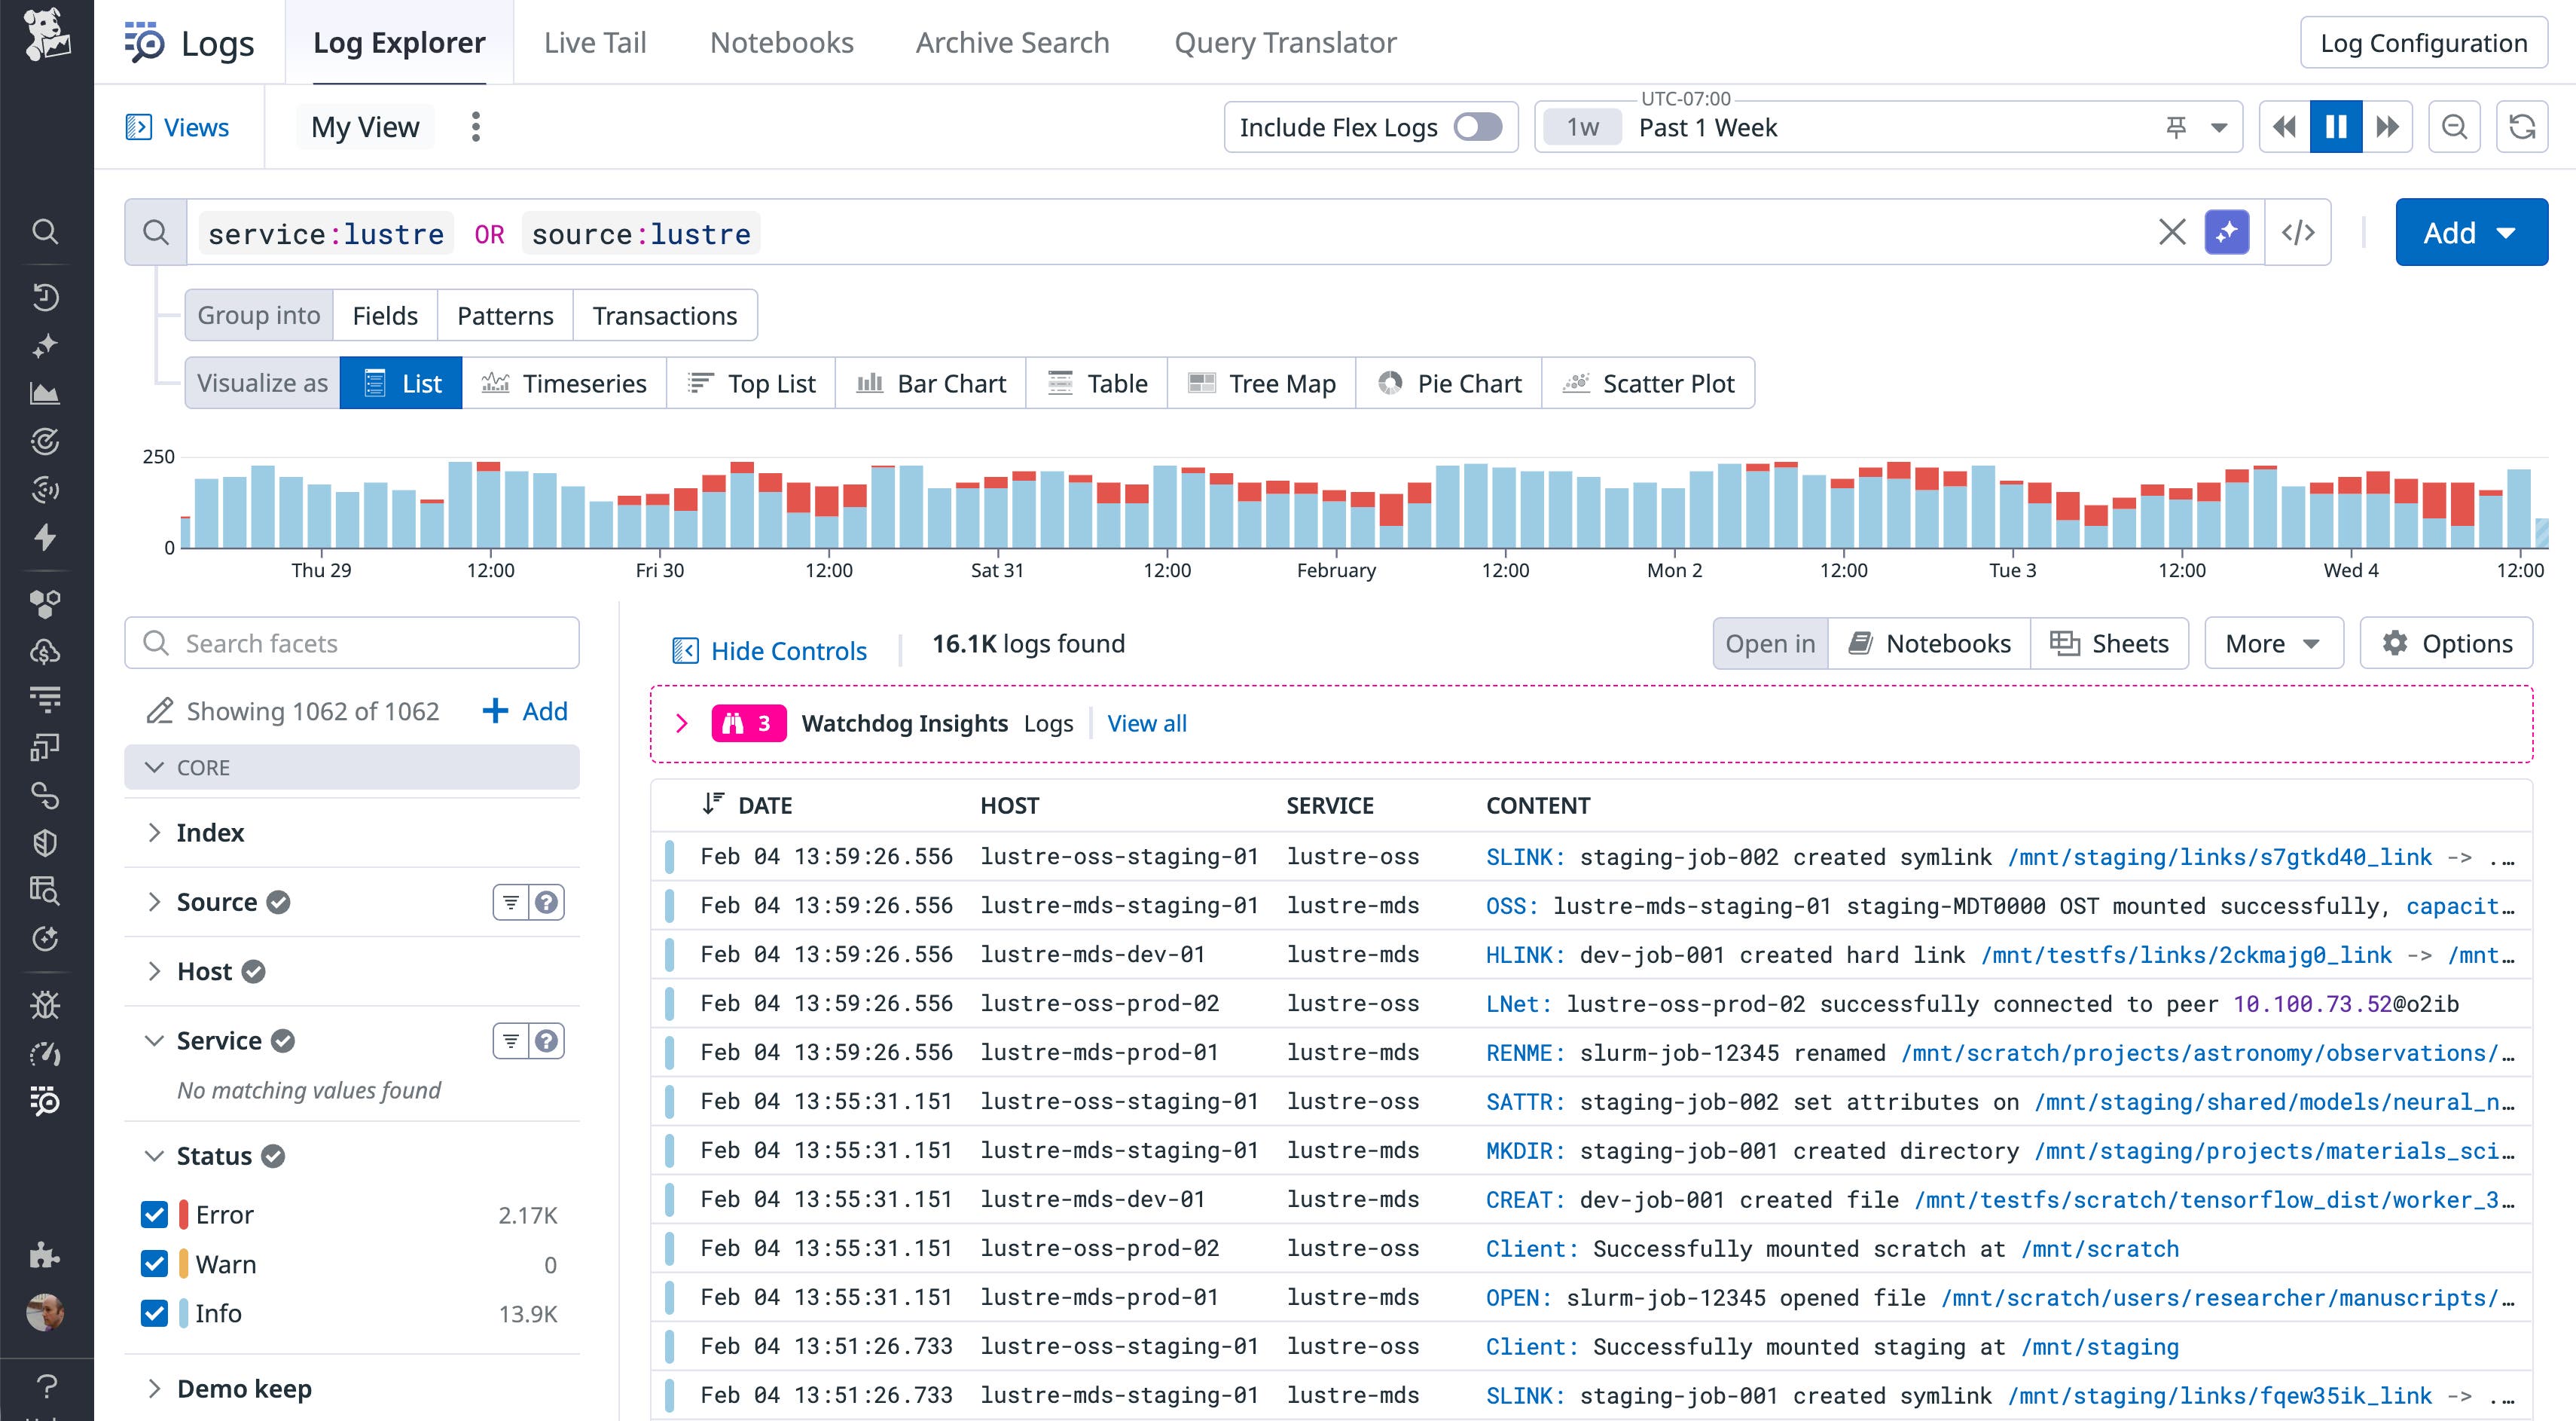
In multi-tenant environments, understanding how data changes can be as important as tracking capacity. The Lustre integration can consume changelog events as structured logs, capturing operations such as file creates, deletes, and renames. Combined with metrics, Lustre changelog events help you identify high-churn directories and spot patterns that may lead to capacity issues. It also gives you crucial context when you need to investigate unexpected data movement or deletion.
Gain end-to-end observability for Lustre in your HPC stack
Lustre plays a critical role in keeping HPC clusters productive. Datadog’s Lustre integration gives you visibility into file system and metadata operations, throughput, and file system health so you can detect bottlenecks, troubleshoot job slowdowns, and reduce storage-related job delays.
Because Lustre telemetry data sits alongside Slurm metrics, host and GPU monitoring, and network observability in Datadog, teams across storage, HPC operations, and applications can rely on a shared, consistent view of how their workloads are using the cluster. See the Lustre integration documentation for more information. If you’re not yet using Datadog, start today with a 14-day free trial.


