Teddy Gesbert
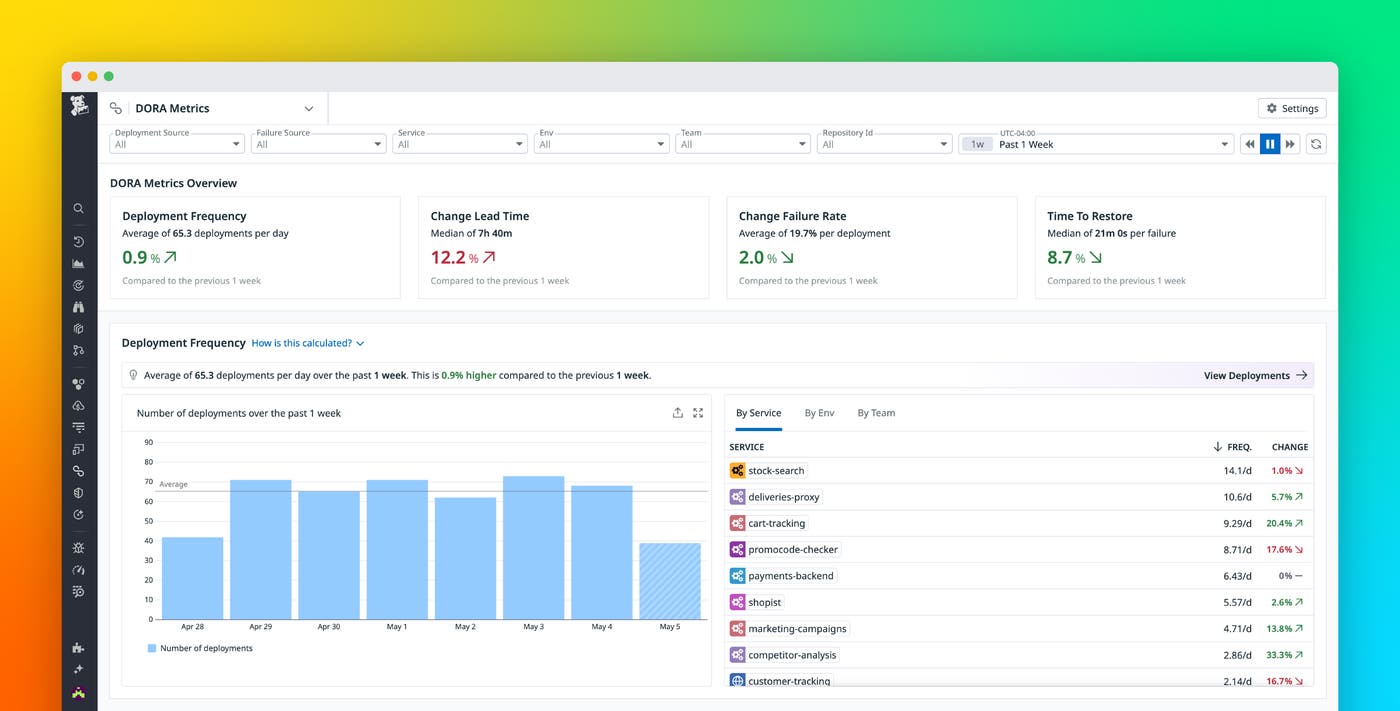
Delivering software quickly and reliably is the main focus of modern DevOps. But to improve your delivery performance, you need to understand it, and that starts with measurement. Teams primarily measure performance in this area by using DORA metrics—deployment frequency, change lead time, change failure rate, and time to restore service*. These metrics help teams understand trends in their software delivery practices in quantifiable terms that they can track and improve over time.
By automatically ingesting data from across your stack—including your CI/CD pipelines, APM, or your incident management workflows like Datadog Incident Response—Datadog DORA Metrics enables you to adopt a shift-left mindset by measuring not only delivery speed and stability but also the upstream activities that shape them.
In this post, we’ll show you how you can use Datadog DORA Metrics to:
- Track and analyze your software delivery performance
- Surface bottlenecks across your delivery workflow
- Launch targeted initiatives that optimize your end-to-end development life cycle
Track and analyze your software delivery performance
Whether you want to assess performance by team, service, or environment, Datadog DORA Metrics adapts to your structure and your scope, helping you move past broad averages to focus on what actually reflects your delivery performance. This makes it easy to understand how your teams ship and scale. In a previous blog post, we explained how to get the most out of DORA metrics—by establishing the right scope for your organization and standardizing data collection. Here, we take the next step: analyzing DORA metrics to turn observations into action and drive meaningful improvements across your software delivery life cycle.
Historical trend views enable you to monitor how your DORA metrics evolve over time and pinpoint the root causes behind unexpected changes. Let’s say you’ve noticed a previously high-performing team is deploying less frequently, and you discover it’s due to an increase in change lead time.
You observe that deployments with longer-than-usual change lead times consistently include a high number of commits.
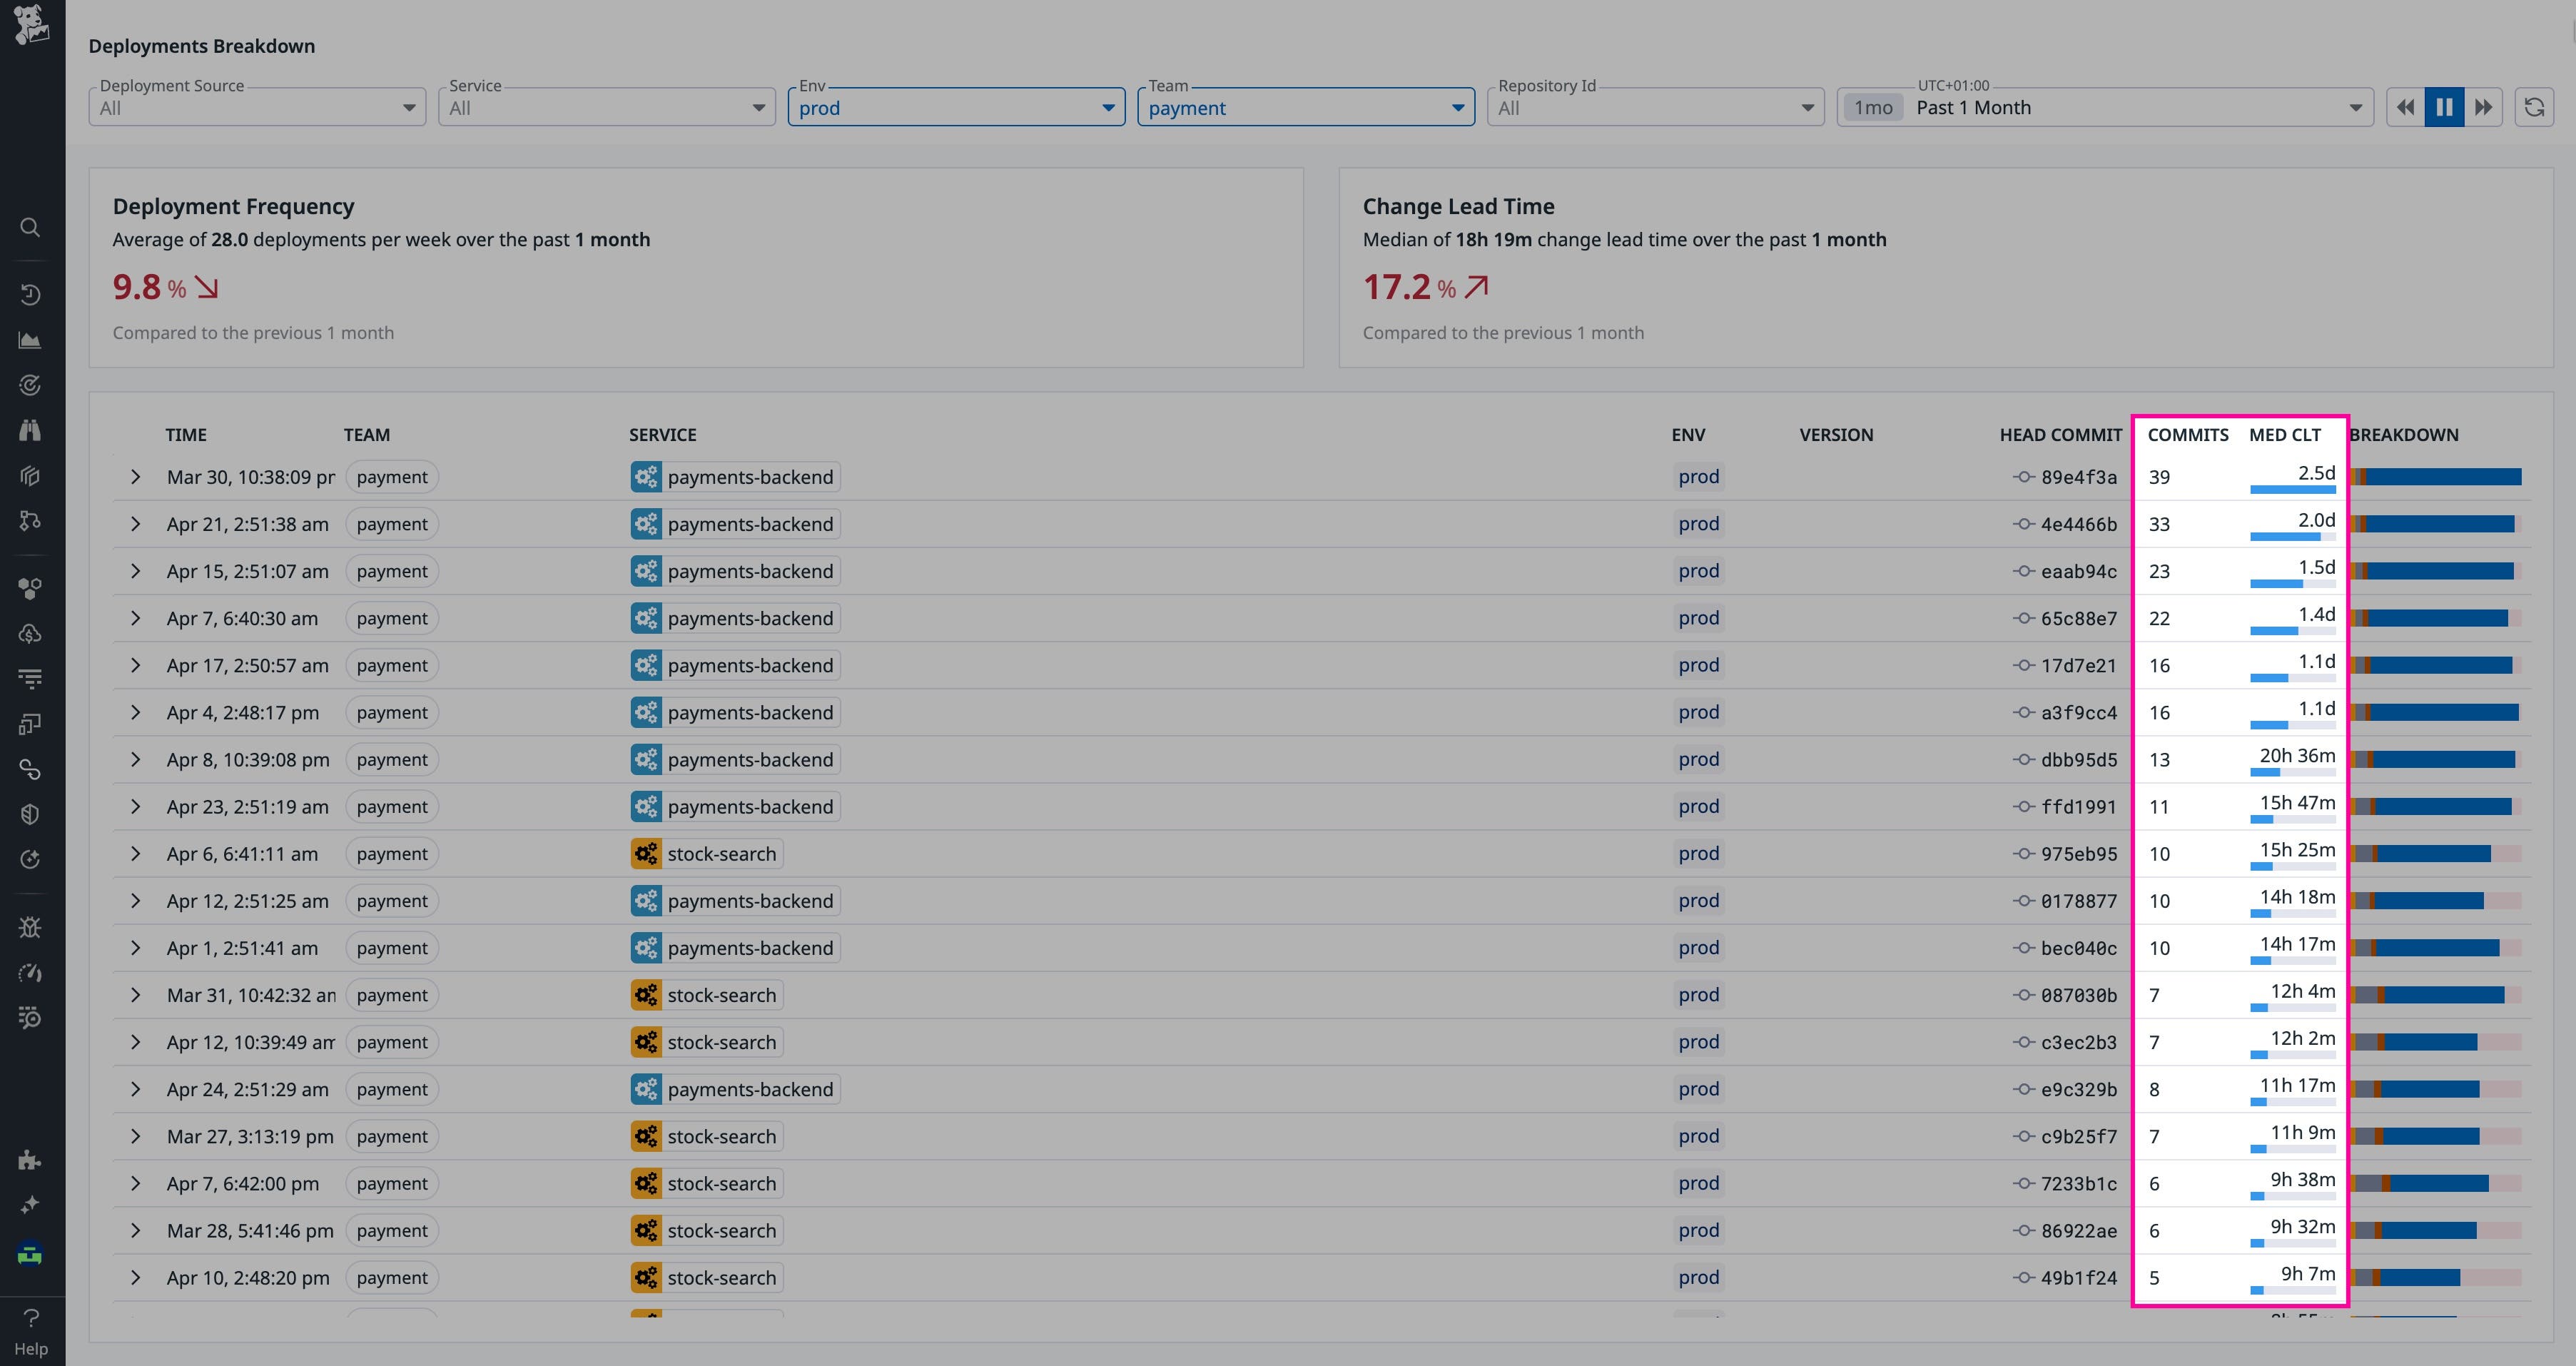
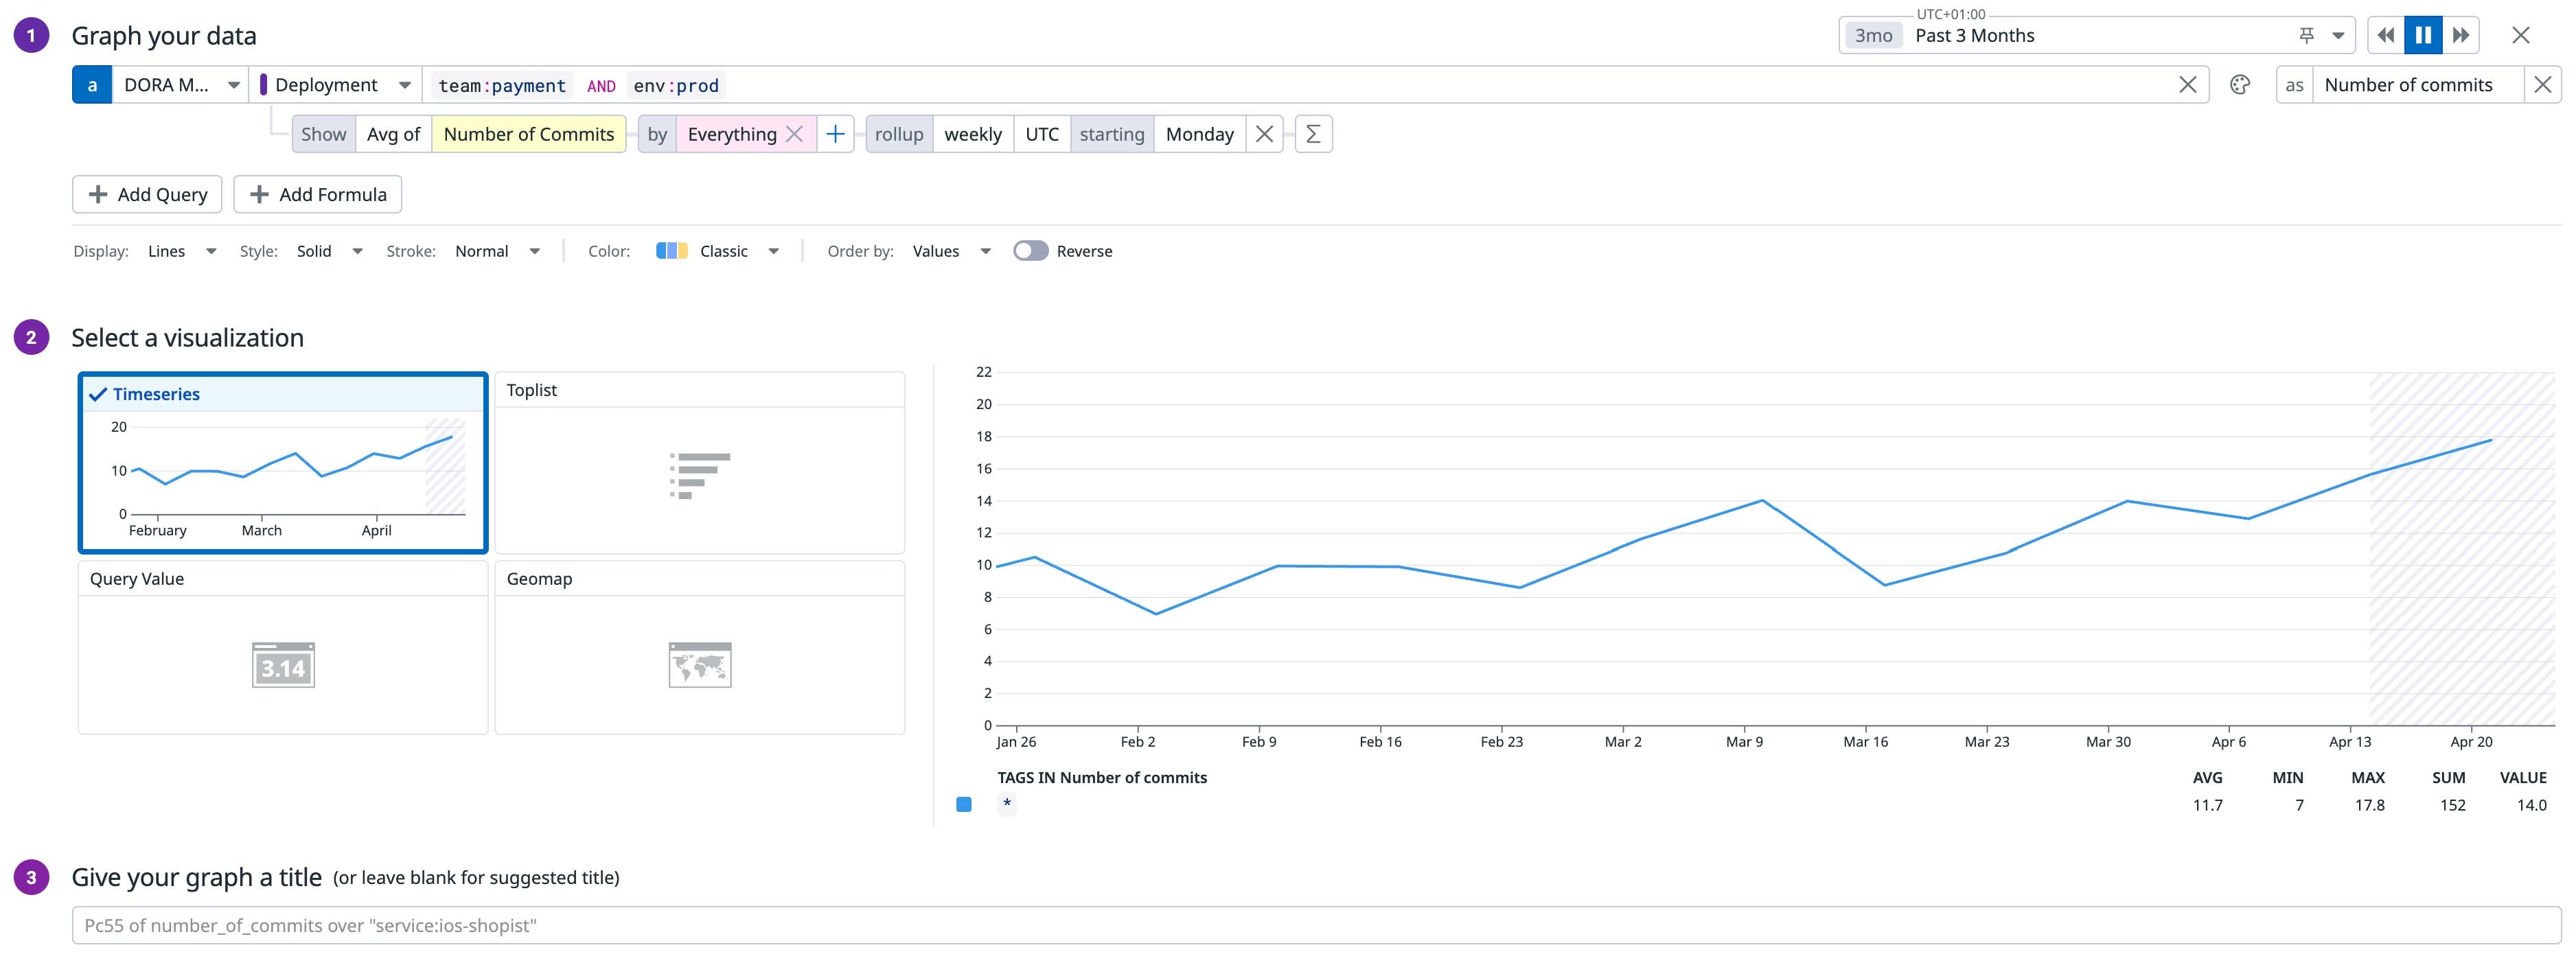
You decide to dig deeper by analyzing how the number of commits per deployment has evolved over time, suspecting it might be behind your team’s declining performance in velocity. You create a graph and discover your team has slowly but gradually increased its batch sizes, leading to slower delivery. This gives you a clear area for improvement that you can start acting on.
Datadog DORA Metrics filters out noise by isolating only the commits that are relevant to your service, so that even in complex setups like monorepos, your metrics reflect real work, not incidental changes. Even when you use squash merges that obscure commit history, Datadog analyzes the original commits to maintain visibility into what was actually delivered. This commit-level granularity gives the precision that engineers need, while still being interpretable and actionable for management
Surface bottlenecks across your delivery workflow
To dive deeper into inefficiencies and identify bottlenecks, Datadog breaks down change lead time into key stages of the delivery life cycle. This granular breakdown reveals exactly where time is being lost, whether that is slow pipeline execution before merging, delayed approvals, or blocked deployment queues.
For example, using Datadog DORA Metrics, you might notice one team’s pull requests (PRs) consistently take longer to review compared to others. Digging deeper into the data, you find that each PR requires approvals from multiple teams due to complex interdependencies, even when the impact is minimal.
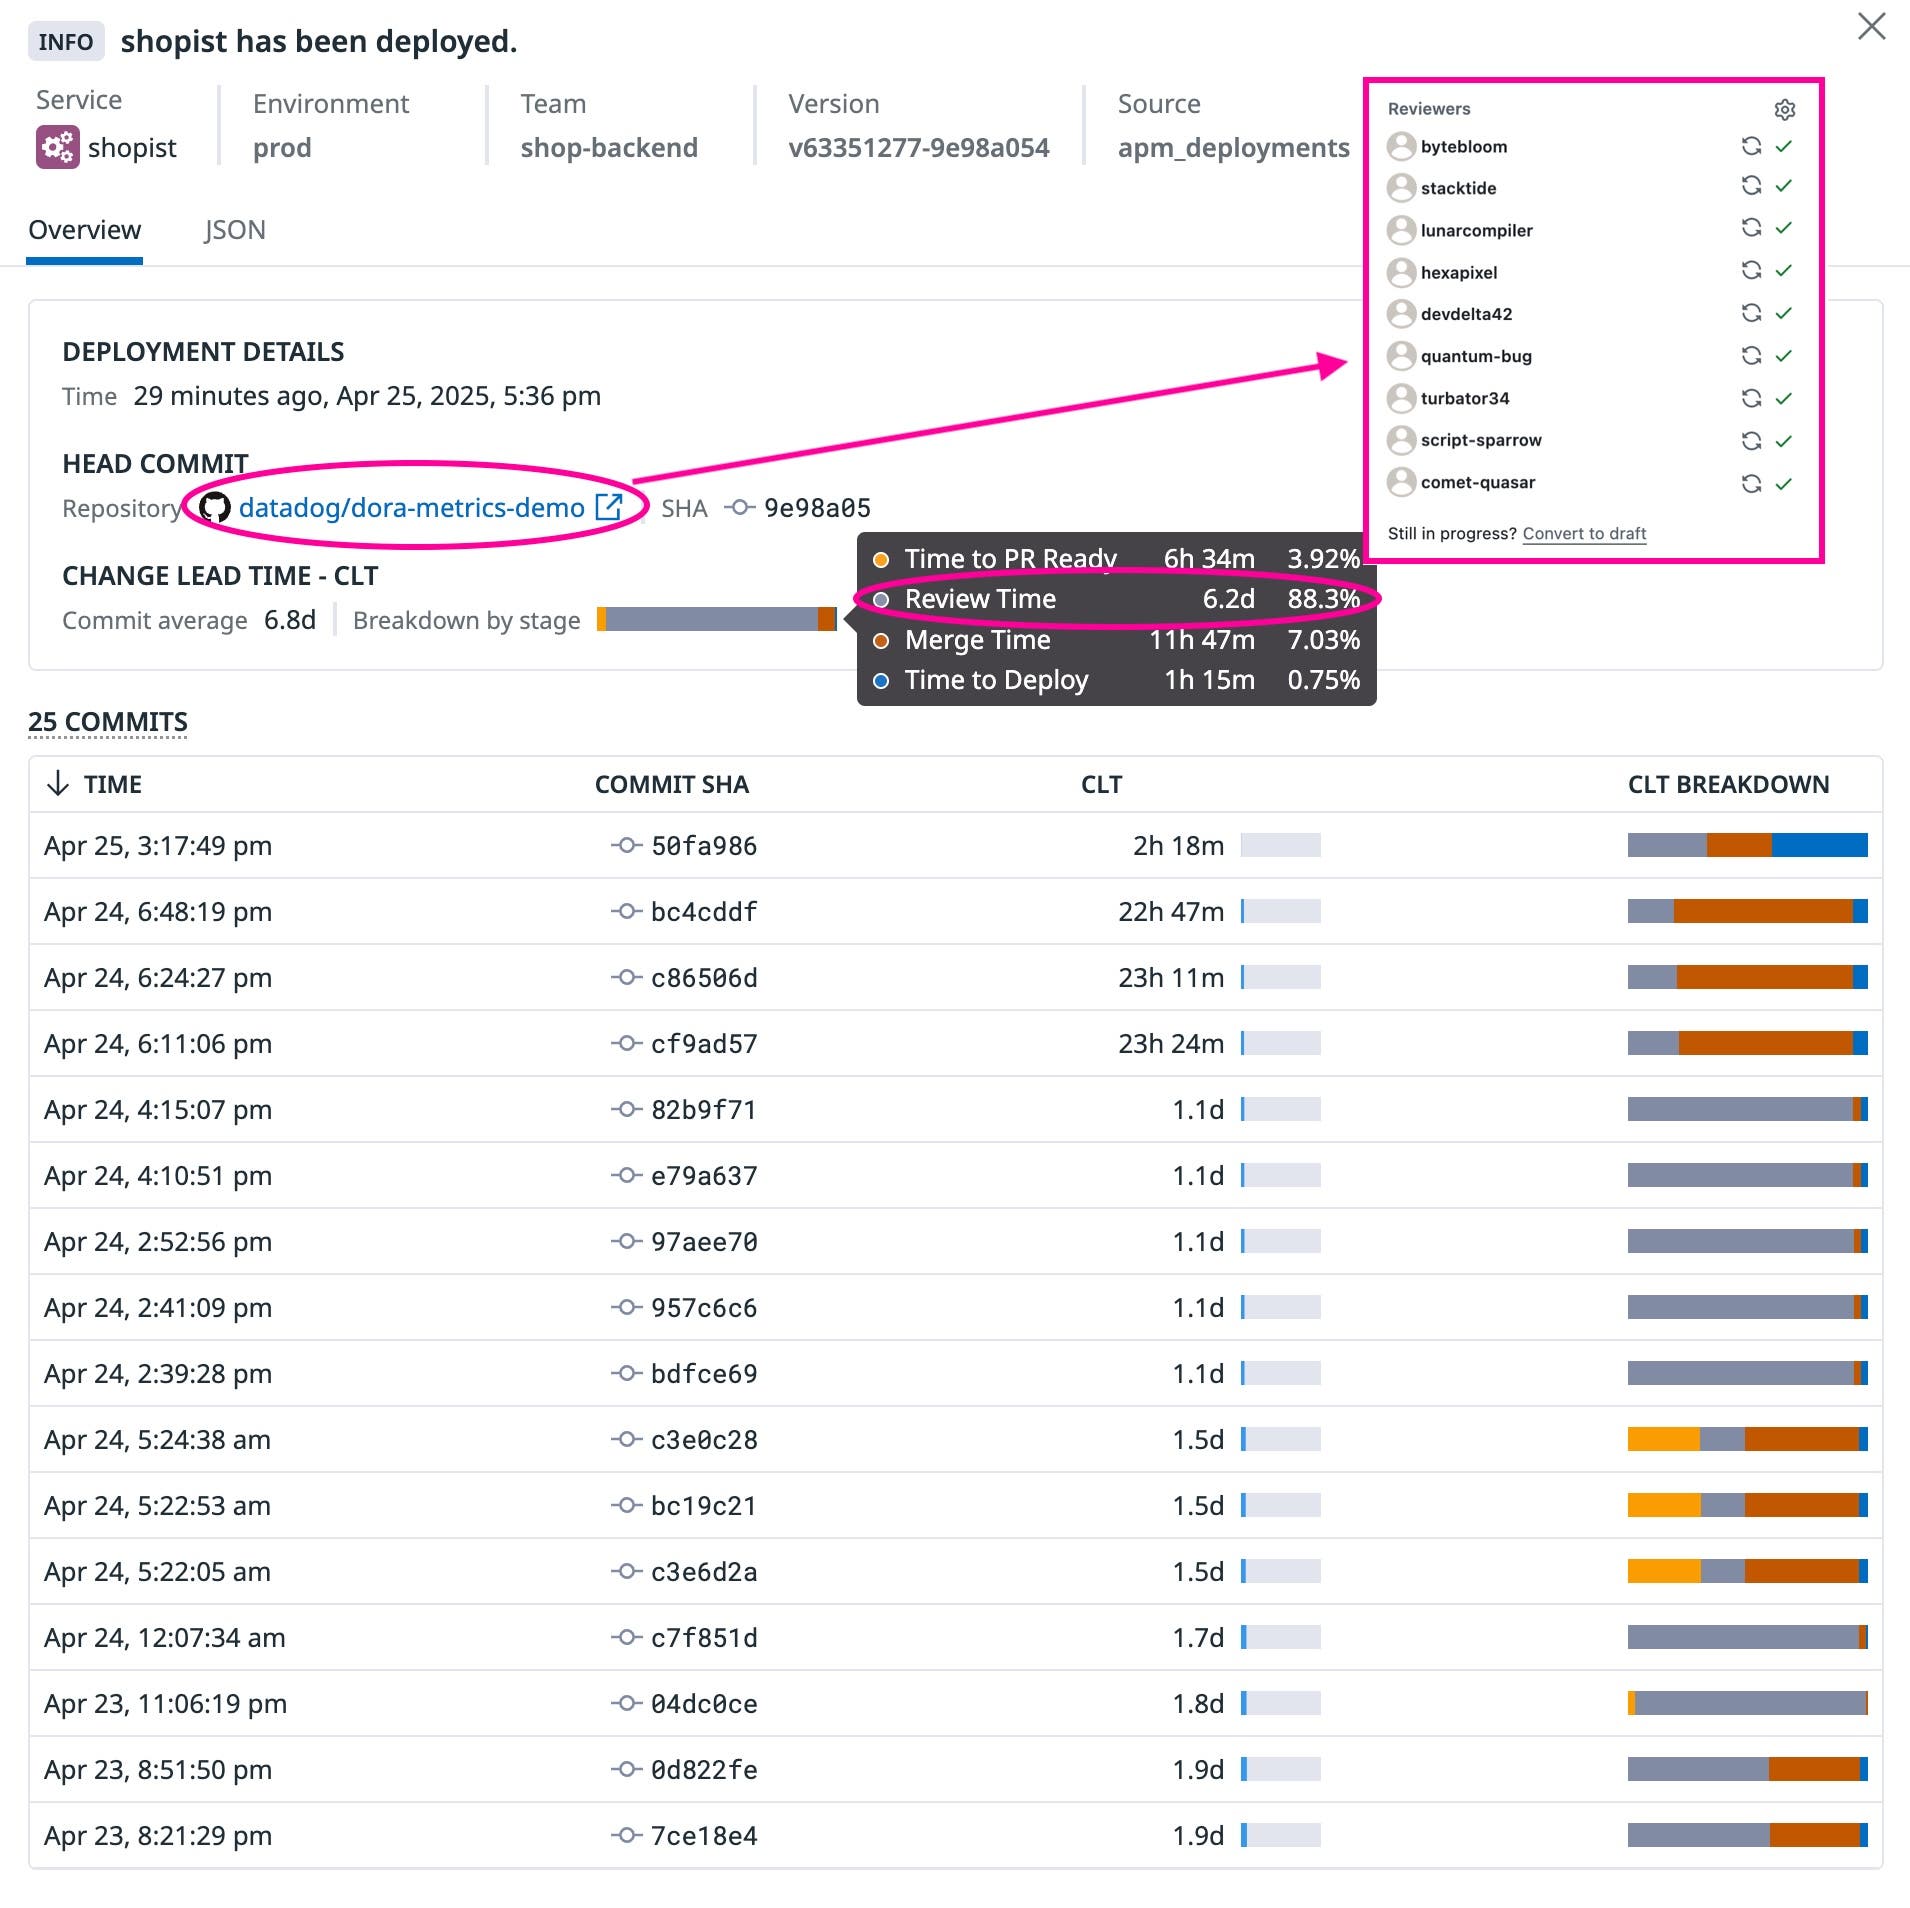
As your platform became more stable over time, some of these approvals became unnecessary—but now, they are still creating bottlenecks and slowing down your development flow. With this knowledge, you determine that simplifying PR approvals will help you eliminate friction and accelerate your team’s delivery velocity.
Launch targeted initiatives that optimize your end-to-end development life cycle
When you’ve identified areas for improvement, Datadog DORA Metrics helps you turn insight into action. By comparing teams and services, you can uncover top-performing teams and learn from their practices, providing an example of what works within your organization.
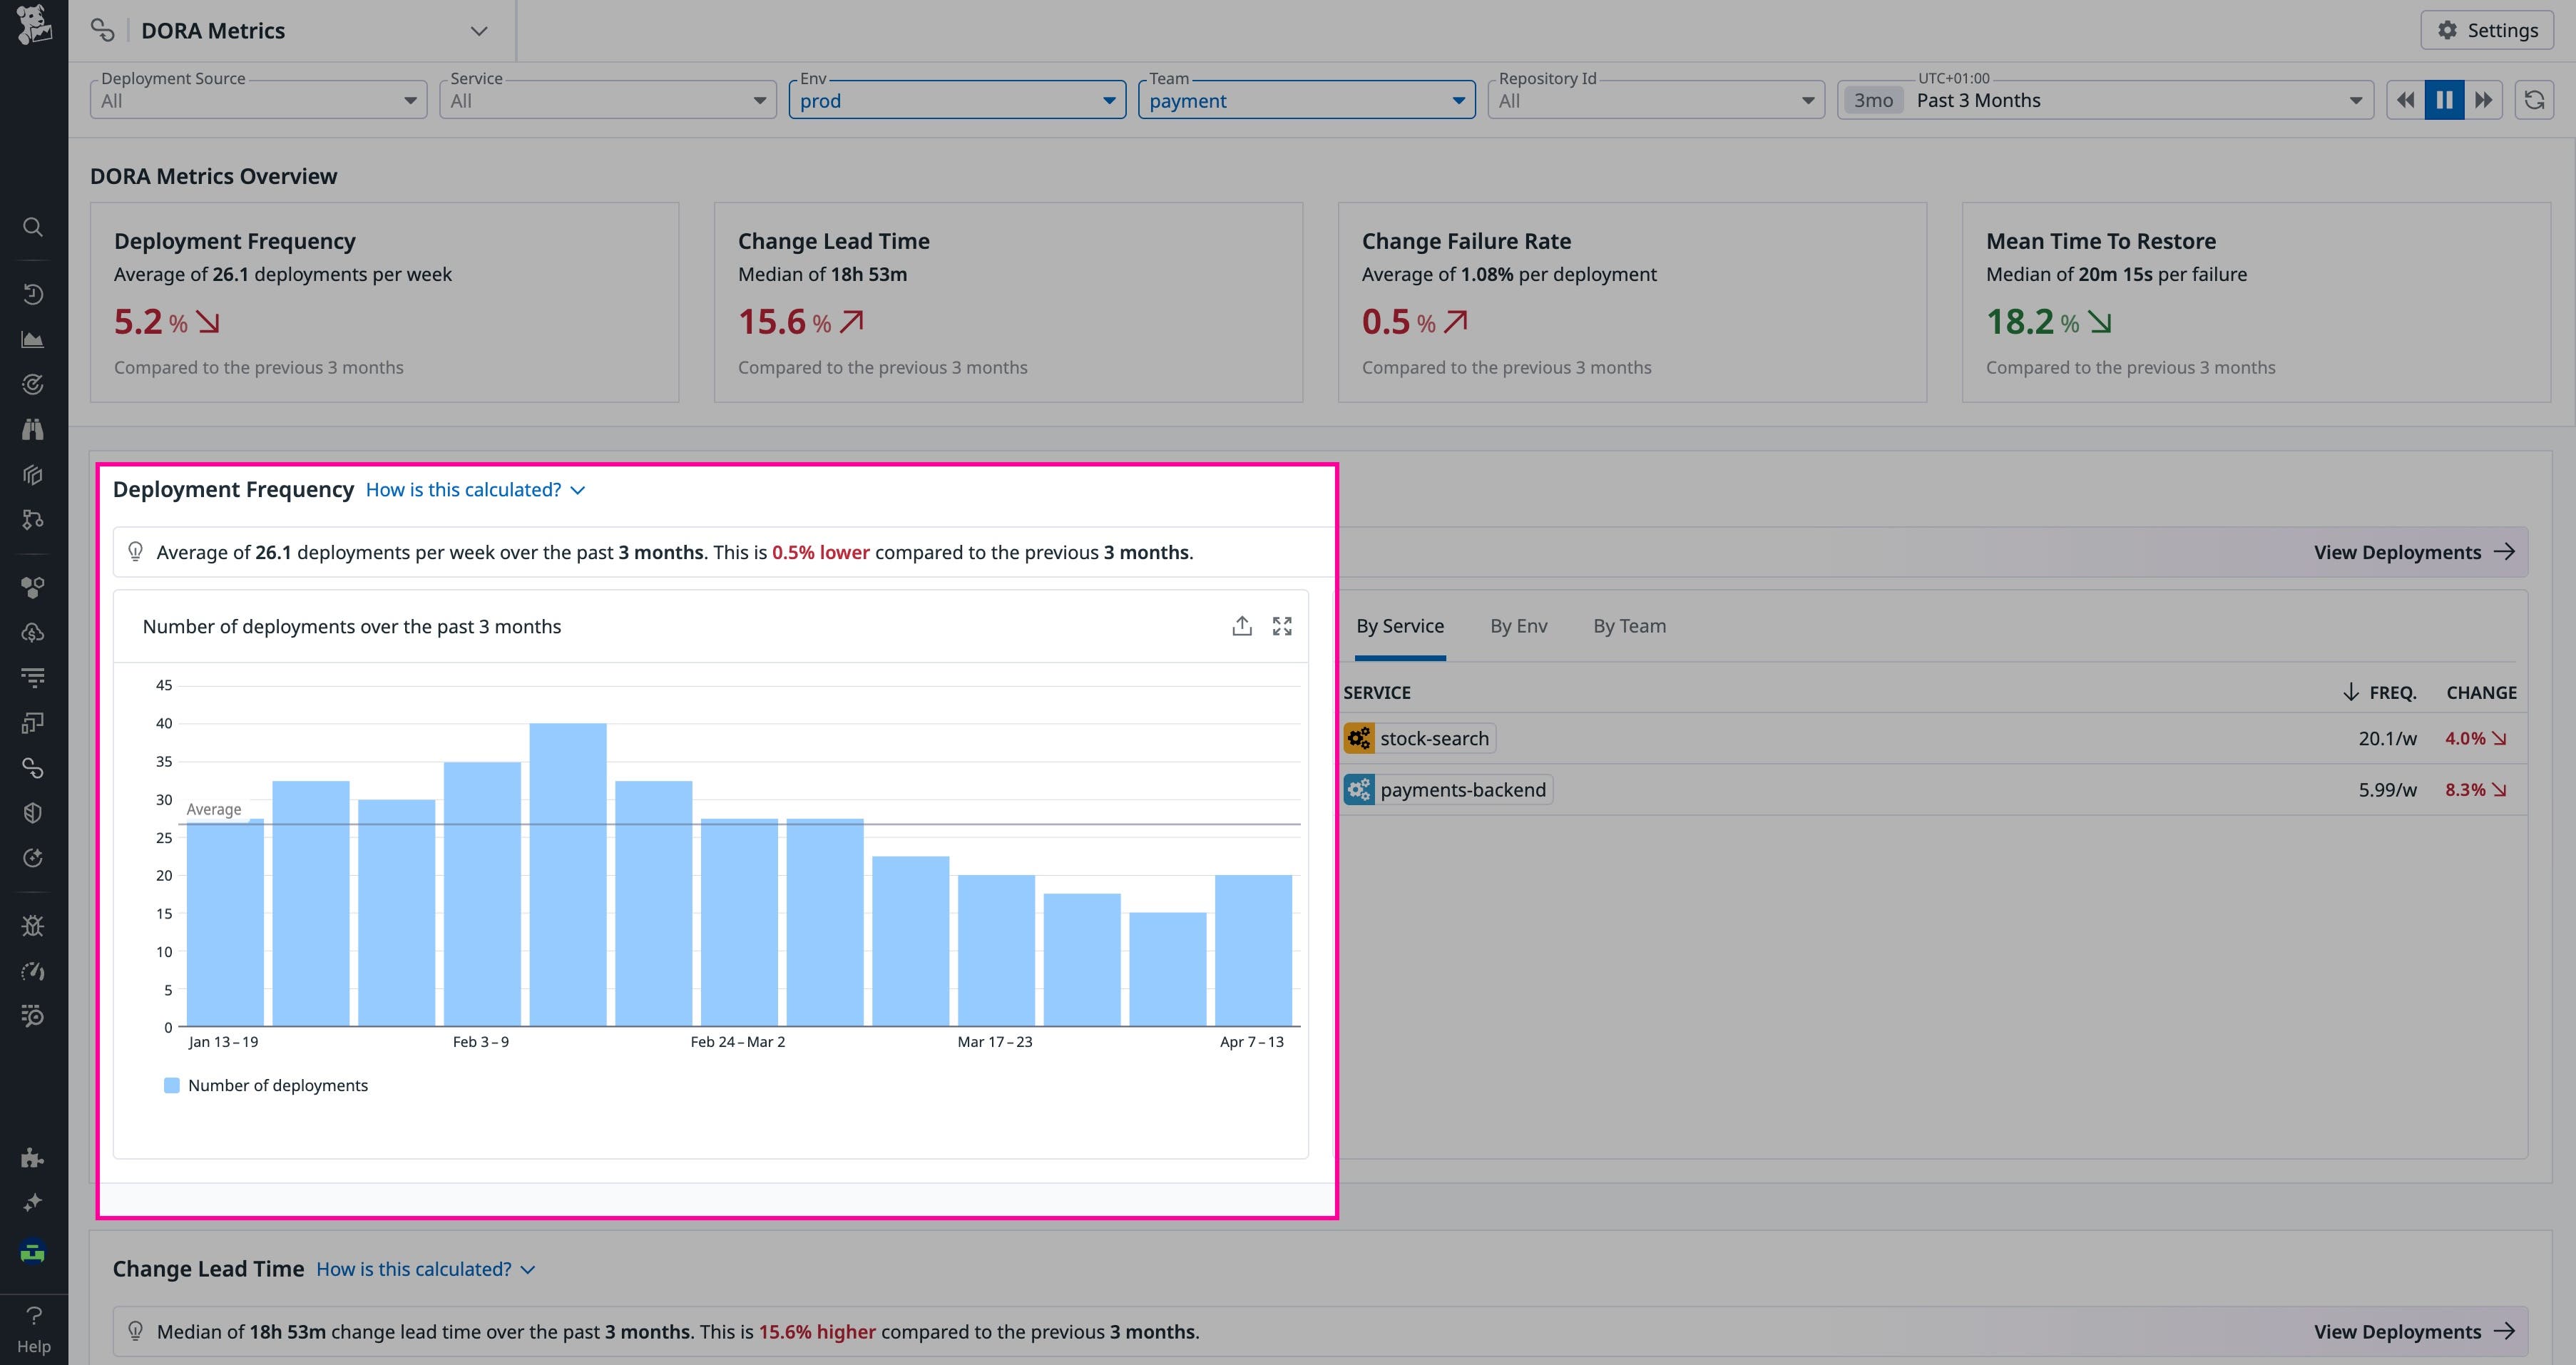
In the screenshot below, for instance, you can see the payment team has the lowest change failure rate on average. After reaching out to them, you learn that their strategy of limiting work in progress is helping them accelerate task execution, reduce complexity, and make changes easier to test and deploy safely. These insights make it easy to kick off targeted initiatives, whether that means unblocking slower teams, scaling effective processes, or reshaping priorities based on what’s already delivering results.

Because improving DORA metrics goes deeper than only improving the delivery pipeline, the DORA framework also provides a list of underlying drivers that accelerate software delivery and enhance overall organizational performance: the DORA Capabilities. You can use DORA metrics to justify pursuing these kinds of initiatives and evaluate their impact.
Let’s say you’ve identified team experimentation as one initiative you want to pursue to enhance the developer experience within your organization and ensure your teams are empowered to explore ideas, test solutions with real users, and iterate their way to success. To pursue a culture of team experimentation, you introduce Innovation Weeks—dedicated five-day sprints where developers pause roadmap work to prototype fresh ideas, tackle persistent tech debt, or finally squash flaky tests. With the tight five-day constraint, teams feel urgency, autonomy, and freedom to experiment and ship rapidly. Soon, you hope to notice measurable improvements, not just in creativity, but also in your delivery metrics.
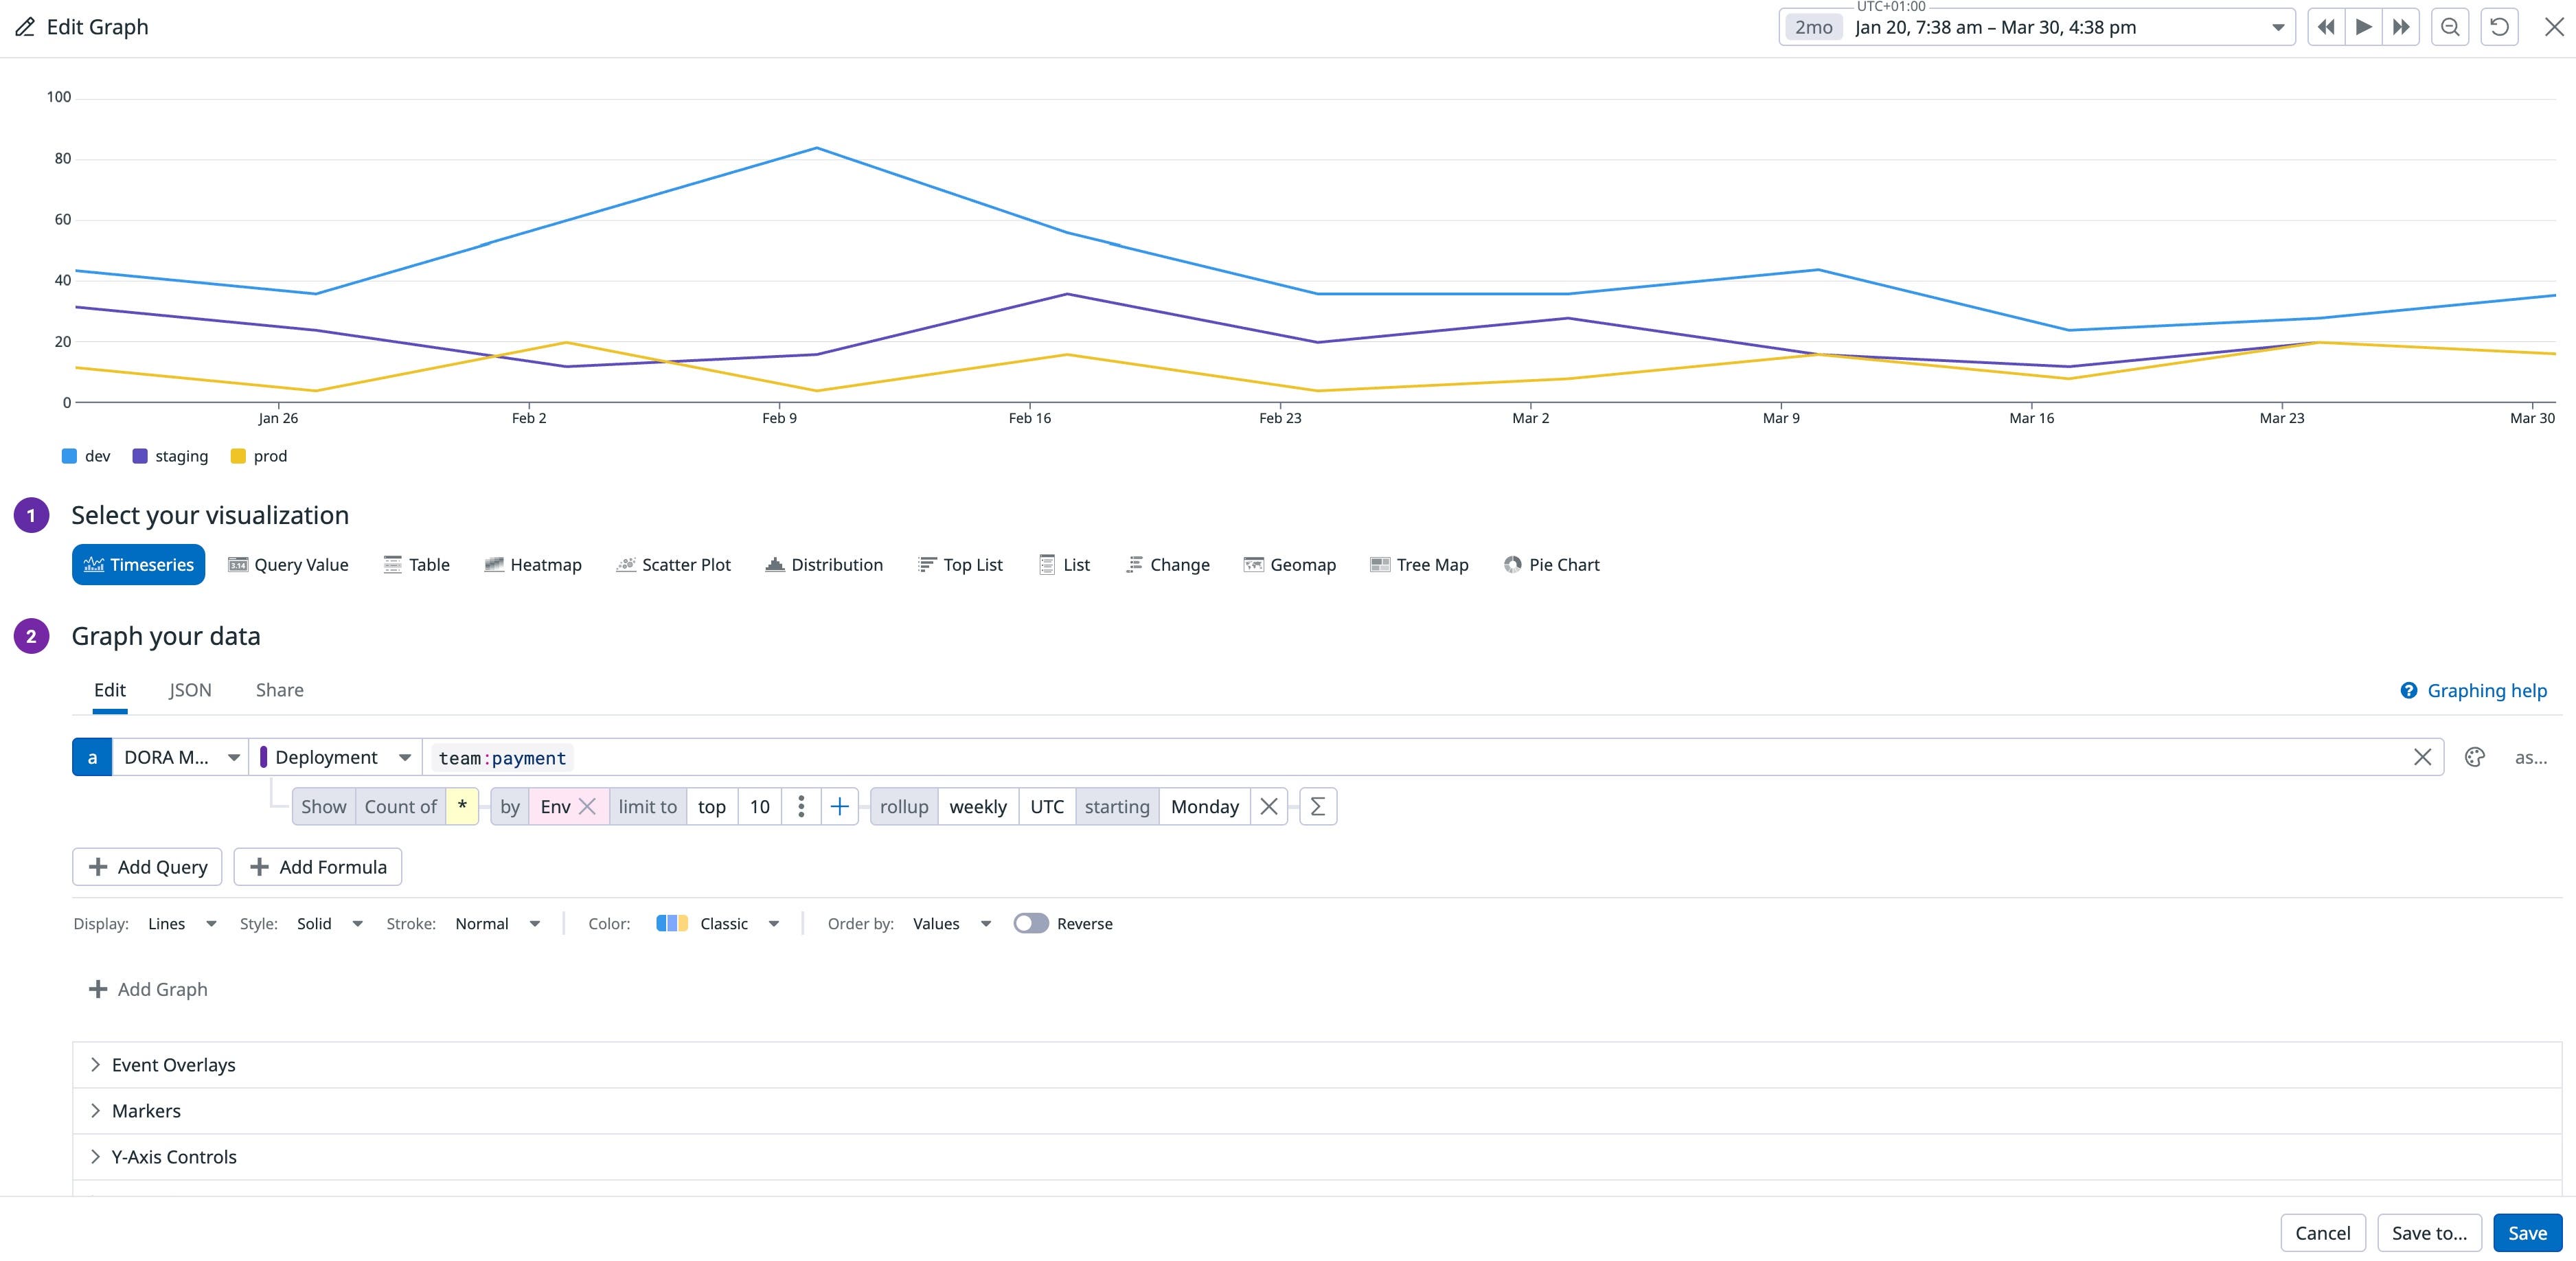
A few months after implementing the initiative, you review the first Innovation Week’s impact on one team. During that five-day sprint, from February 5 to February 10, the team shipped code far more often than in a normal week, except in production, as expected when roadmap work is on hold. In addition, in the weeks following Innovation Week, staging deployments started increasing, production releases rose, and reliability held steady. Seeing these improvements, you call the experiment a win and schedule another Innovation Week for next quarter.
Because Datadog DORA Metrics is fully integrated with the rest of your observability data, you can directly correlate delivery performance with system health and business metrics. For example, when you increase deployment frequency, you can create a dashboard in Datadog that lets you see whether this faster pace results in lower downtime and error rates, as well as how those improvements impact key business metrics like conversion or customer retention. By monitoring these performance trends across the stack, you can confidently make informed decisions and ensure that improvements in release velocity also support stability and long-term success.
Start improving your software delivery performance
By integrating with data you already collect through other Datadog products like APM and Datadog Incident Response, or data sent using our API, DORA Metrics gives you immediate visibility into how your teams are delivering and where to improve. Whether you’re monitoring deployment frequency, lead times, or post-release stability, the power of unified observability helps you connect delivery patterns to real-world outcomes.
To get started, check out our documentation—DORA Metrics is free to use if you’re already a Datadog customer. If you’re not yet using Datadog, you can sign up for a 14-day free trial.
*Recent DORA reports have introduced the deployment failure recovery time metric, which focuses on recovery from deployment-related issues. We’re working toward supporting these more targeted insights.
