Bowen Chen
Cursor is an AI-powered code editor that accelerates developer velocity by offering intelligent features such as contextual code completion; an agent that can retrieve context from your codebase, generate and run terminal commands, and detect and fix linting errors; and an embedded chat that can help answer questions that arise during development.
We’re excited to announce the Datadog Cursor extension, which gives developers access to Datadog features such as Error Tracking, Live Debugging, and more when interfacing with the Cursor IDE. The extension uses the Datadog Model Context Protocol (MCP) Server to expose Datadog APIs to Cursor, enabling developers to access observability data from Datadog without any additional context switching or manual copy and pasting.
In this post, we’ll walk through a debugging example where we use the Cursor integration to troubleshoot a real-world business problem, then generate unit tests to validate the application’s behavior after applying a suggested fix.
Troubleshoot using the Cursor chat and Datadog tools enabled by the MCP Server
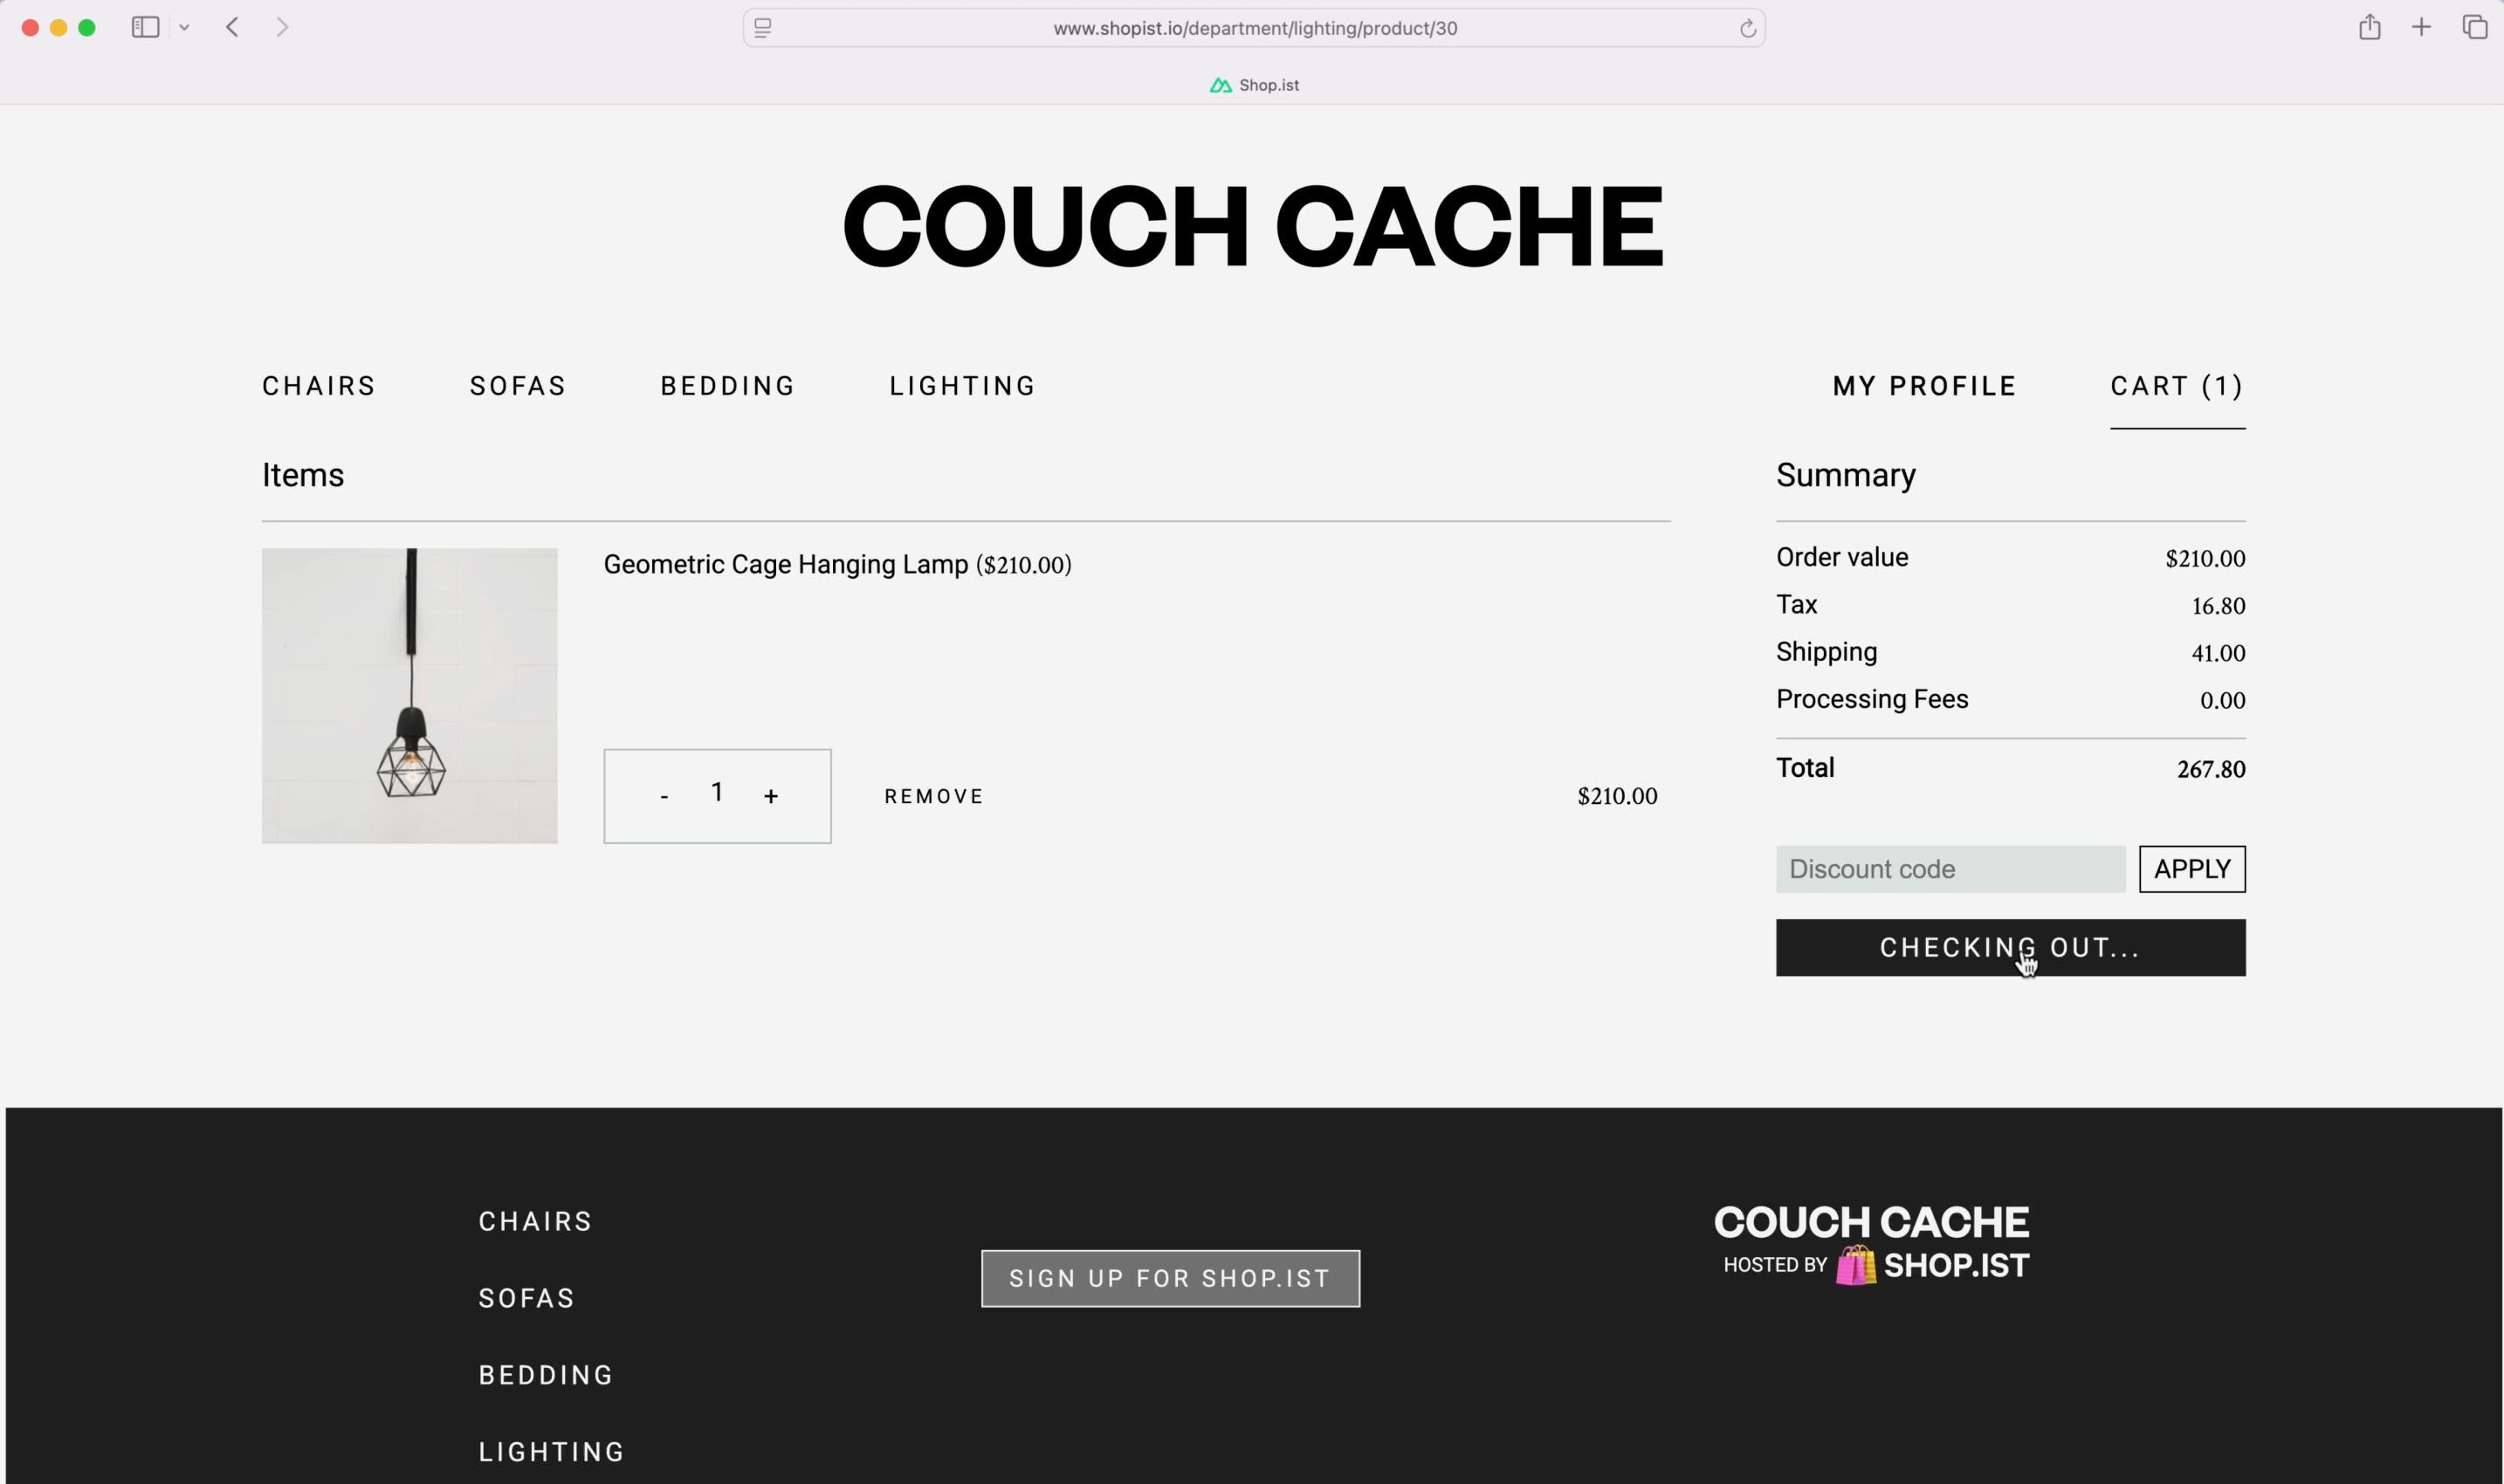
Consider a scenario where you run an online web shop, and one of your Datadog Monitors alerts you to an elevated rate of errors in the customer checkout workflow. Upon investigating, you find that when you click the checkout button, nothing happens. At this point, you would kick off your typical troubleshooting workflow, which may include using Datadog Live Debugging to identify the lines of code executed and variable data during runtime.

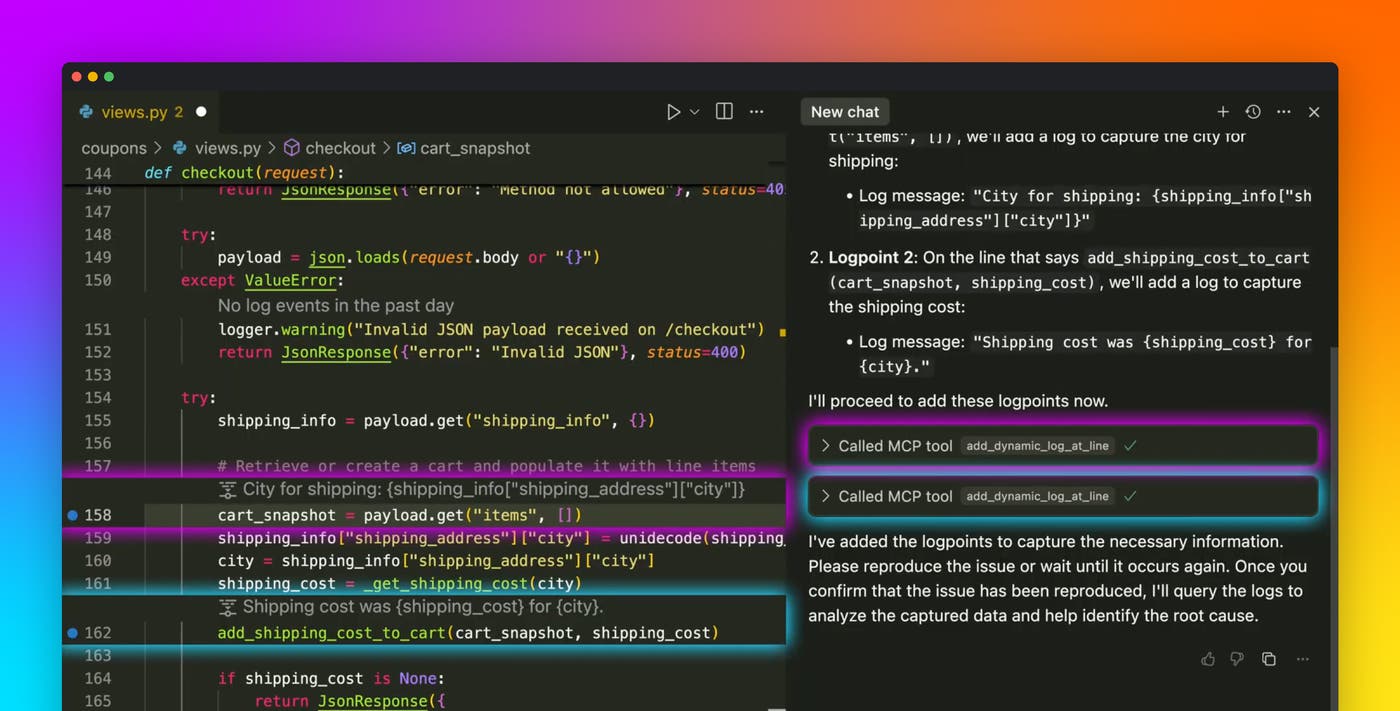
The Datadog Cursor extension enables you to take advantage of Live Debugger by adding and visualizing logpoints, directly in your IDE. After creating a new Cursor chat, you’re able to ask Cursor Agent to help you troubleshoot real-time production bugs and apply a suggested fix to reduce your time to resolution. In our example, we can provide the details of our issue to Cursor Agent, which in turn proposes a hypothesis as to what the root cause may be—in this case, a potential issue with the shipping calculator using the customer address. Then, Cursor suggests inserting dynamic logpoints to collect information that will either reinforce or dispute the hypothesis.
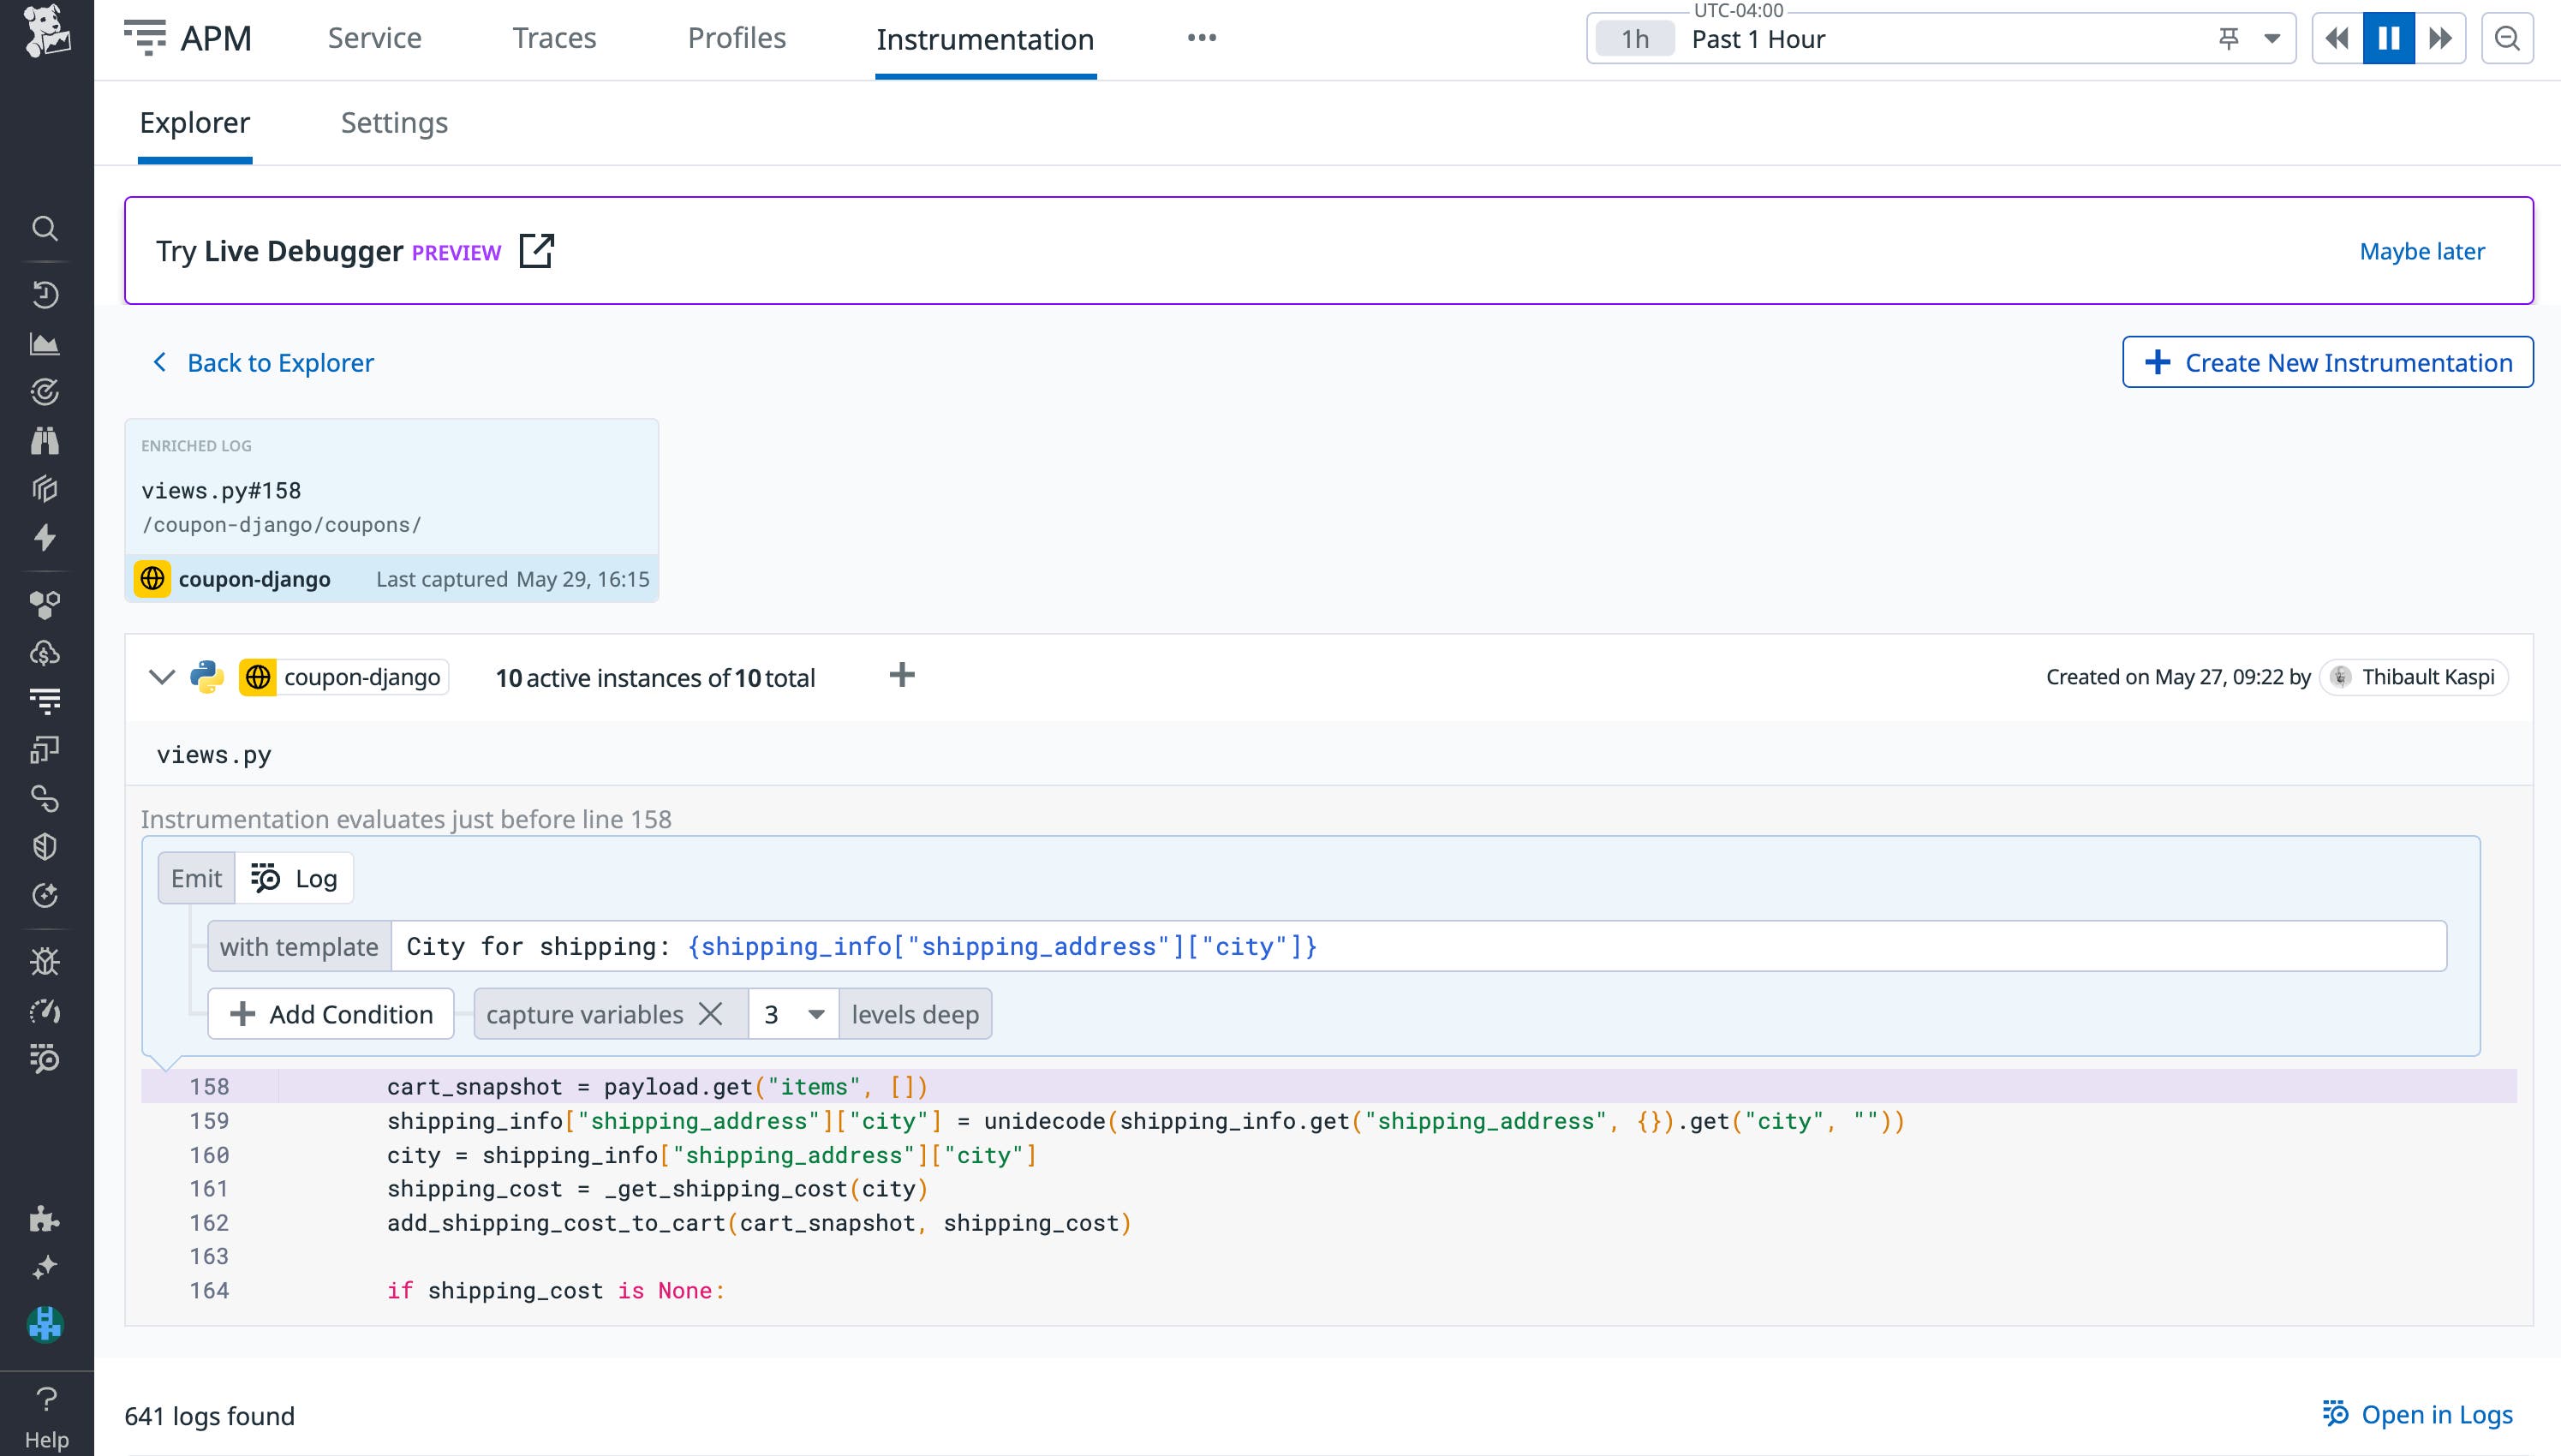
Cursor calls the Datadog MCP Server to use the add_dynamic_log_at_line tool to place logpoints at various locations within your application code, so Datadog can capture logs and variable snapshots—in this case cart ID, shipping address, and cost of shipping—from your application. This data is then made available to Cursor Agent (via a call to the get_logs tool) and can be viewed from within the Cursor IDE. Since these logpoints are placed using the Live Debugger, Cursor is able to insert them without pausing your application, and they will also automatically expire after one hour, so you don’t need to remember to manually clean up your code.
Now that you’ve inserted logpoints with the Datadog Cursor extension, it’s time to recreate the checkout error to generate some logs. Using the logpoints, Cursor is able to identify that the checkout issue surfaces when the shipping address is set to the city of São Paulo. Cursor also identifies that the reason for this is because city names are sanitized (and have their diacritical accent marks removed) before they are inputted into the _get_shipping_cost_function. This results in a mismatch with the keys stored in the _SHIPPING_COST_CACHE, which still retain the accents in city names.
In this example, the recommendation from Cursor is pretty straightforward: ensure that city names are handled consistently. You can continue to sanitize user entries in the city field—which protects your application against malicious HTML scripts and SQL injections—and also sanitize all values stored within the _SHIPPING_COST_CACHE to ensure that the cache’s key-value pairs match in cases such as “São Paulo.” By following the additional links that Cursor provides, you can easily locate the line(s) of code responsible, and also live variable values that the logpoints captured during the execution. For a more granular look into your Live Debugging Session, you can also view the logpoints from within the Datadog platform. From here, you can quickly copy and share enriched logs from the debugging session with team members and collaborators.

Generate unit tests using production data
In the previous example, we used the Datadog Cursor extension to diagnose a bug in your application. However, you still need to apply a fix and validate that your application code behaves correctly and reliably so that the issue doesn’t resurface. For this reason, you need to write unit tests.
The Datadog Cursor extension adds a “Generate Unit Test” button to log events that prompts Cursor to generate unit tests with live data taken from your application. This makes the test more accurate, since it’s grounded in live values. Continuing the previous example, you ask Cursor to generate a unit tests and run it against the live variable data taken from your application. Since we haven’t addressed the issue, the unit test fails as expected, and Cursor suggests a fix to be applied.
After confirming the suggested fix, the unit test passes, enabling you to validate that your checkout process is behaving as intended. Asking the agent to use a red-to-green strategy is a great way to ensure the problem is fixed correctly.
Enhance your Cursor workflow with Datadog today
The Datadog Cursor extension enables you to pull observability data, add live instrumentation, and create accurate unit tests directly from within the Cursor IDE. This feature is currently available in Preview—you can request access here. You can also learn more about how the Datadog MCP Server enables AI agents and developers to access Datadog tools in our blog post, or check out other features announced during this year’s DASH Keynote in the 2025 DASH roundup guide.
If you don’t already have a Datadog account, sign up for a free 14-day trial today.


