Thomas Sobolik

Alex Flinois
When you’re responding to an issue with your application in the heat of on-call, you need reliable, well-maintained tooling that’s painless to use. Otherwise, the time you’ll spend combing through monitoring data for context, connecting to hosts and other infrastructure resources, and pivoting between consoles for various managed services can add up quickly and slow your response.
By integrating your ops tools into your monitoring stack, you can cut down on context switching to perform complex monitoring and remediation tasks faster. And with the assurance that these tools are secure, work well at scale, and are accessible throughout your organization, you can comfortably rely on them in production. That’s why we’re pleased to announce Datadog App Builder, a new low-code interface for creating applications that you can use directly within the Datadog platform to manage your systems.
Apps are made up of pre-built UI components; Datadog data sources like metrics, logs, and monitors; 300+ out-of-the-box actions for key tools and platforms (including GitLab, GitHub, OpenAI, and a host of AWS and Azure services); and your own custom logic. Apps can handle complex tasks with little end-user effort—summarizing pull requests, scaling container clusters, running serverless functions, and much more. You can run apps as widgets in your dashboards or share them using a dedicated URL so users can interact with them on their own.
In this post, we’ll show you how to use the App Builder’s API and database connectors, integrations, and visualizations to quickly build internal tools without needing to write or maintain code.
Drag and drop components to quickly spin up apps
You can create apps with the App Builder by dragging and dropping UI components such as buttons, selection lists, tables, modals, and text inputs. You can then populate or contextualize these components by creating queries for integrations, API endpoints, and more. Once you’ve built an app, you can publish it so that other users in your organization can access it, add it to their dashboards, and iterate new versions.
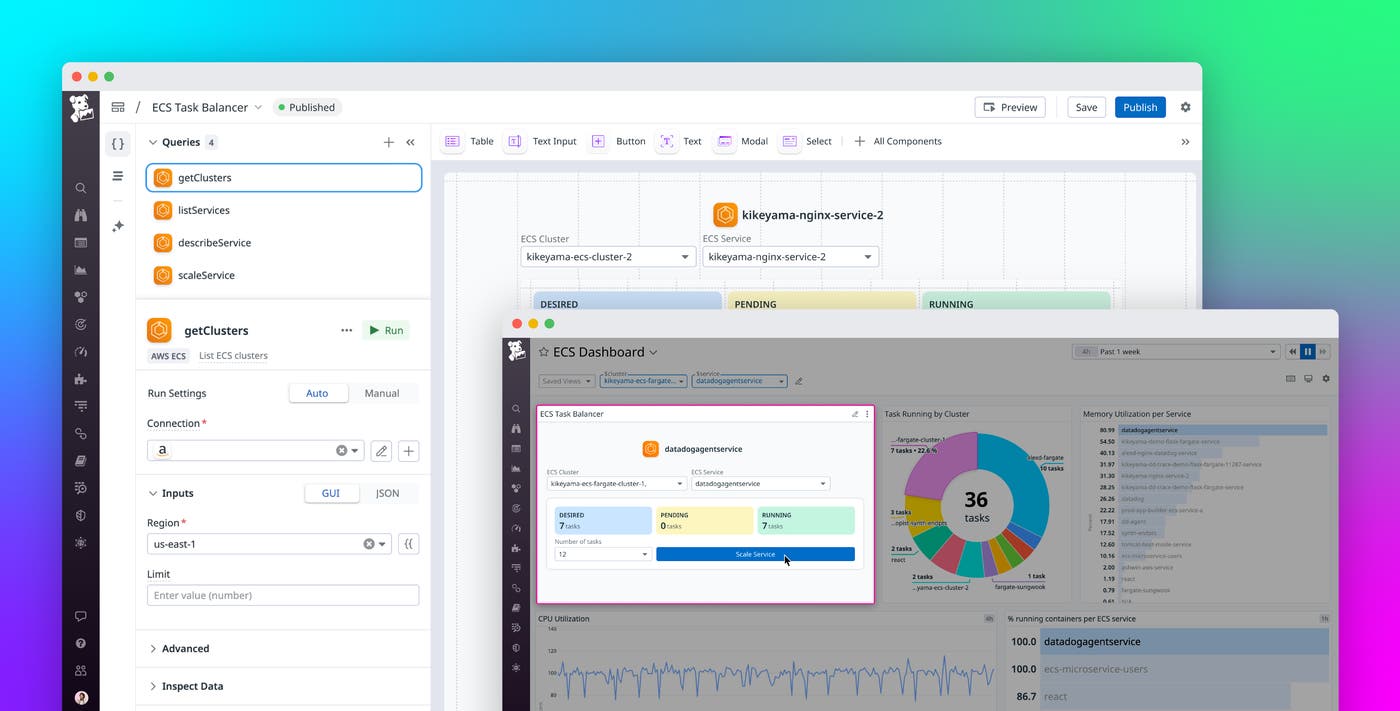
For example, let’s say your team is managing an ECS cluster and wants the ability to quickly allocate more resources when their containers are experiencing CPU and memory overutilization. The App Builder integrates with ECS, which enables you to request information about your active clusters and services—as well as perform actions such as scaling a service—all from within the Datadog platform.
To build this app, you can start by dragging and dropping components that enable users to select a service and choose a number of tasks to allocate to it. The App Builder lets you populate the app’s UI with demo data at first, so you can preview and tweak it to your liking. Then, you can connect the app’s components to real data by building queries using Datadog’s ECS integration. To allow users to change the scaling of the selected service, you can add a button to trigger a new query called scaleService, which takes in the desired task count and service name. When the button is clicked, the query will submit a request to automatically update the specified service’s task count. Below, we can see the process of building our new ECS scaling app in action.
The App Builder lets you easily test your apps using a live preview before you publish them to the rest of your organization. Once your app is finalized, you can embed it in your team’s ECS dashboard, enabling any user to immediately respond to problems revealed in its resource metrics by quickly scaling services. You can even configure your app to respond to the dashboard’s template variable filters, so it stays in the same scope as the rest of the widgets. The following screen capture shows the active app in an ECS dashboard, with its data filtered to a service running on an ECS cluster.
Easily manage, access, and run your apps
The App Builder makes it easy to manage, access, and run your apps. All of your organization’s published apps are accessible via the All Apps page, where you can search for them by name or sort by author or last modified date. To manage access to your published apps, you can configure viewing and editing permissions on them. You can also clone any app with the click of a button to spin off a new version.
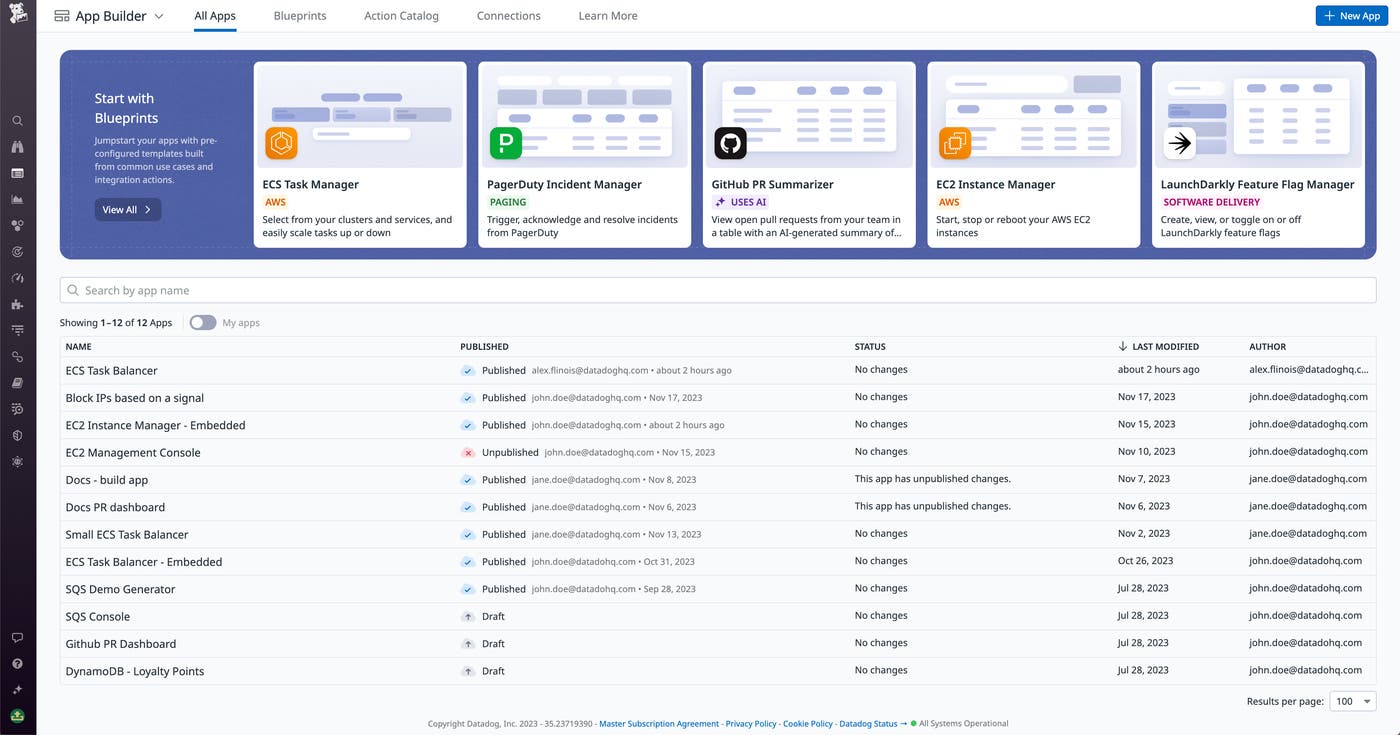
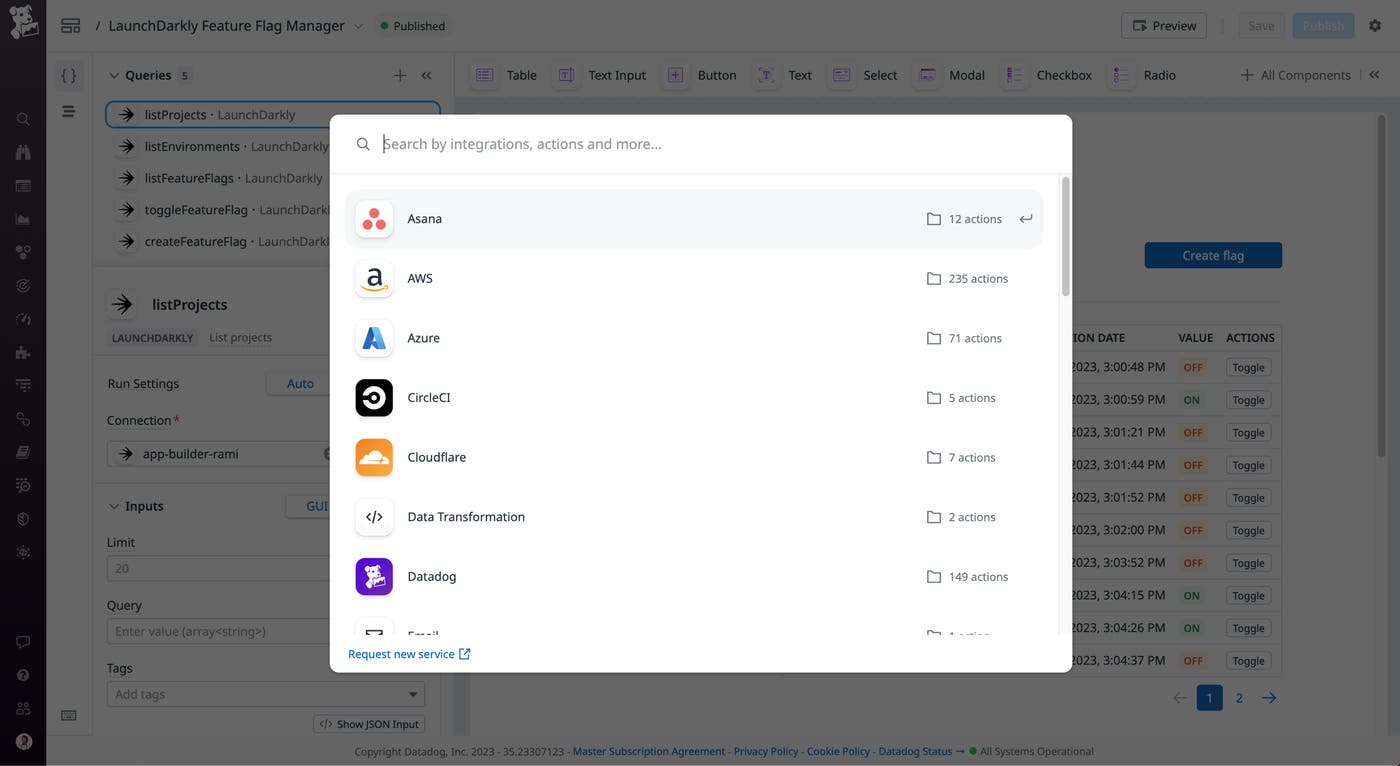
The App Builder features a set of blueprints that implement common use cases—such as managing EC2 instances, configuring Elastic Beanstalk applications, and managing incidents with PagerDuty—as templates that you can use as starting points for new apps. You can also inform your ideas for apps by browsing the Action Catalog, which provides a library of all the currently supported action integrations you can use to create queries. These integrations include cloud platforms like AWS and Azure, CDNs like Cloudflare and Fastly, CI/CD tools like GitLab and CircleCI, productivity tools like Jira and Notion, security tools like Signal Sciences and GreyNoise, and many more.
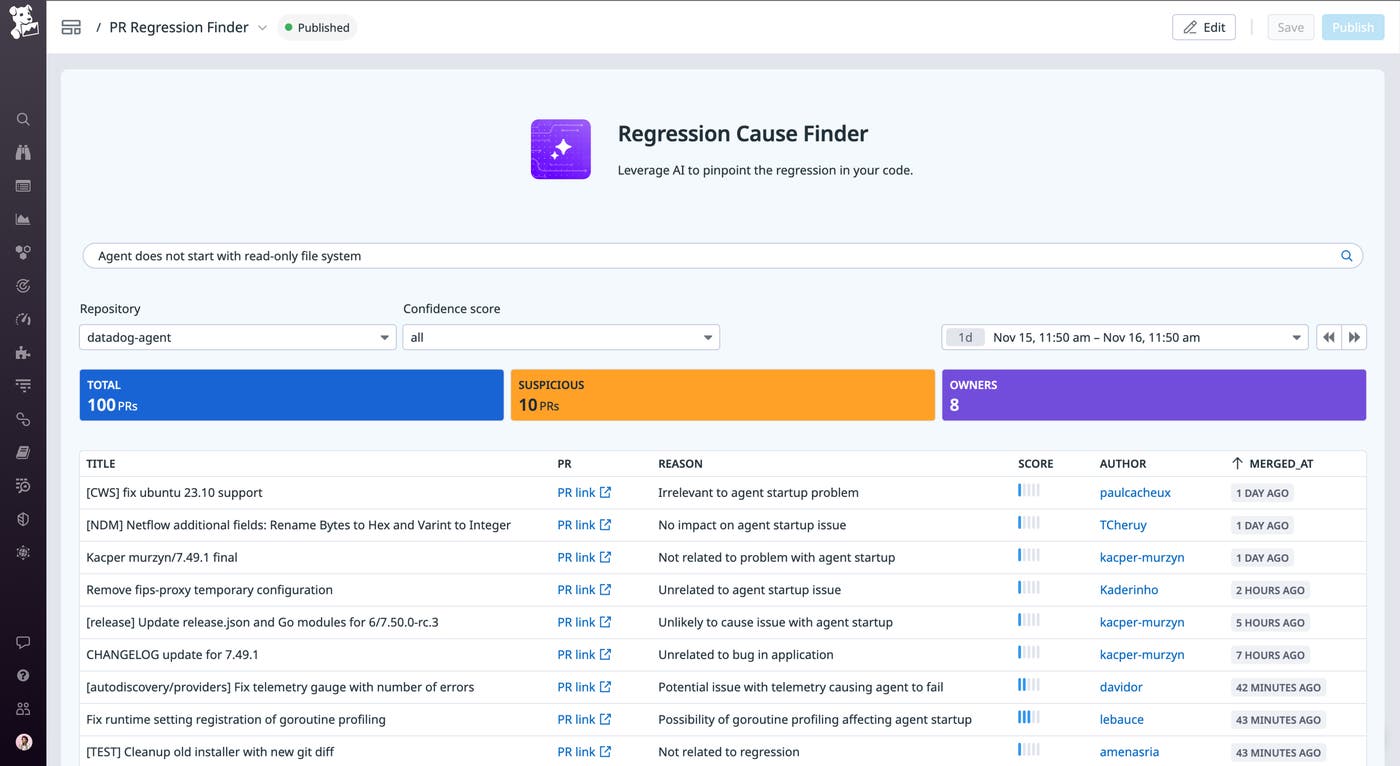
Additionally, the App Builder’s included OpenAI action helps you use generative AI to create apps that leverage natural language processing, data generation, and anomaly detection. We’ve included a set of AI app blueprints to help you get started on building these applications. For example, the Regression Cause Finder can be implemented to look at the text description of an incident and the most recent commits related to it, and then identify the most likely causes of a code regression. In the following screenshot, you can see the Regression Cause Finder’s UI containing a list of potential causes and their associated PRs.
Add your own code and create custom queries
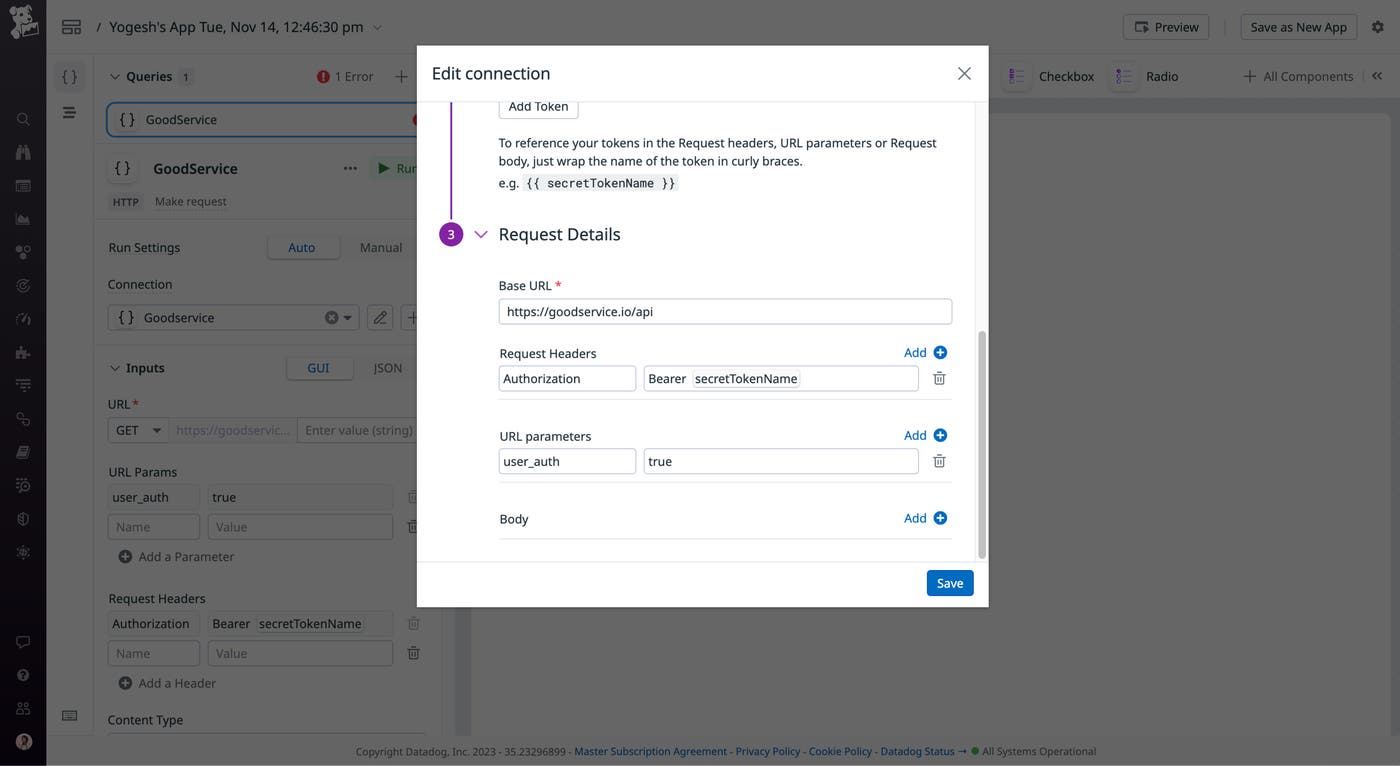
In addition to leveraging the App Builder’s out-of-the-box query integrations and drag-and-drop elements, you can augment your apps with custom queries and logic. This helps you connect your apps to other internal tools, structure and process data, and fulfill use cases that go beyond the queries and actions supported by the included integrations. You can use custom queries to ping any HTTP endpoint and fetch data, perform an API test, trigger a function in your business logic, and more. For example, the following screenshot shows an app that uses an HTTP query to test token authentication on a web app’s homepage.
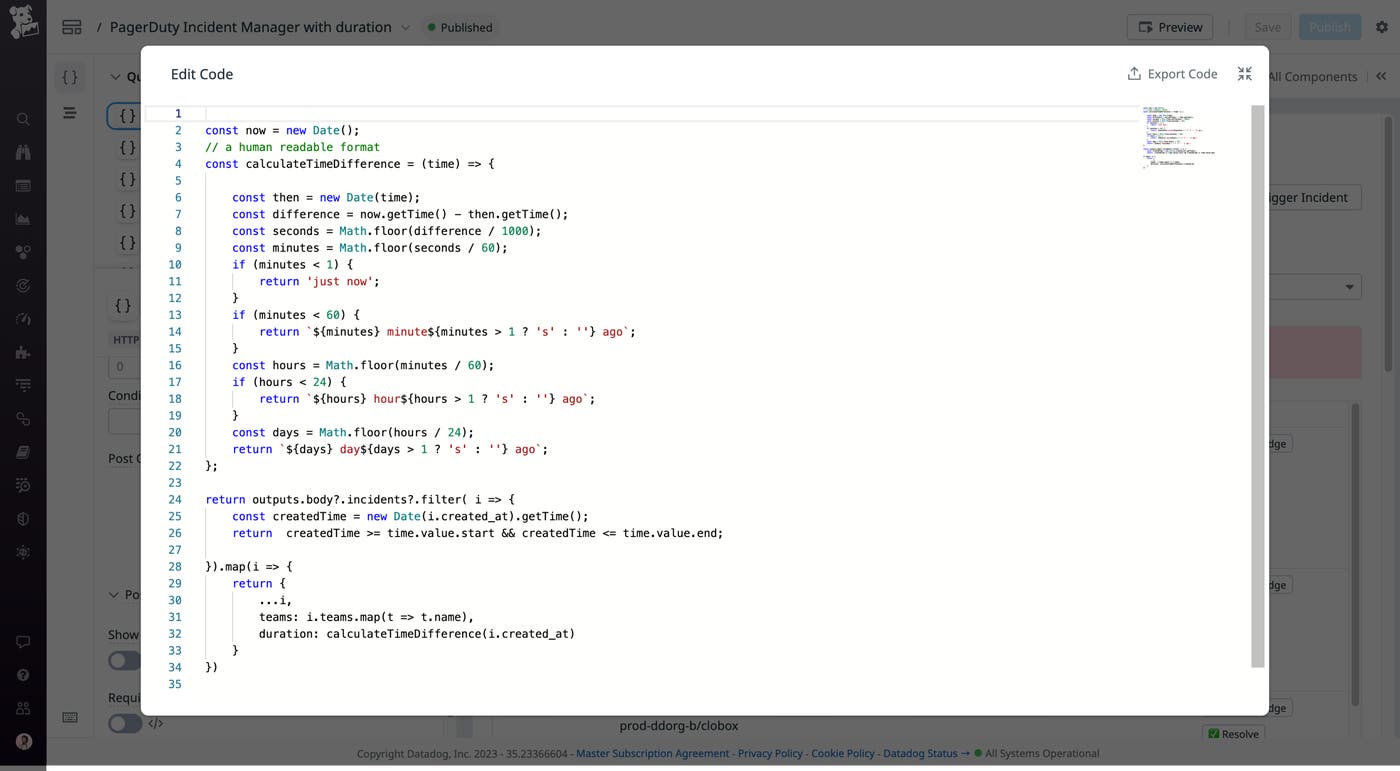
And by including custom logic in your apps, you can augment their functionality with simple scripts without having to worry about UI implementation. You can add custom logic to your app’s queries by using the included JavaScript action or by adding code to your queries’ Post-Query Transformation. The following example shows a Post-Query Transformation that converts incident timeline data from the PagerDuty API into a more human-readable format.
Monitoring and remediation in a single pane of glass
Datadog App Builder makes it easy to build and run applications that enable you to perform complex monitoring and remediation tasks directly within the Datadog platform. This helps you fix issues faster and get richer insights, and increases the scope of what you can do with your monitoring stack. App Builder is now generally available for all Datadog customers. For more information about App Builder, see the documentation. If you’re brand new to Datadog, sign up for a free trial.
