
Abril Loya McCloud
When an incident disrupts availability or performance, you want to be able to investigate, correct the problem, identify warning signs for the future, and document it all. Usually, this involves seeking out information from different services, gathering metrics and screenshots, then compiling and distributing your findings through email, wikis, or text docs.
Datadog’s new Notebooks feature allows you to combine real-time or historical graphs with Markdown cells to:
- Create postmortems anchored with live or historical graphs.
- Build dynamic runbooks.
- Graph your metrics in an exploration sandbox for troubleshooting.
Better postmortems
Notebooks allow you to create detailed postmortems that you can share with your entire team. Building around graphs from the incident, you can add text cells to explain and contextualize an incident, its cause, and what was done to remedy the situation. Because Notebooks support Markdown, you can easily organize your postmortem using headers, or add formatting like lists and code snippets.
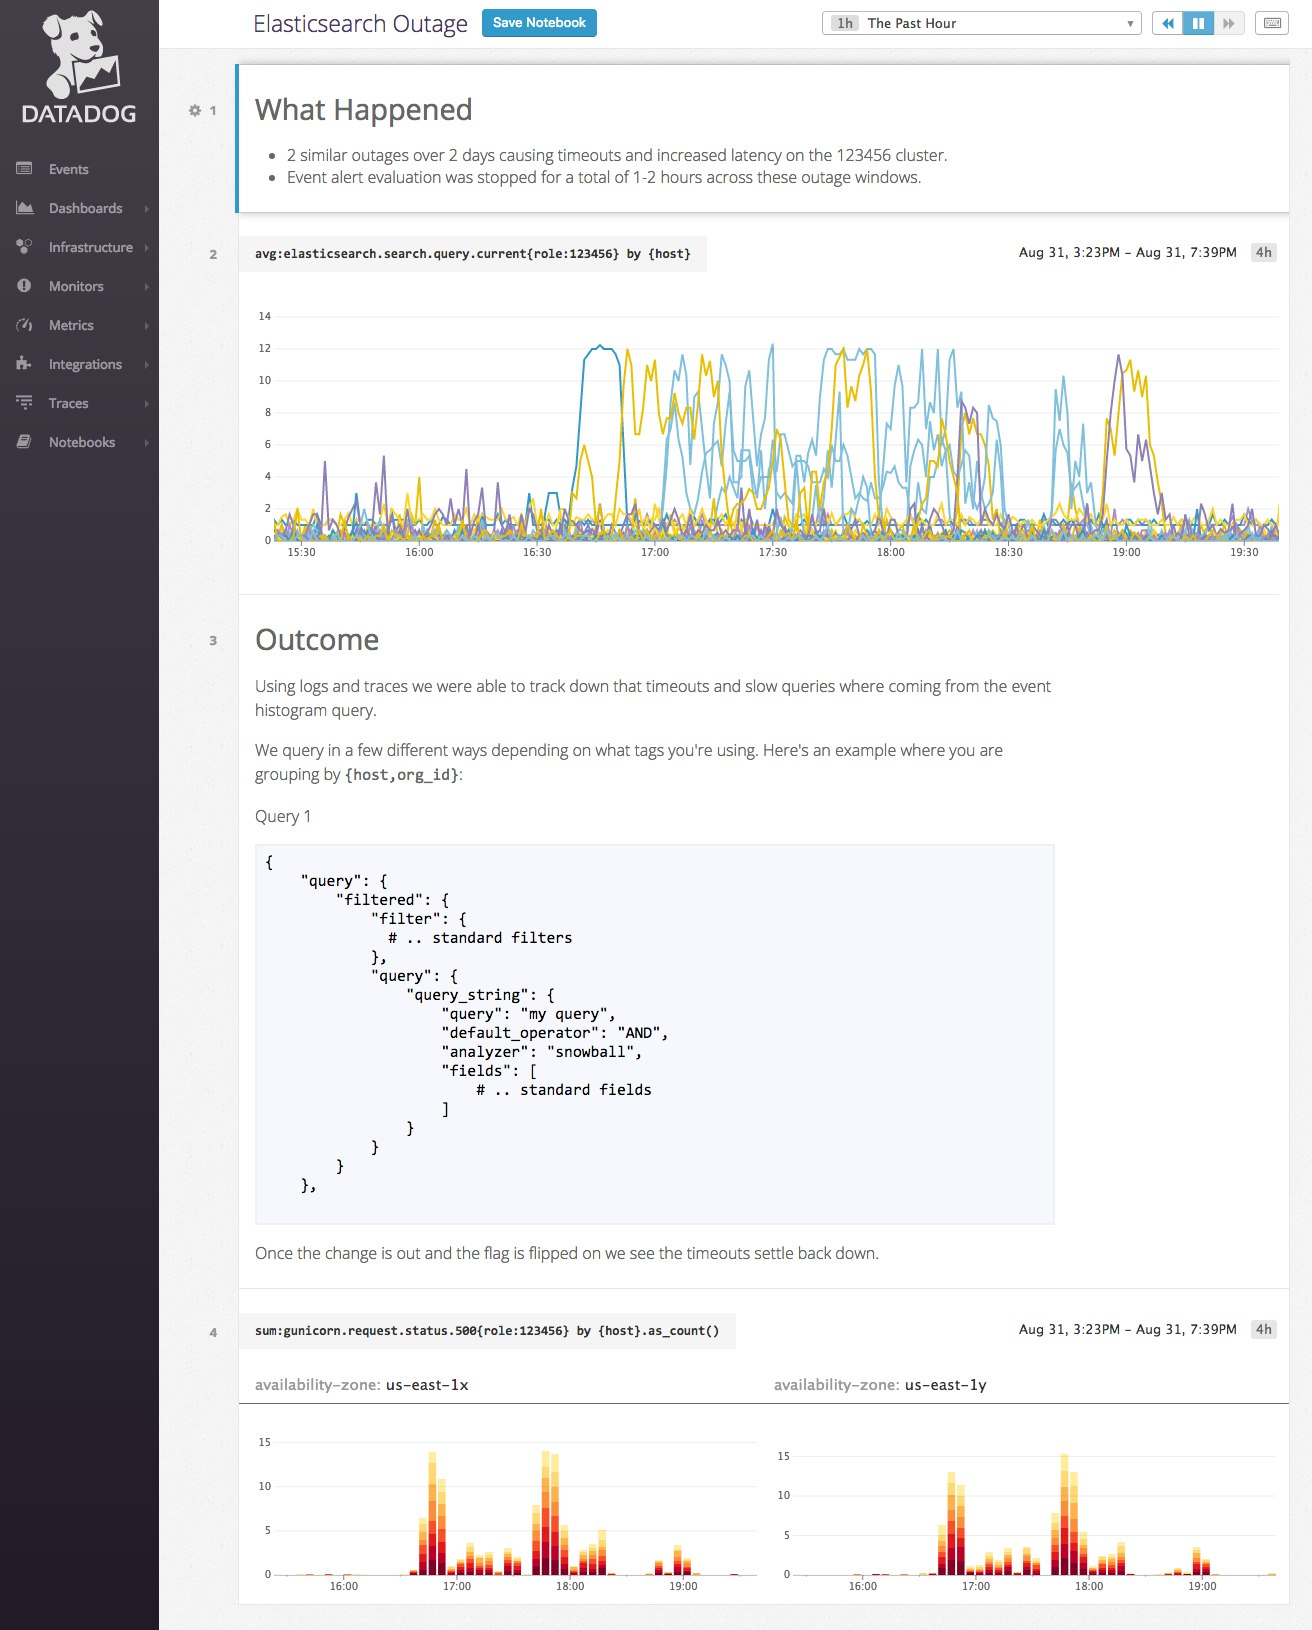
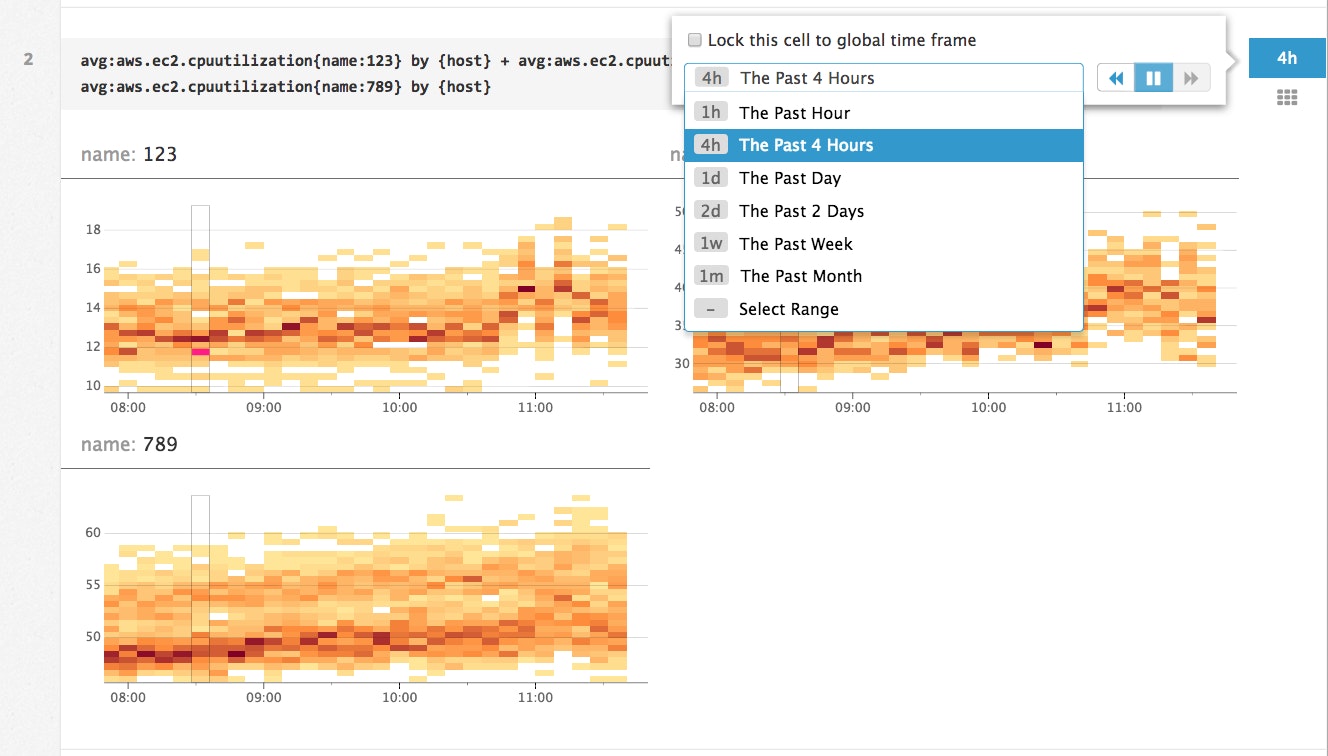
Every graph in a notebook can be set to an adjustable “Global Time” or locked to its own specific timeframe. So you can show graphs that depict system behavior at the time of the incident as well as metrics leading up to the event. Pinpointing system behavior leading up to the incident provides the information you need to create alerts that can help you get ahead of the issue next time.
Dynamic runbooks
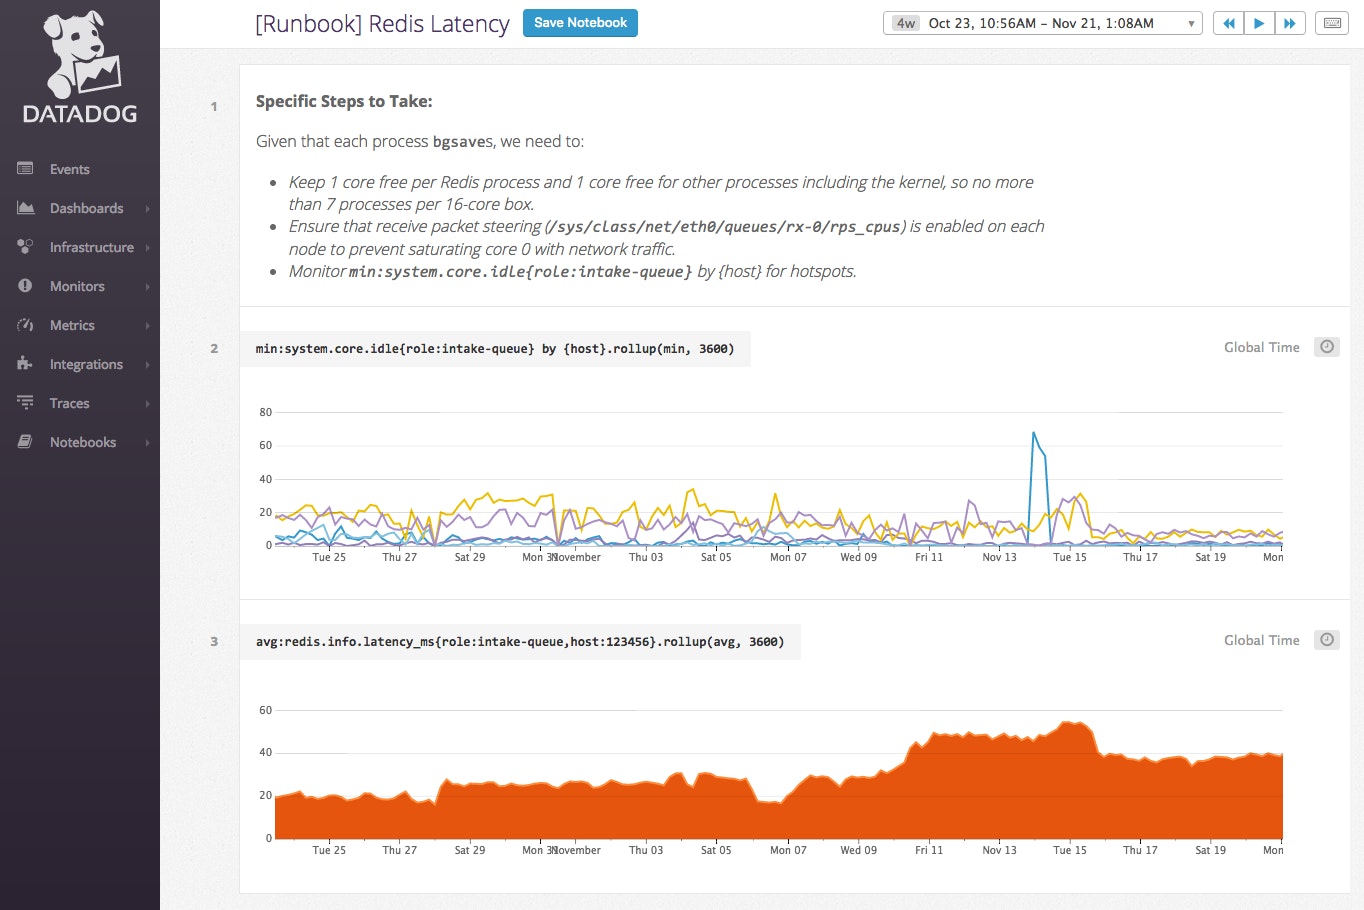
Runbooks help members of your team respond to issues by providing them with detailed instructions and historical context. For runbooks to be helpful, team members need them to be accessible and up to date. Because Notebooks are accessible to anyone in your Datadog organization, they make it easy to distribute and collaboratively update runbooks.
When an alert is triggered, having a runbook can make all the difference in response time. By providing a link to the relevant runbook in your Datadog alerts, you can ensure that whoever is on-call receives step-by-step instructions for dealing with known issues.
Open-ended exploration
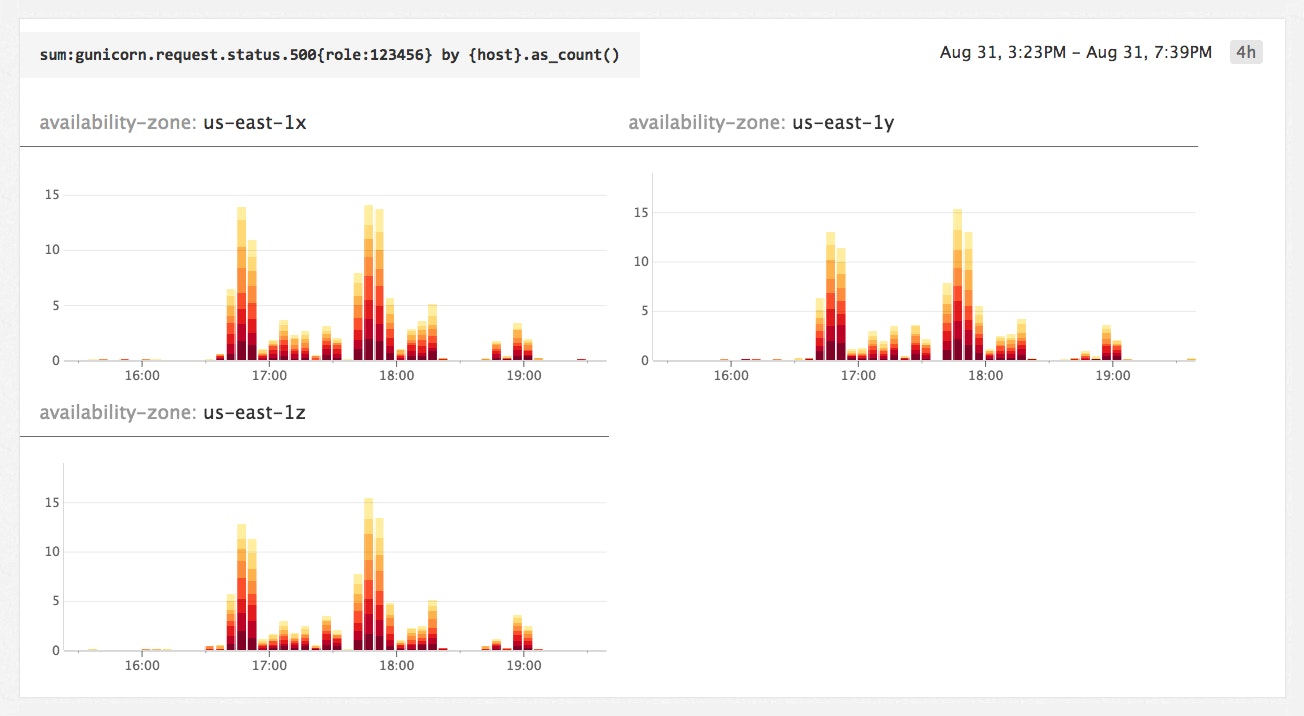
With Notebooks, you can quickly explore any of your infrastructure or application metrics. Metrics can be visualized as timeseries, heatmaps, or distributions. You can also compare metric performance across groups—for instance, you can break out a graph of a globally aggregated metric into individual graphs for each availability zone.
New Notebooks are unsaved by default, so you can visualize your metrics without worrying about modifying your existing dashboards or cluttering up your list of production dashboards with one-off scratch pads. If you discover something worth saving or sharing, however, you can save your work with the “Save Notebook” button.
Go forth and explore!
Rich, clear, easily accessible internal documentation provides much-needed context to engineering teams. The new Notebooks feature in Datadog makes it easy to create and maintain postmortems and runbooks, while also allowing you to explore your metrics freely.
If you’re already a Datadog customer, you can access Notebooks by clicking on the “Notebooks” button in your sidebar. Otherwise, you can sign up for a free 14-day trial and introduce data-driven storytelling to your organization today.
