Colten Woo

Racheal Ou
Custom metrics enable you to track what matters to your distinct business and services and correlate it with the rest of your telemetry data. As your organization grows by adding more teams, services, and environments, your volume of custom metrics can grow with it. To ensure critical visibility while maintaining cost efficiency, organizations need an end-to-end approach to custom metrics governance.
Since releasing Metrics without Limits™, Datadog has continued to expand its custom metrics governance capabilities to help you cost-effectively monitor all of your metrics. With a comprehensive approach that spans visibility and attribution, actionable governance, and monitoring and prevention, Datadog helps you stay in control of custom metrics usage without sacrificing the visibility you rely on.
In this post, we’ll show how Datadog helps you govern your custom metrics end to end by enabling you to:
- Proactively monitor custom metrics usage by using built-in alerts
- Investigate and attribute cost drivers with the Metrics Volume Management page
- Configure indexing to reduce usage with Metrics without Limits
- Safeguard observability with RBAC and audit trails
Proactively monitor usage with built-in alerts
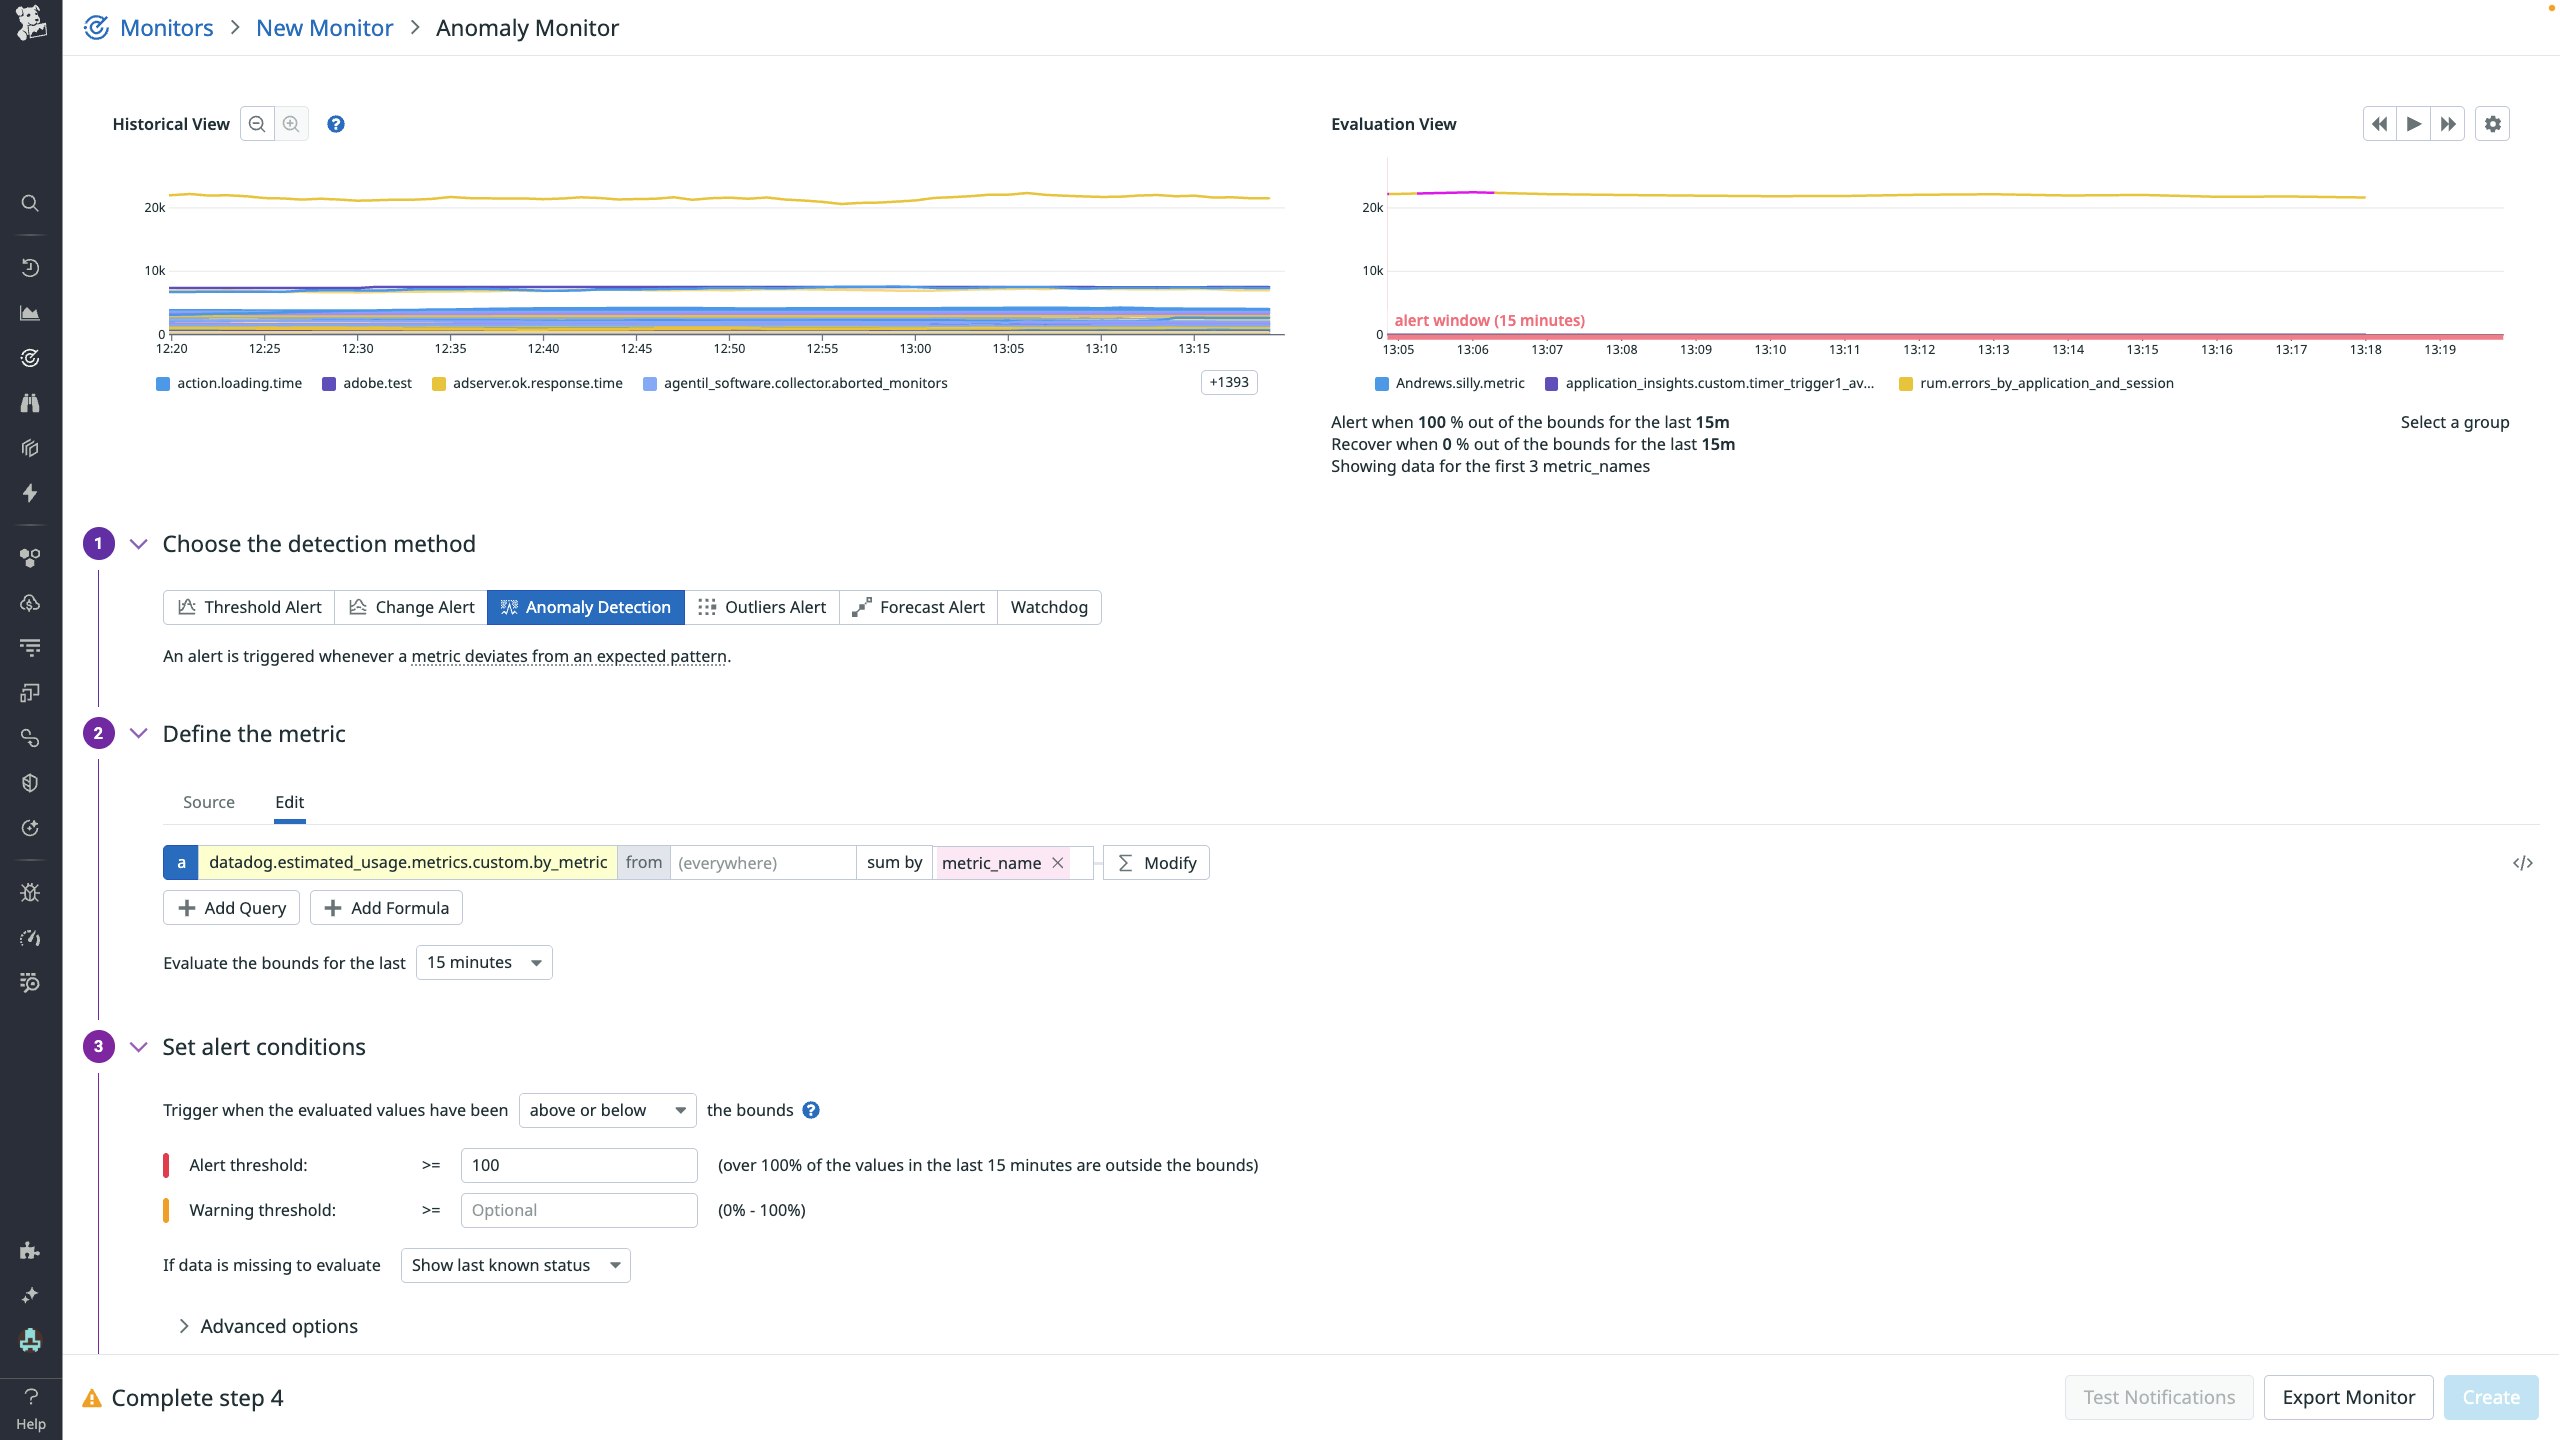
Datadog provides built-in usage metrics to help you monitor custom metrics volumes in real time. You can visualize these metrics in dashboards and configure alerts to detect unexpected increases. The usage metrics include:
datadog.estimated_usage.metrics.custom: Overall custom metrics usagedatadog.estimated_usage.metrics.custom.by_metric: Usage broken down by metric namedatadog.estimated_usage.metrics.custom.by_tag: Usage broken down by tag
To detect overages or sudden spikes, you can create monitors by using a range of detection methods:
- Threshold monitors notify you when usage exceeds a set limit
- Change monitors send alerts when volume changes beyond a certain percentage
- Forecast monitors project future usage and alert you if you’re expected to surpass a defined threshold
- Anomaly monitors surface unusual spikes in volume that might indicate unintended usage patterns
These monitors help you respond to usage increases before they impact your budget.
Identify and attribute your largest cost drivers
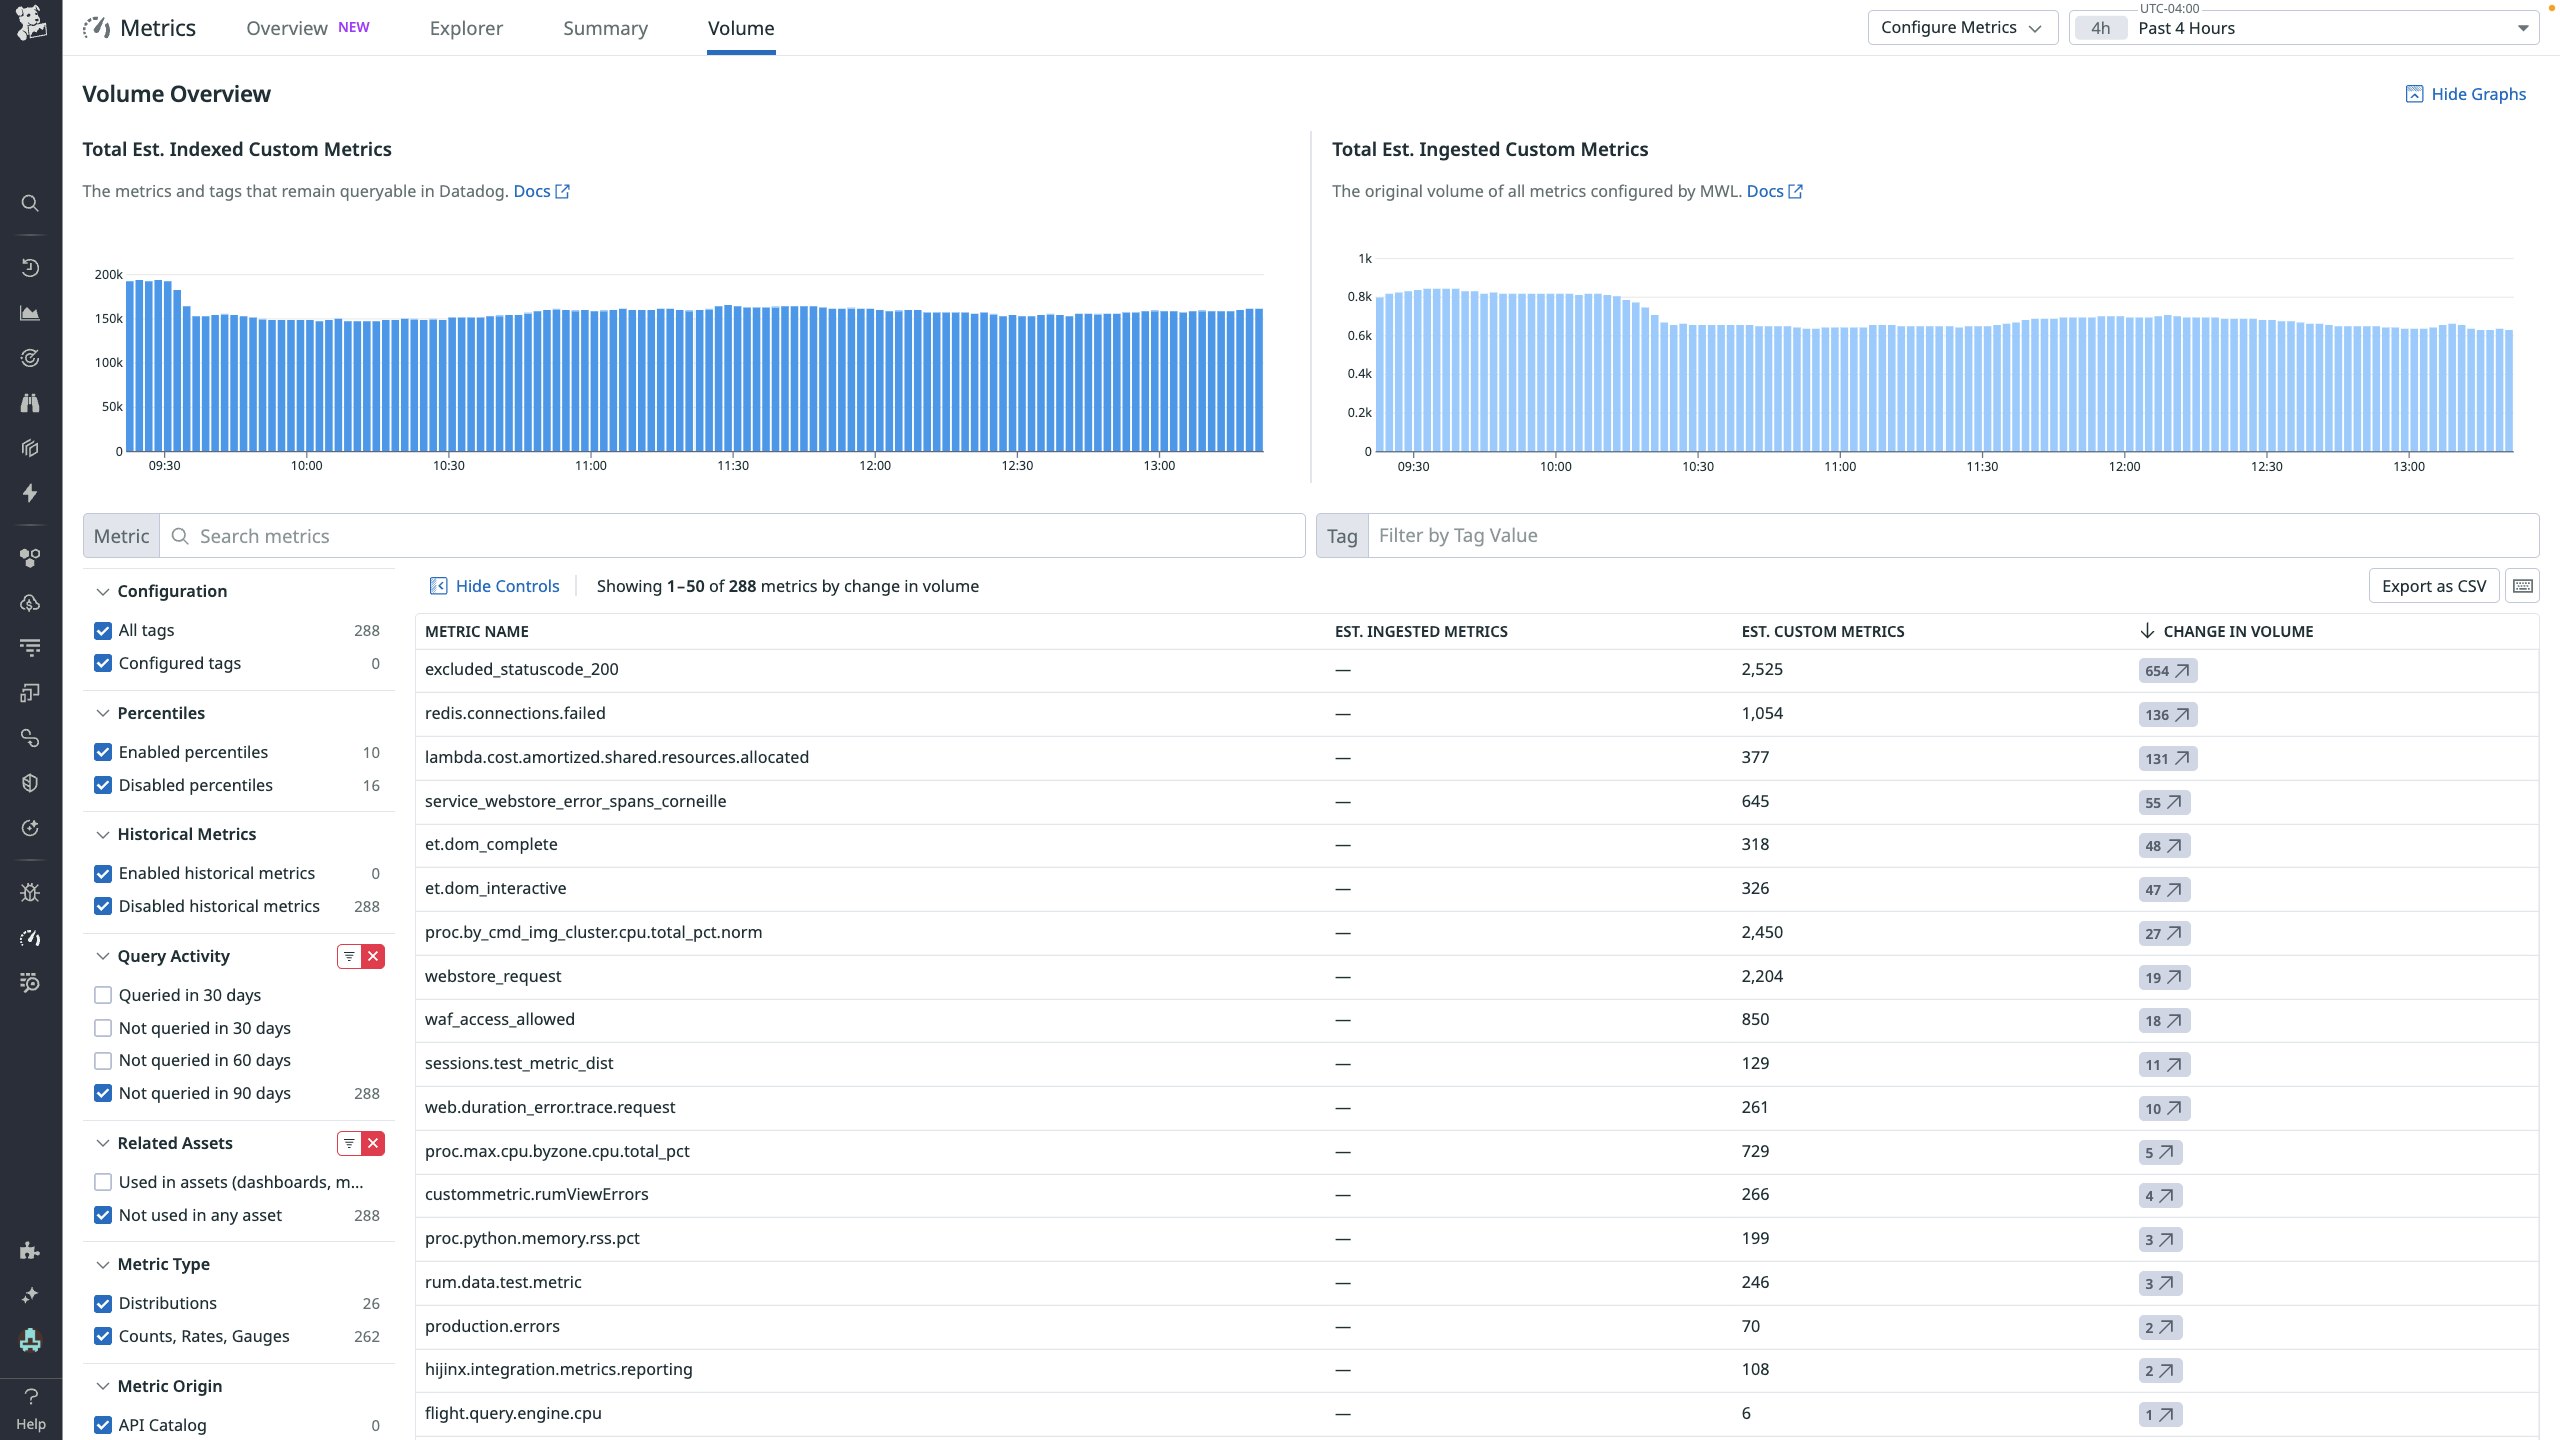
When an alert fires, the Metrics Volume Management page helps you prioritize and dig deeper by providing a ranked list of your top 500 custom metrics by indexed volume. You can sort the list by overall volume or change in volume to surface the most significant contributors. For a more comprehensive approach, you can use the Summary Page, which includes all of your metrics.
To focus on the metrics attributed to your team, you can use filters to narrow results by tag values such as team, application, or service. This enables you to home in on metrics relevant to your domain while avoiding unintended changes to shared telemetry data. Having this level of visibility can help keep teams accountable and empower them to understand and optimize their usage.
Two faceted views provide additional insight:
- Query Activity identifies metrics that haven’t been queried by any user, dashboard, or API call. These metrics are all prime candidates for reconfiguration.
- Related Assets shows whether a metric is used in any dashboards, notebooks, monitors, or service-level objectives (SLOs). This helps you avoid removing metrics that are still providing value. By clicking into a metric, you can see which assets it’s used in (if any) and evaluate its utility within your organization based on the popularity and quantity of these assets.
Reduce costs with Metrics without Limits
Once you’ve identified metrics to adjust, Datadog’s Metrics without Limits helps you reduce indexing without removing ingestion. Metrics without Limits—a first in cost management features among monitoring platforms—separates ingestion from indexing. This enables you to keep collecting metrics but index only the tags needed for analysis and troubleshooting, all without having to make any Agent or code-level changes. Customers that apply Metrics without Limits to unqueried metrics often see up to a 70 percent reduction in custom metrics usage without losing critical visibility.
You can configure a single metric, or configure metric namespaces in bulk by using an allowlist or blocklist in Datadog or via the API. For allowlists, Datadog’s intelligent insights help identify which metrics to focus on by providing a recommended set of tags that have been actively queried on dashboards, notebooks, monitors, or through the API in the past 30 days.
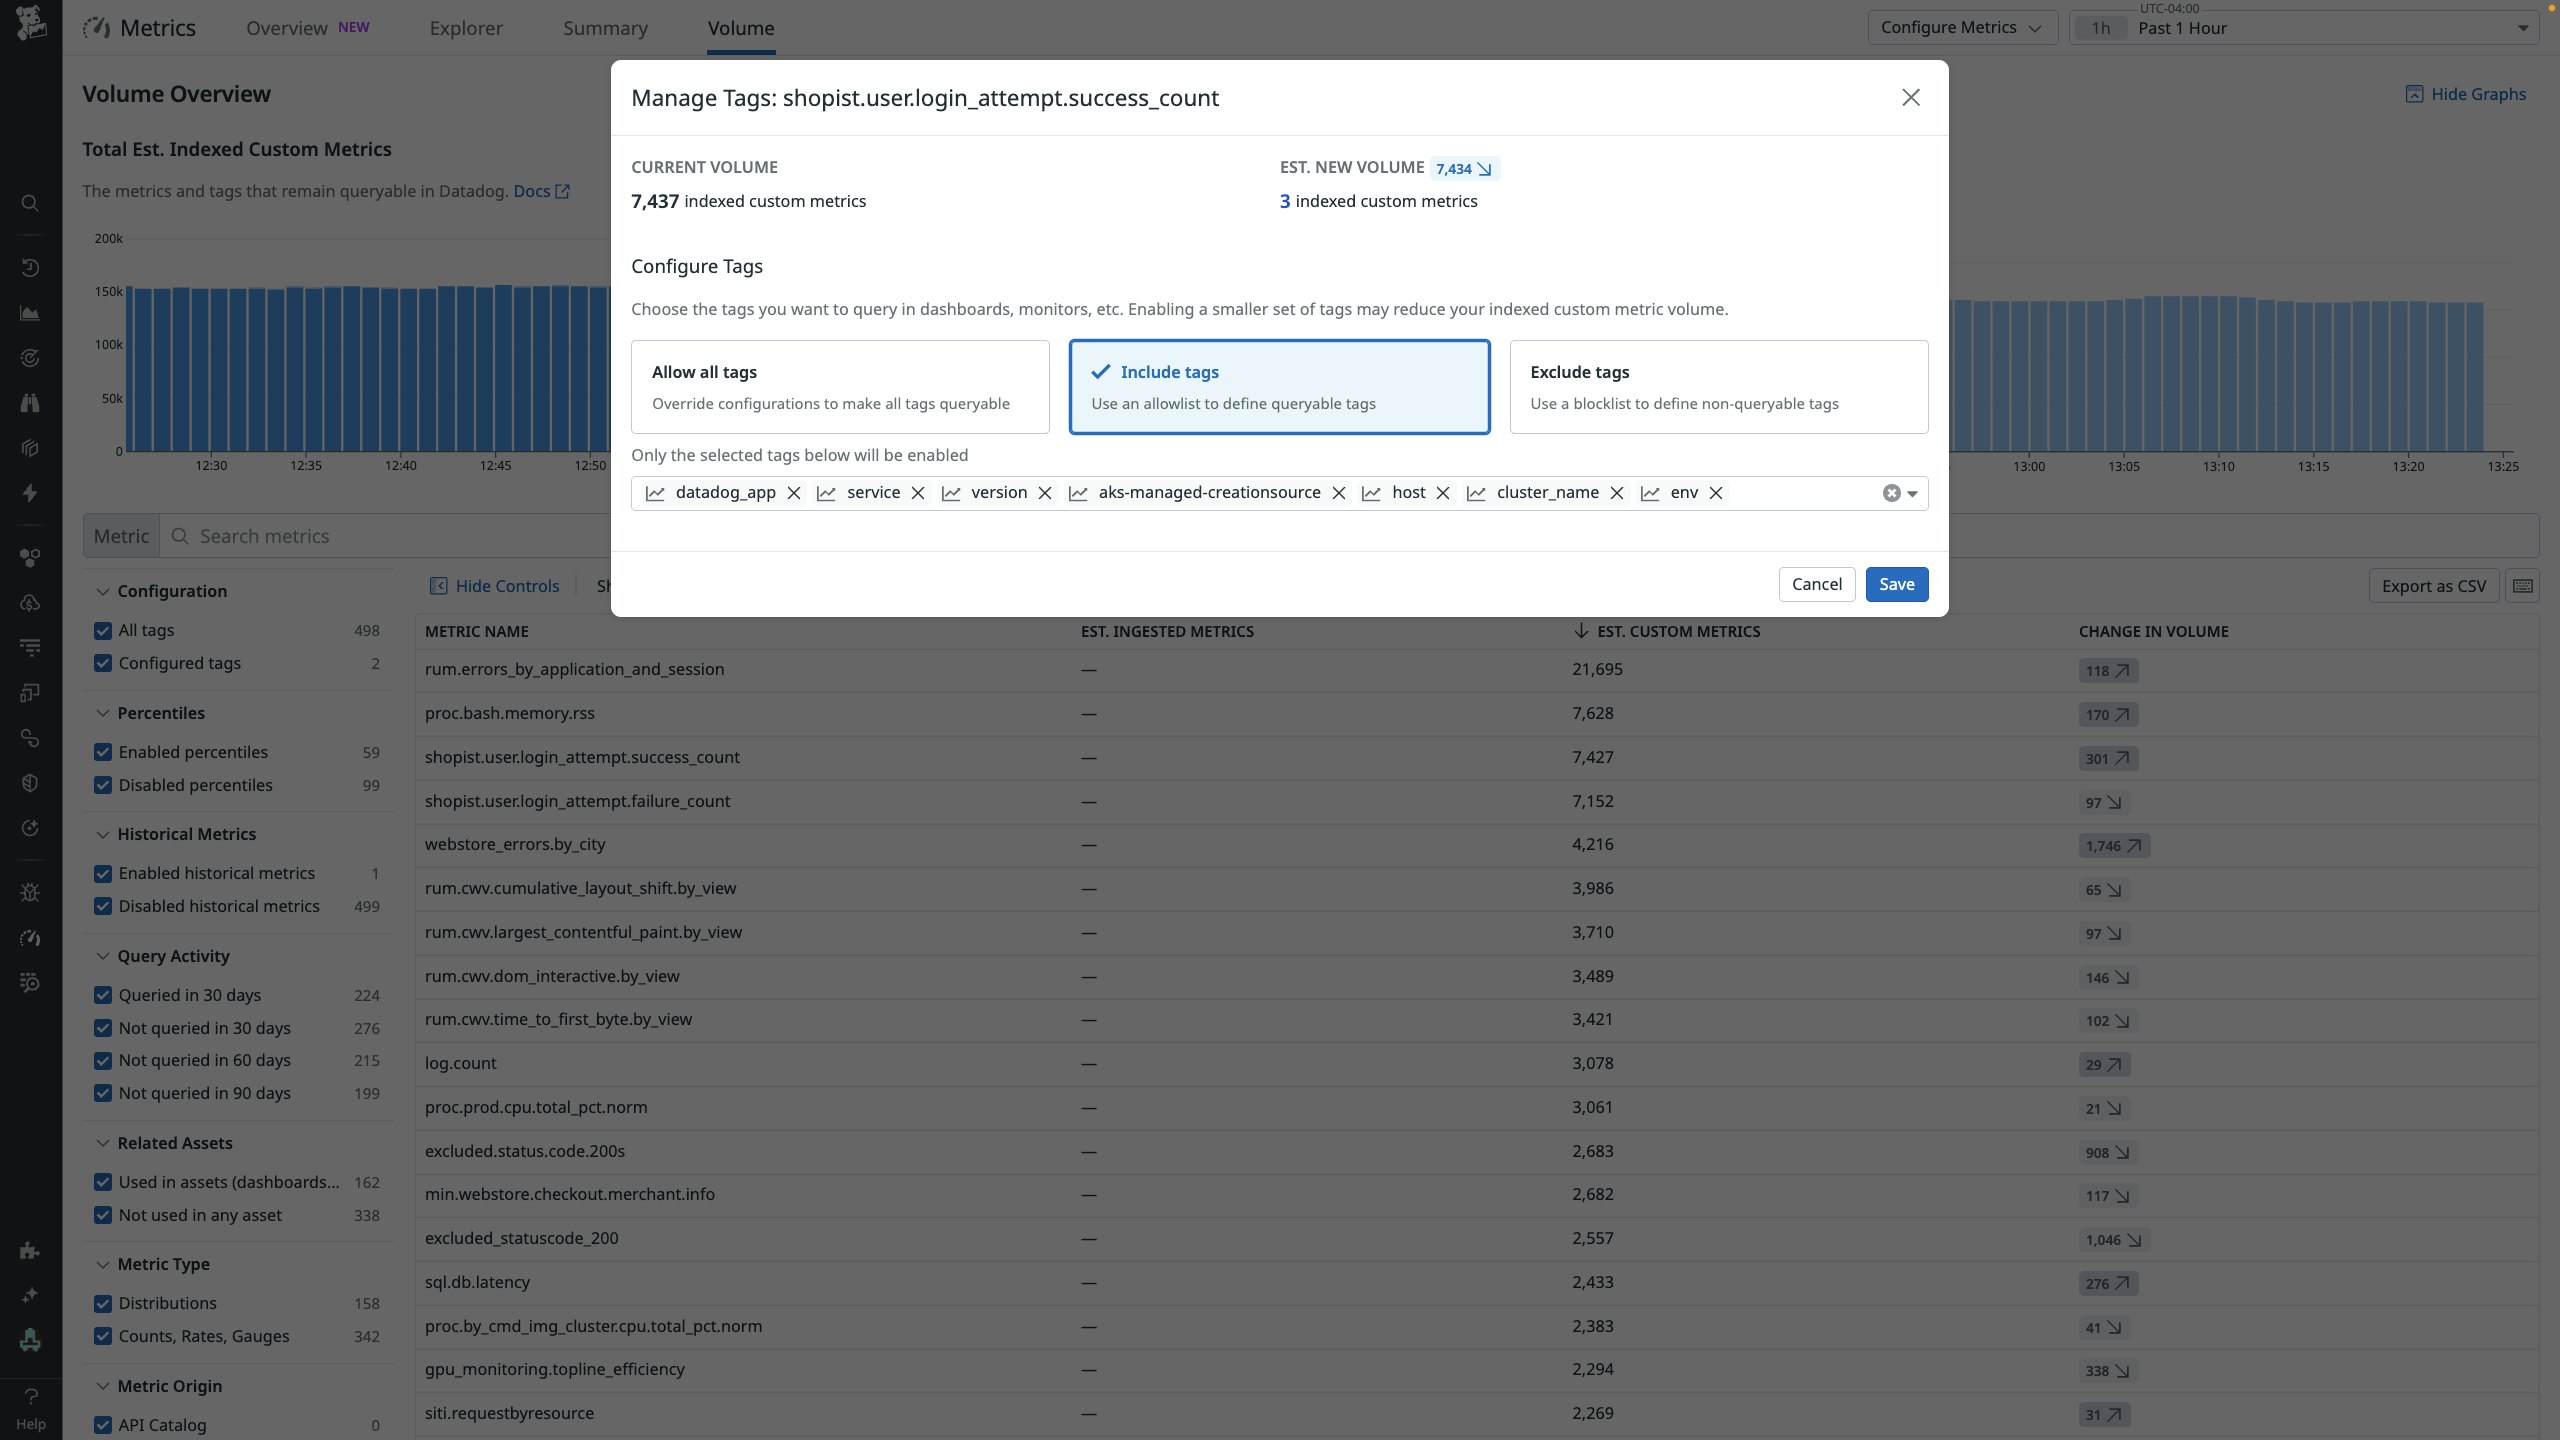
When you want to target specific tags, you can create a blocklist instead. To assist this process, you can use the Metrics Tags Cardinality Explorer to find high-cardinality tags that are driving usage spikes and exclude them to immediately reduce costs.
Safeguard observability with RBAC and audit trails
While Metrics without Limits is a powerful tool for optimizing volumes, it is important to ensure that configuration changes don’t unintentionally impact visibility. To help avoid this, Datadog supports role-based access control (RBAC). By assigning the metrics_tags_write permission only to specific users or roles, you can ensure that only authorized team members are able to modify tag configurations. This helps prevent accidental changes that could lead to visibility gaps or unexpected usage spikes.
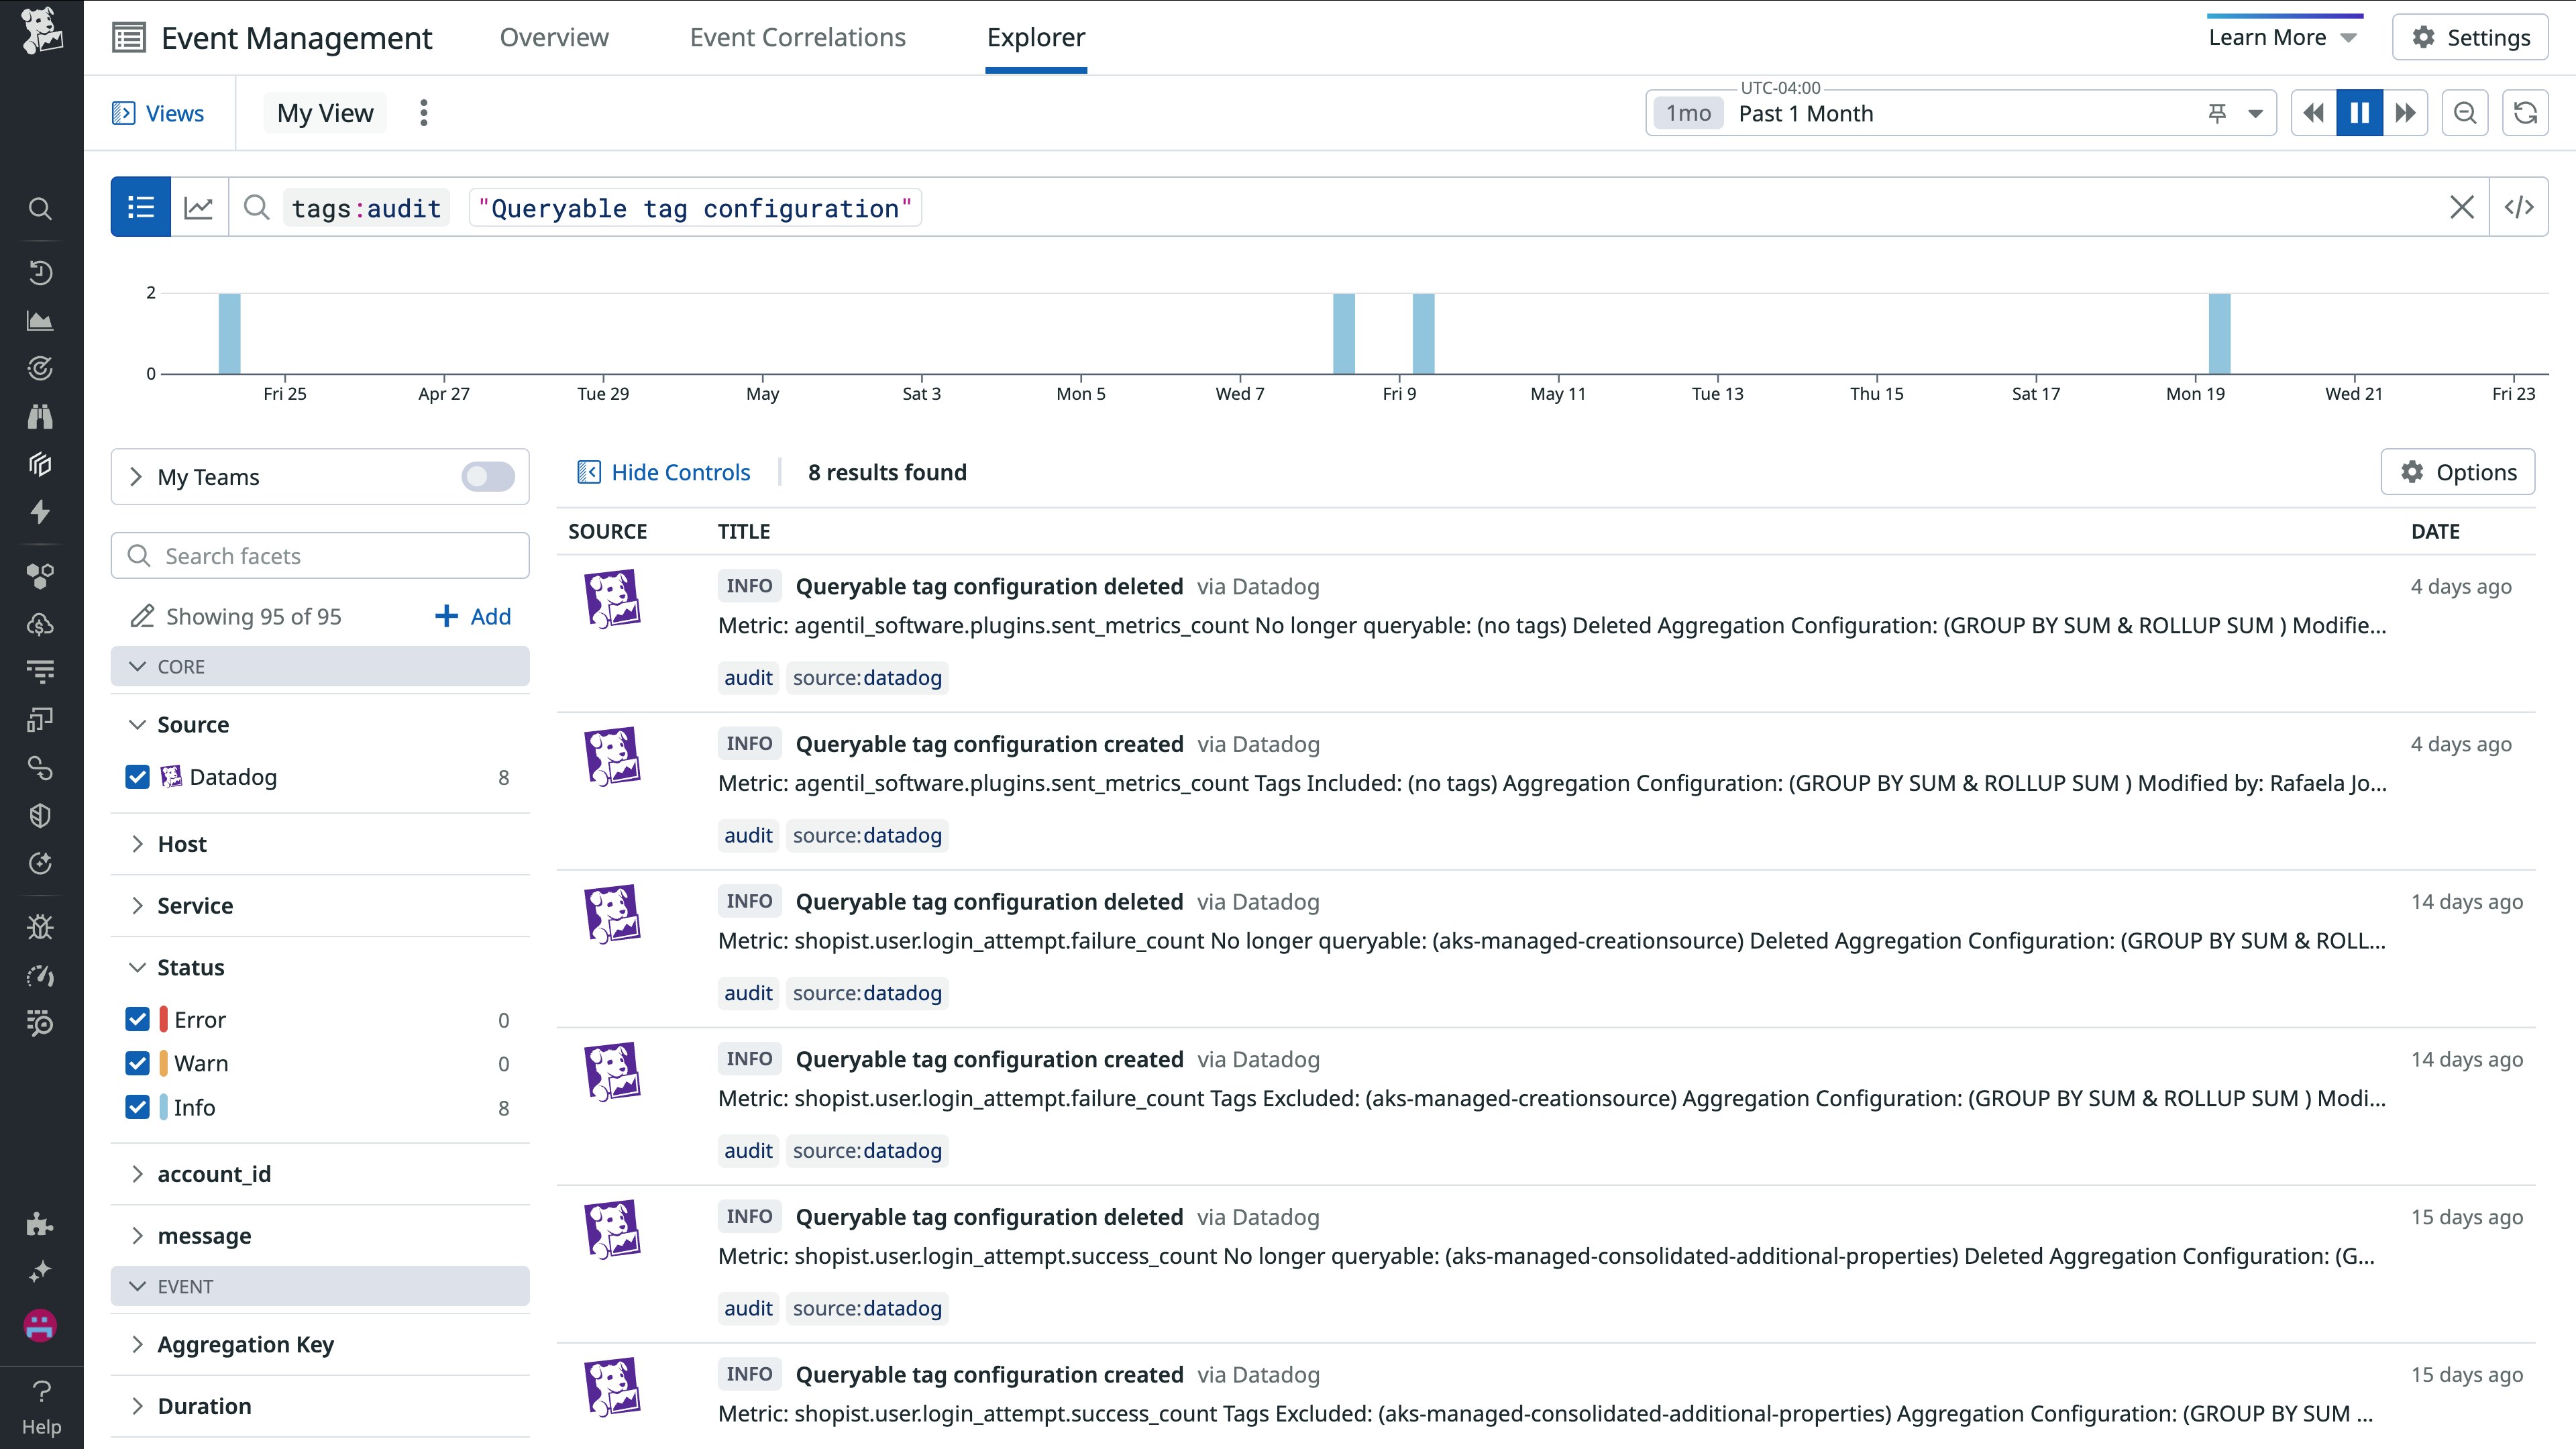
Datadog also automatically records all Metrics without Limits configuration changes, including who made them and which metrics were impacted, giving you full transparency across your team. You can view this in Audit Trail by running a quick query in the Events Explorer.
Start managing your custom metrics volumes today
Datadog’s governance tools give you full control over custom metrics usage, helping you stay on budget while preserving the visibility you need. From real-time usage alerts to granular control with Metrics without Limits, Datadog enables you to confidently scale your observability without incurring unnecessary costs.
To learn more, check out our Best Practices for Custom Metrics Governance guide and interactive walkthrough of our custom metrics governance tools. If you’re new to Datadog, sign up for a 14-day free trial.
