Gaurab Aryal

Mallory Mooney
Code profilers offer detailed insight into the efficiency of application code by measuring things like the execution time and resource utilization of a service. Datadog’s always-on, low overhead Continuous Profiler provides snapshots of code performance for a service that are tagged with key metadata (e.g., region, service, release), so you can easily identify and optimize inefficient code. This enables you to manage compute costs and resolve performance bottlenecks that affect your users’ experience.
Datadog’s profiler allows you to capture code profiles continuously for all of your production instances. Now you can compare those profiles in the profile comparison view to see how the performance and structure of your code change over time. This enables you to answer key questions about code-level performance such as: has a new release improved performance or caused a regression? Is your code more performant in one region, host, or pod versus another? Which functions are consuming the most CPU time for today versus last week?
The profile comparison view also helps you quantify the changes you’ve made to fix a performance bottleneck, such as optimizing a CPU-intensive method, so you can easily calculate the estimated savings on your production infrastructure costs.
Quickly detect code performance regressions in production workloads
As your application grows in size and complexity, the probability of introducing regressions in code performance also increases. Continuous Profiler enables you to view your application’s code performance in production at a glance, whether it be through an instantaneous sixty-second profile or an aggregate view of a service’s performance bottlenecks within a specific timeframe. But there may still be critical performance blind spots that would otherwise go unnoticed without complete visibility into application code.
With the profile comparison view, you can efficiently troubleshoot the root cause behind performance blind spots at a method level, including regressions such as:
- an increase in a service’s heap memory size over the past two days
- spikes in service latency since the last deployment
- regressions in CPU consumption over the past seven days
The profile comparison view automatically highlights changes in production code performance based on a selected profile type (e.g., CPU time, allocations, thread locks, etc.) and a timeframe that you specify. Visibility into these areas of code performance can help you monitor the efficiency of production workloads and detect problematic areas before they become more serious.
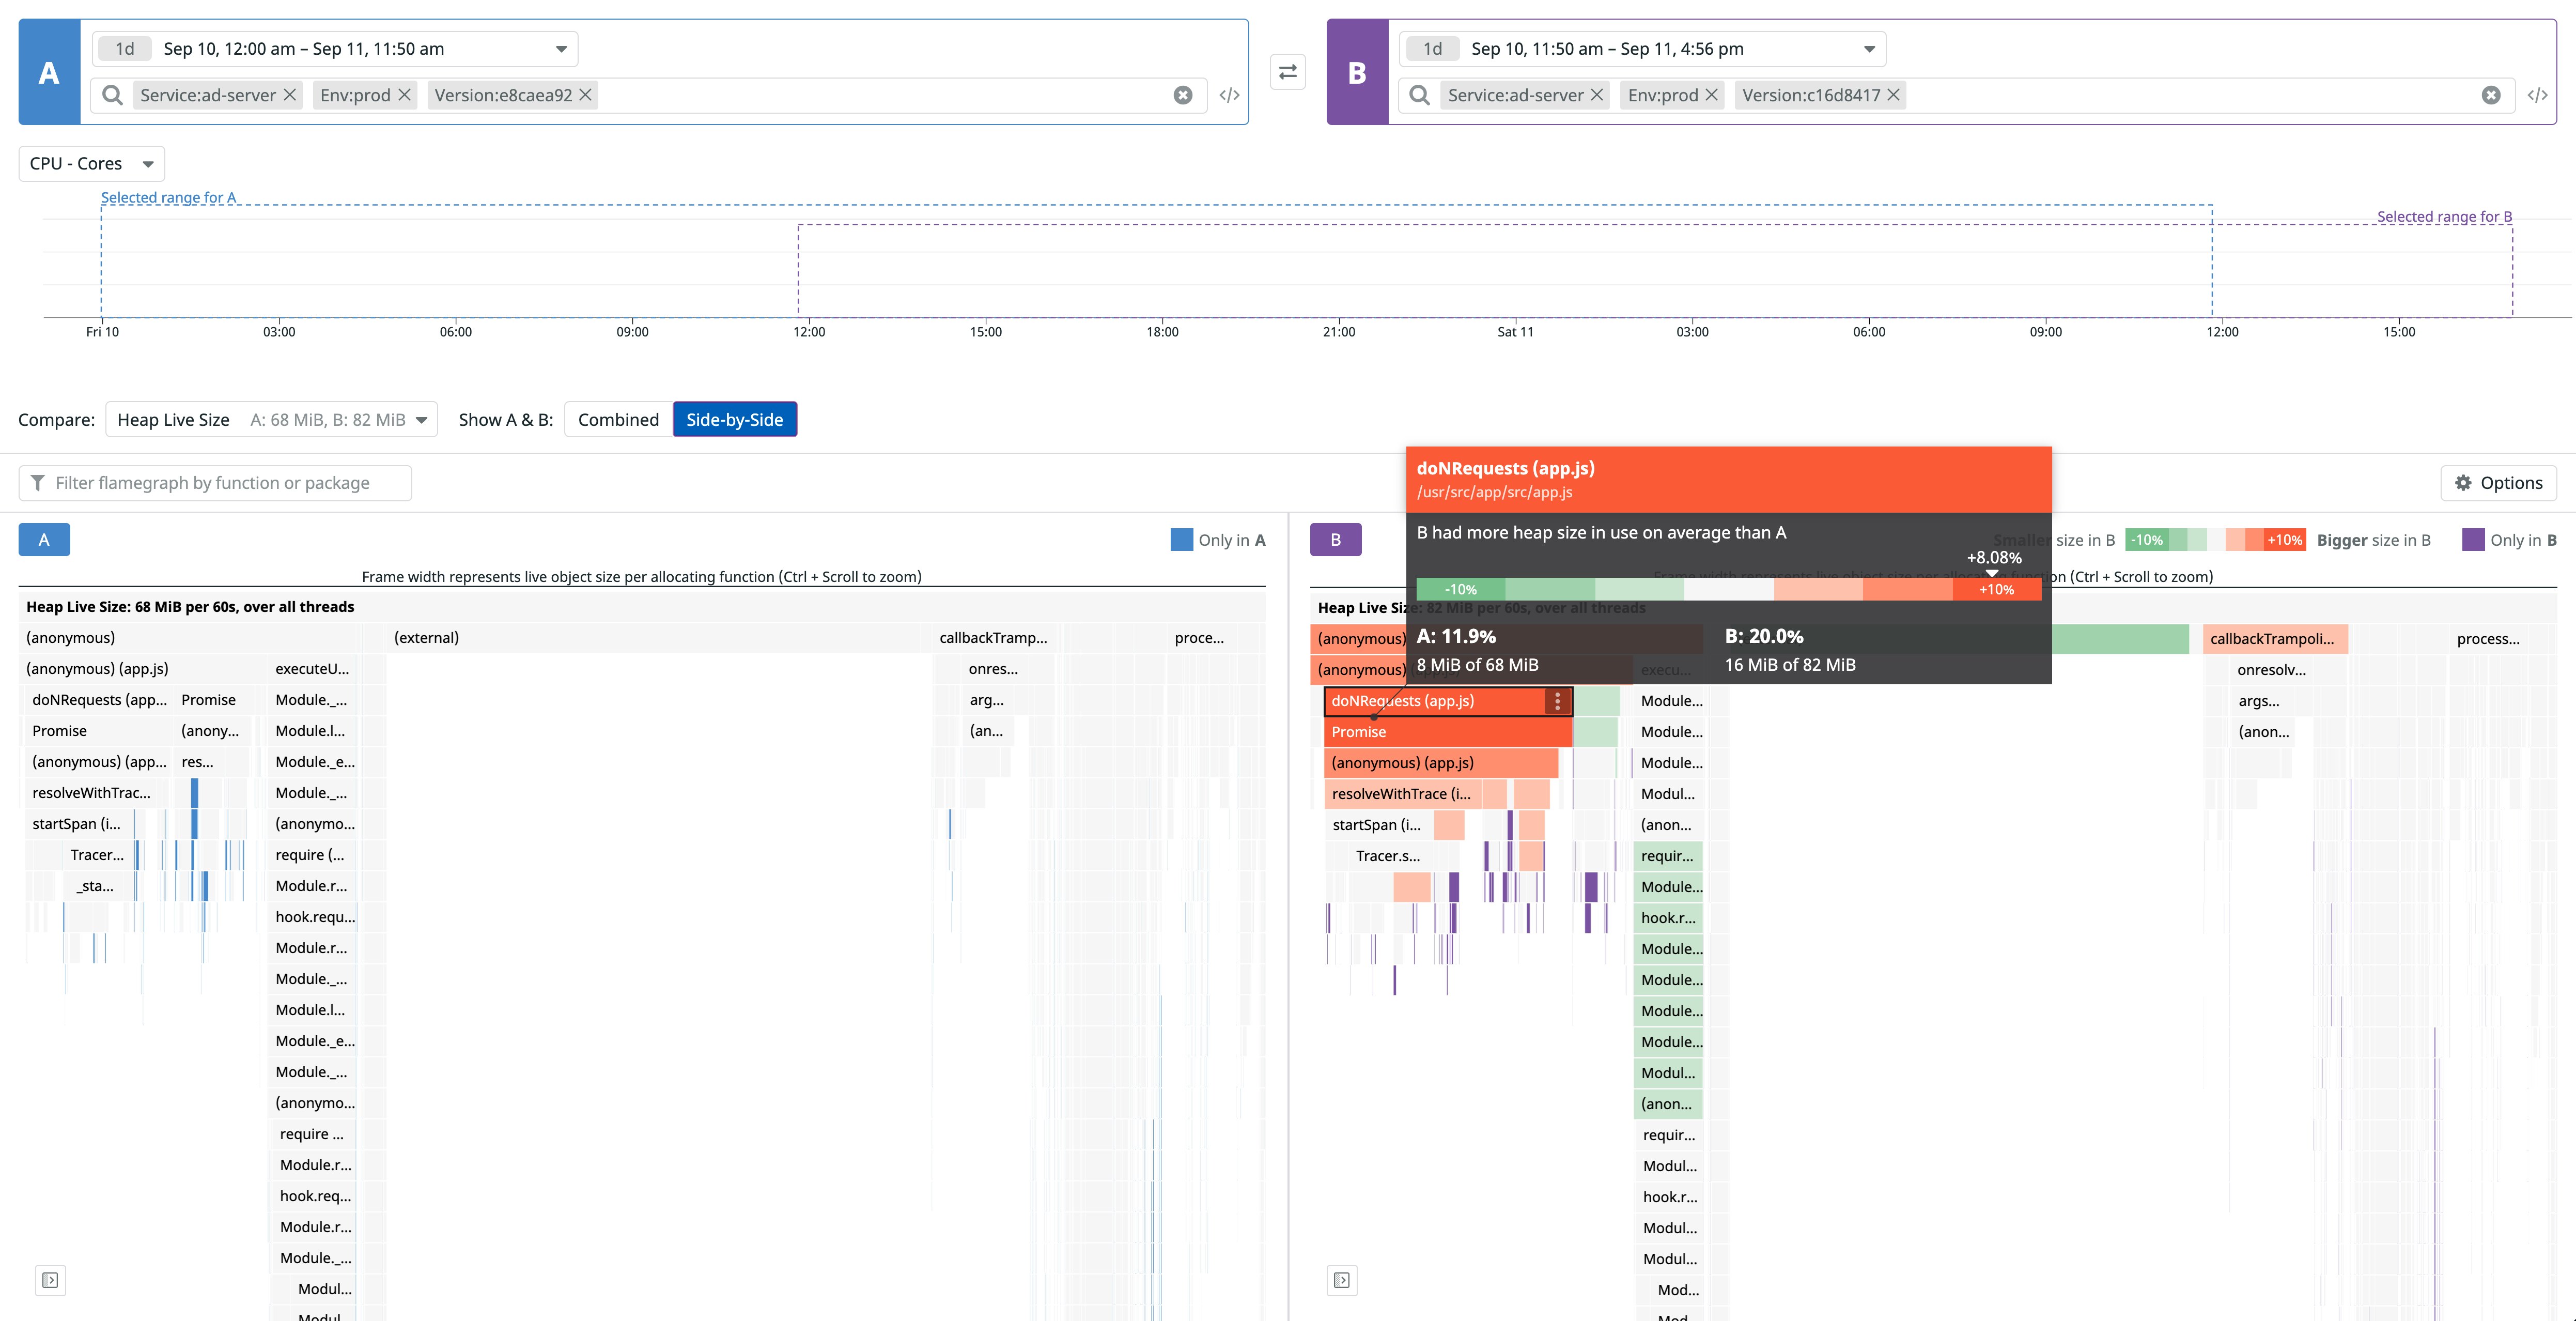
For example, you can compare a service’s live heap memory between two releases to spot potential memory leaks. The screenshot below shows a method that is contributing eight percent more to the heap live size in the newer deployed version (in purple) compared to the previous one (in blue). If the service live heap memory continues to increase over a sustained period of time then it could indicate that there is a memory leak within the service. Methods highlighted in bright red, such as the doNRequests method seen below, indicate areas where you can start your investigation.
Identify the cause of increased latency in service endpoints
Profile comparison can also help you identify the root cause of increased latency for a service endpoint, which can affect your end users’ experience and be costly if not resolved quickly. But this type of bottleneck is often difficult to detect—it could be the result of issues that resolve on their own (e.g., network latency, noisy neighbor processes) or legitimate performance regressions in your code. With the profile comparison view, you can easily confirm if the latency spike was caused by inefficient code.
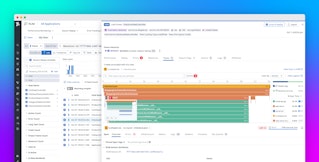
For example, you can compare the elapsed time a service with stable workloads spent executing a method (i.e., wall time) to the previous week’s performance. The screenshot belows shows that the wall time for several methods in a profiled Ruby service increased significantly over several days (highlighted in red).
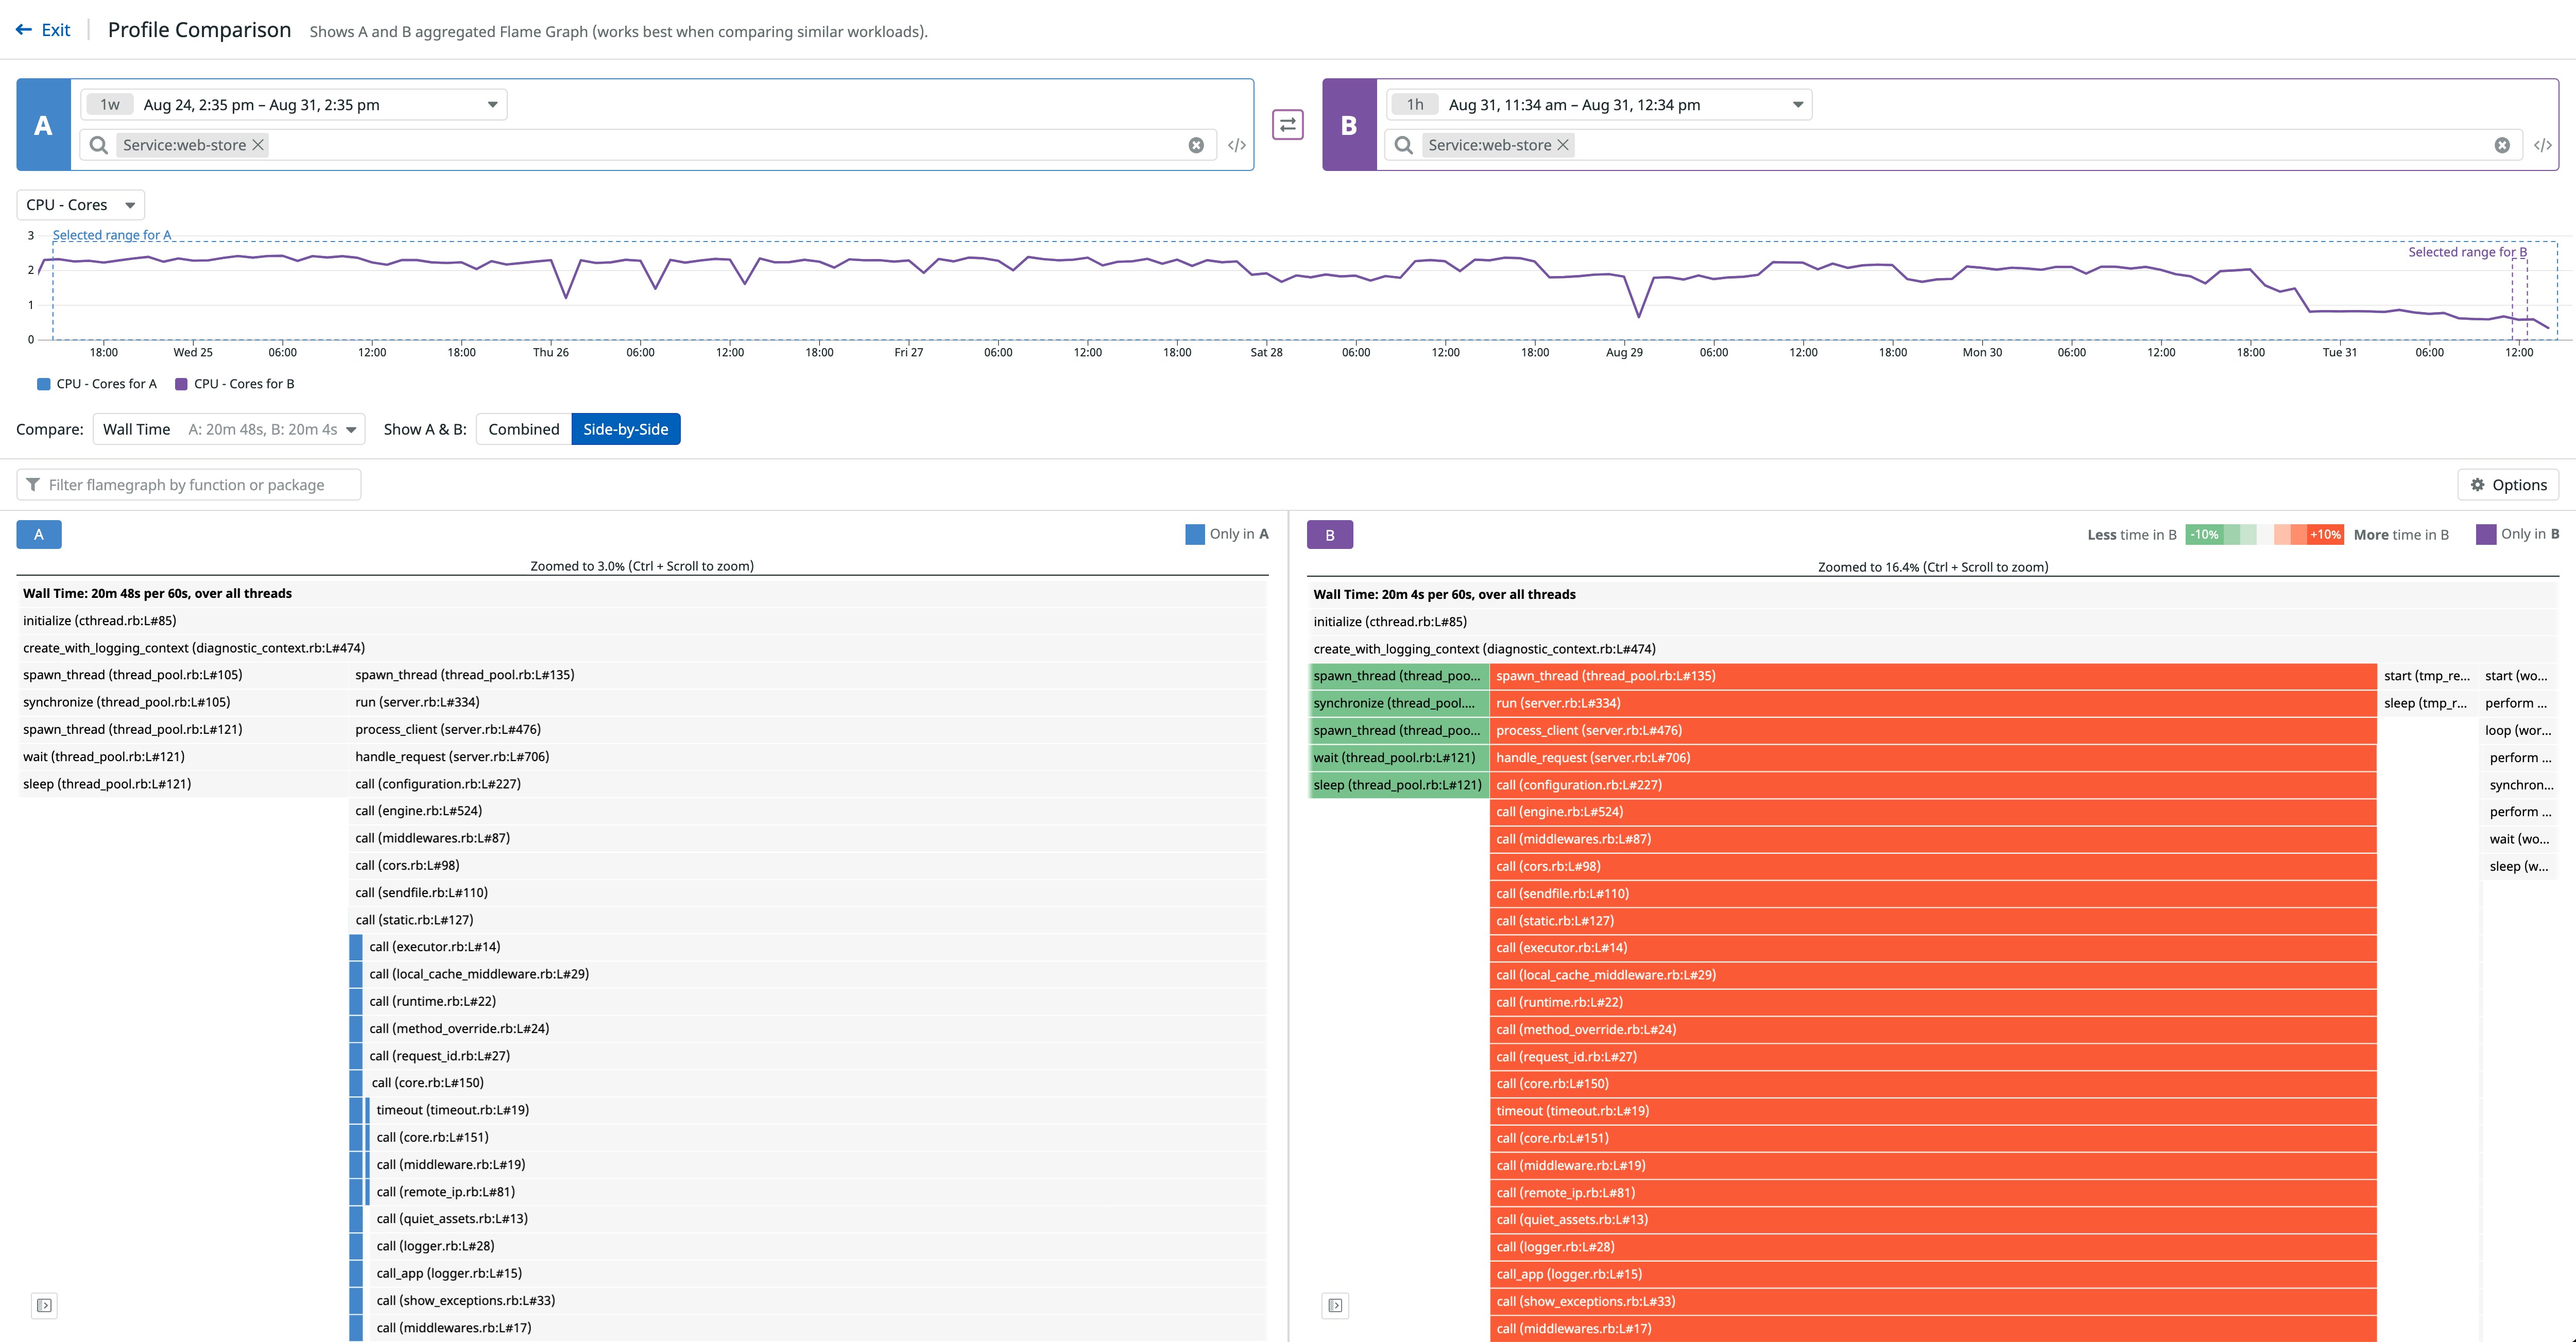
You can filter your view to show the appropriate service controller, enabling you to identify all of the downstream methods that created the spike in latency for the endpoint. Profile comparison identifies the exact methods that need further inspection, down to the line of code associated with the change in performance, so you can troubleshoot further and deploy a fix if needed.
Compare code performance between releases
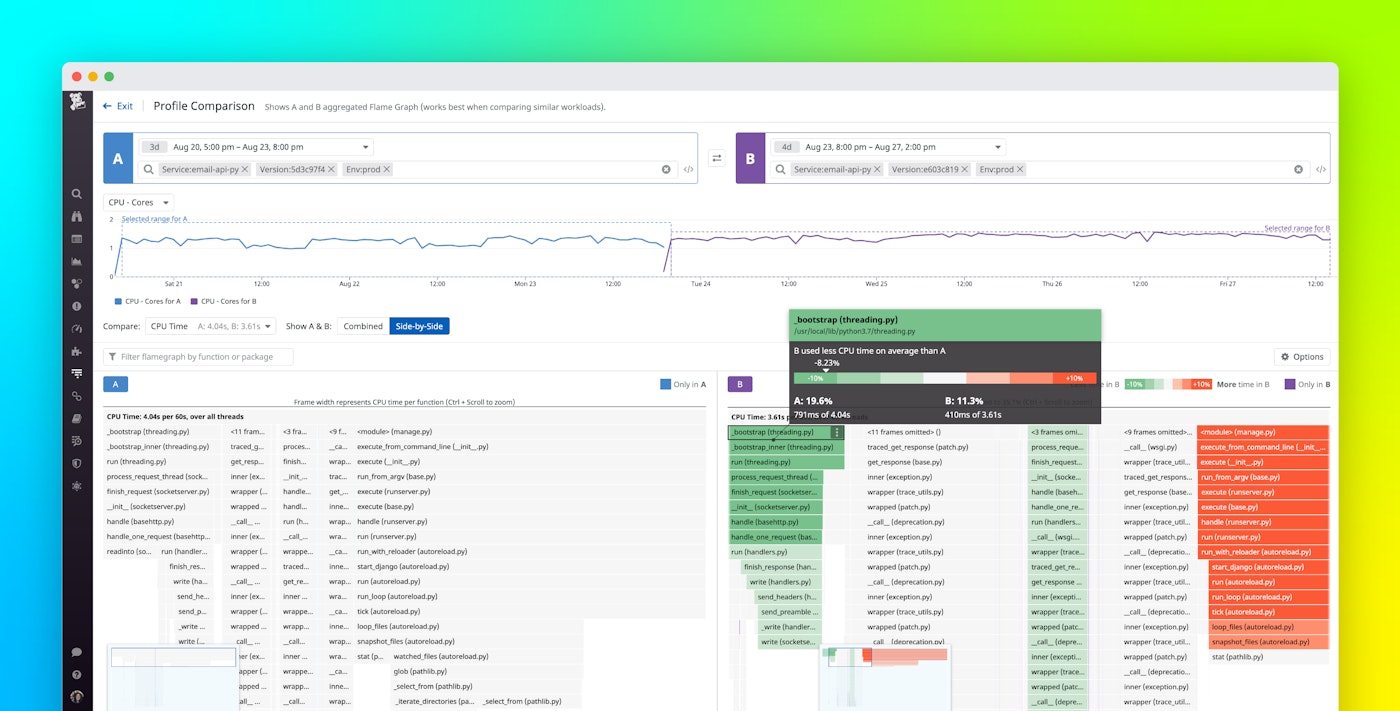
Profile comparison is tightly integrated with deployment tracking, so you can track code performance for a particular service after a new release by pivoting from a high-level view of a deployment to a more granular view of application code.
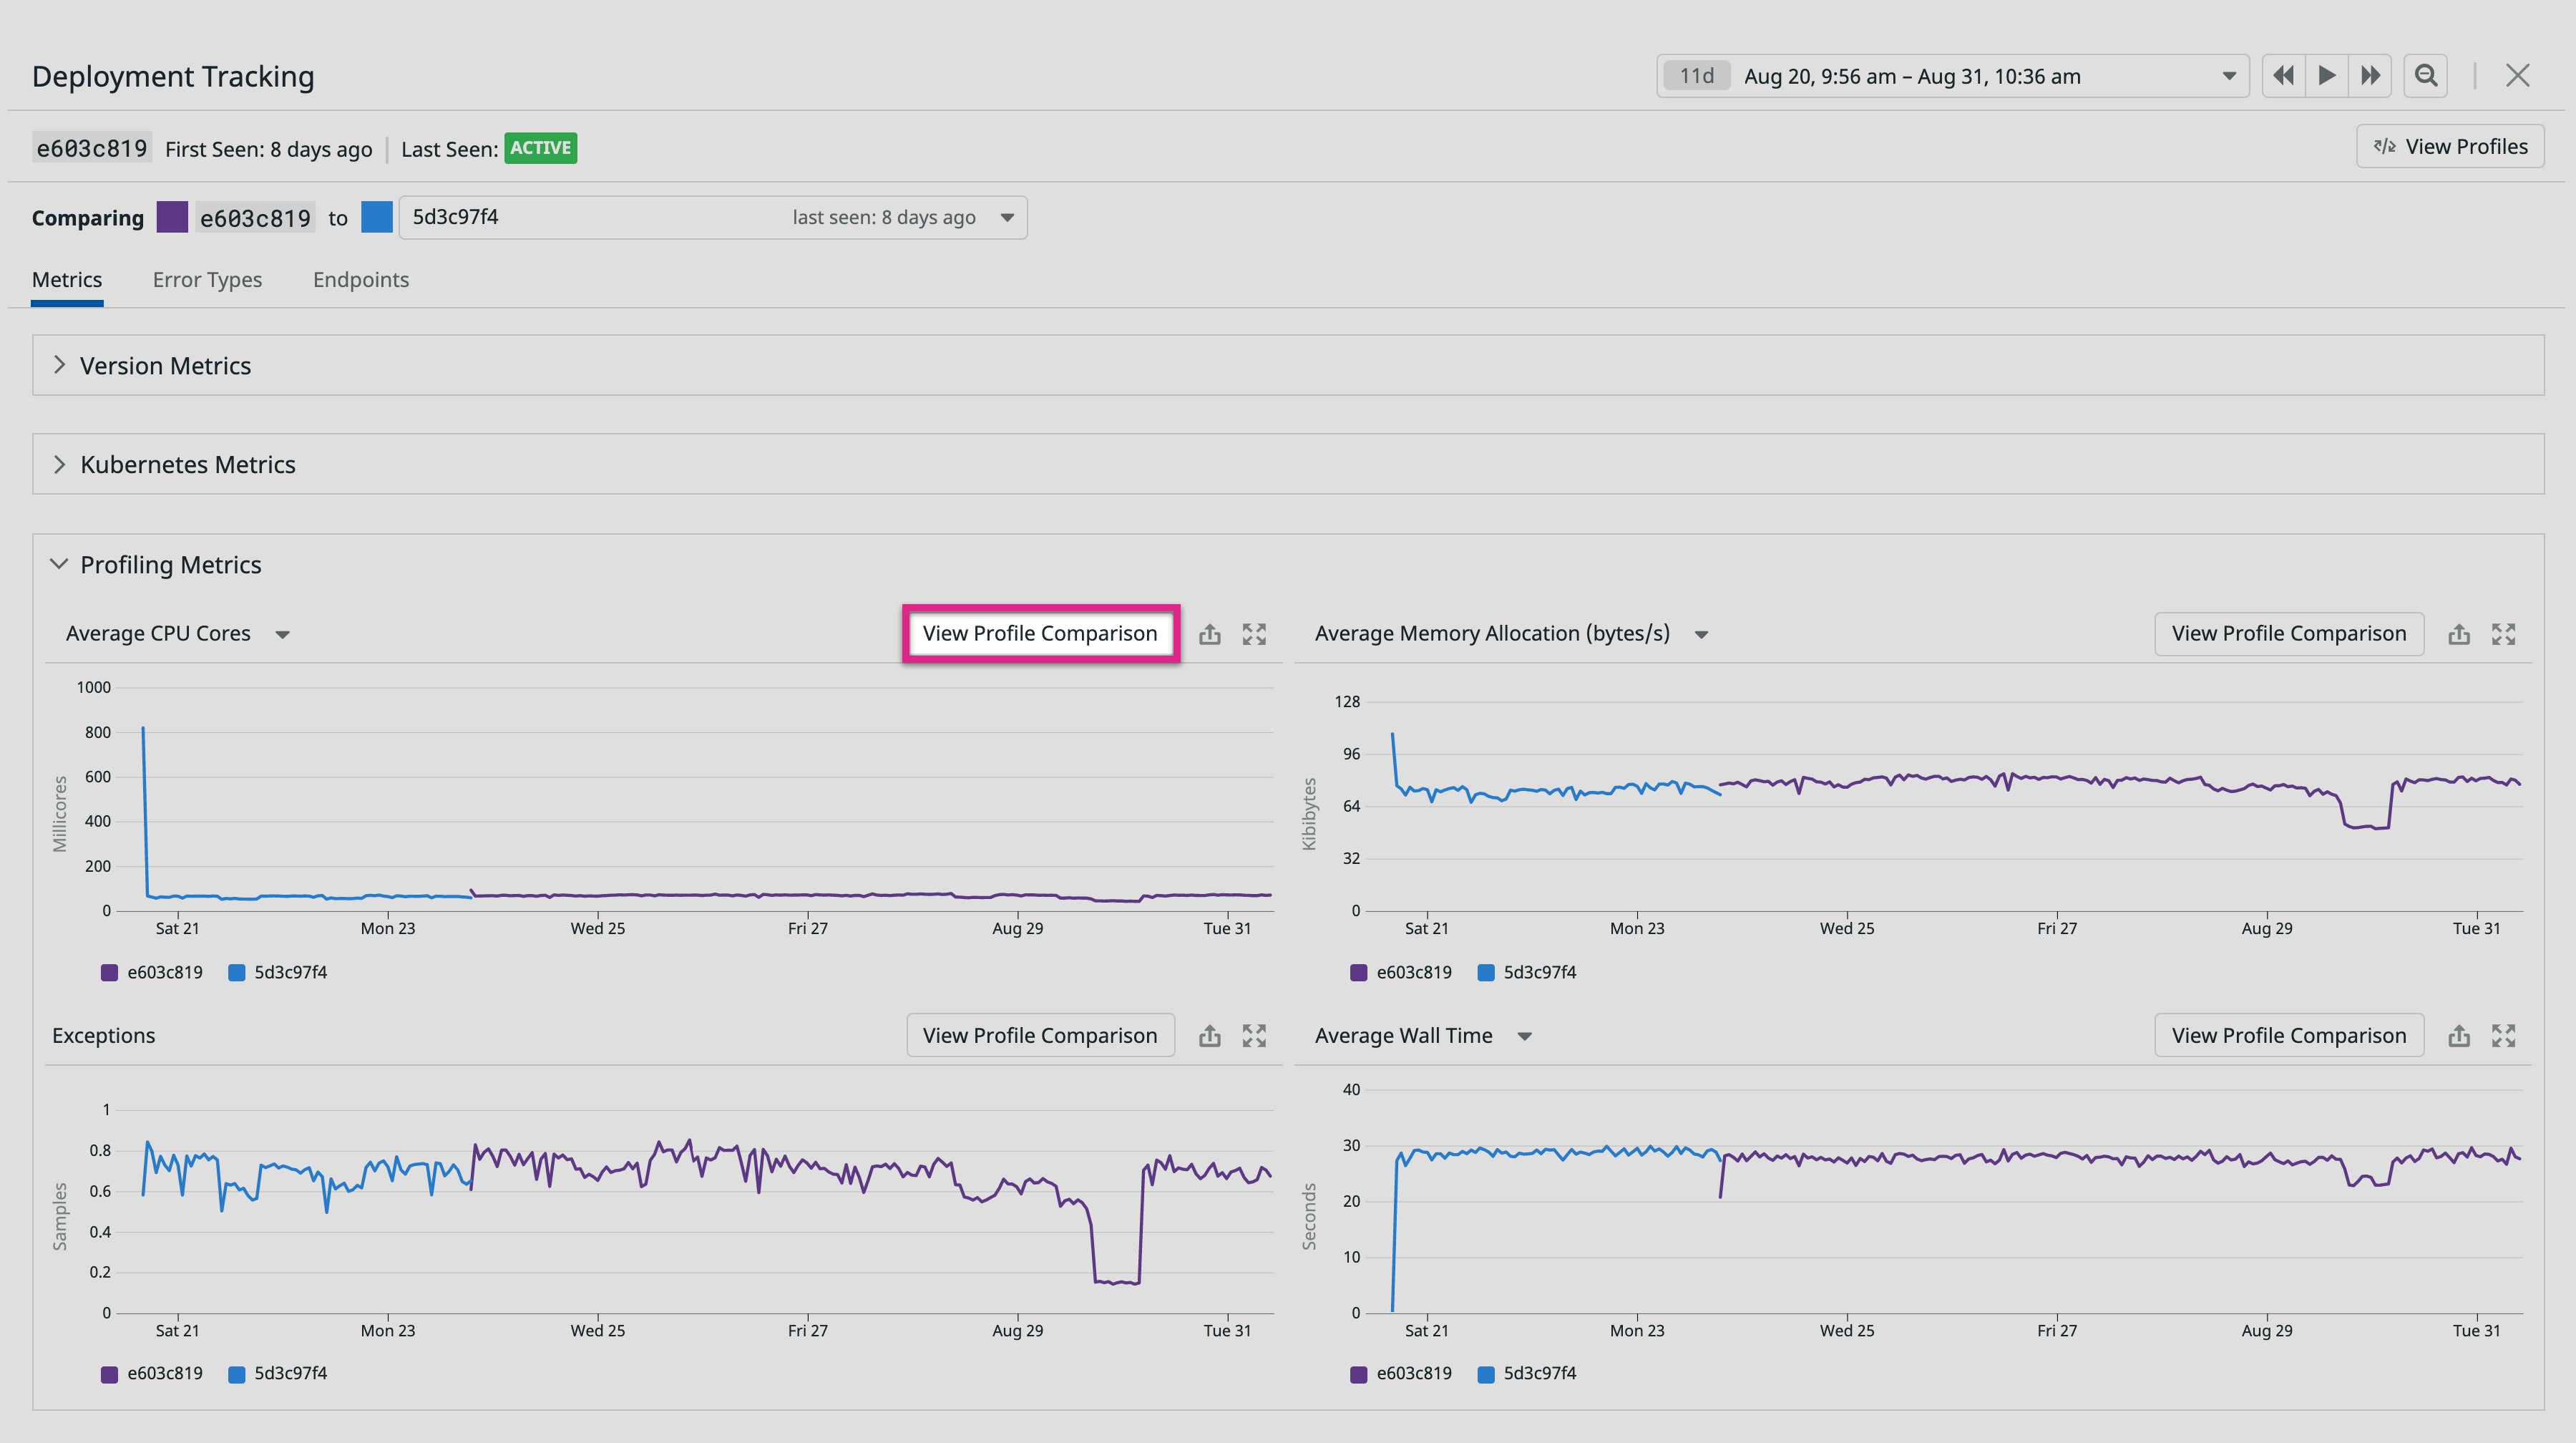
This enables you to compare code before and after you deploy changes to ensure they improve service performance. For example, the screenshot below compares the CPU time for a specific function (readinto) over two successive releases.
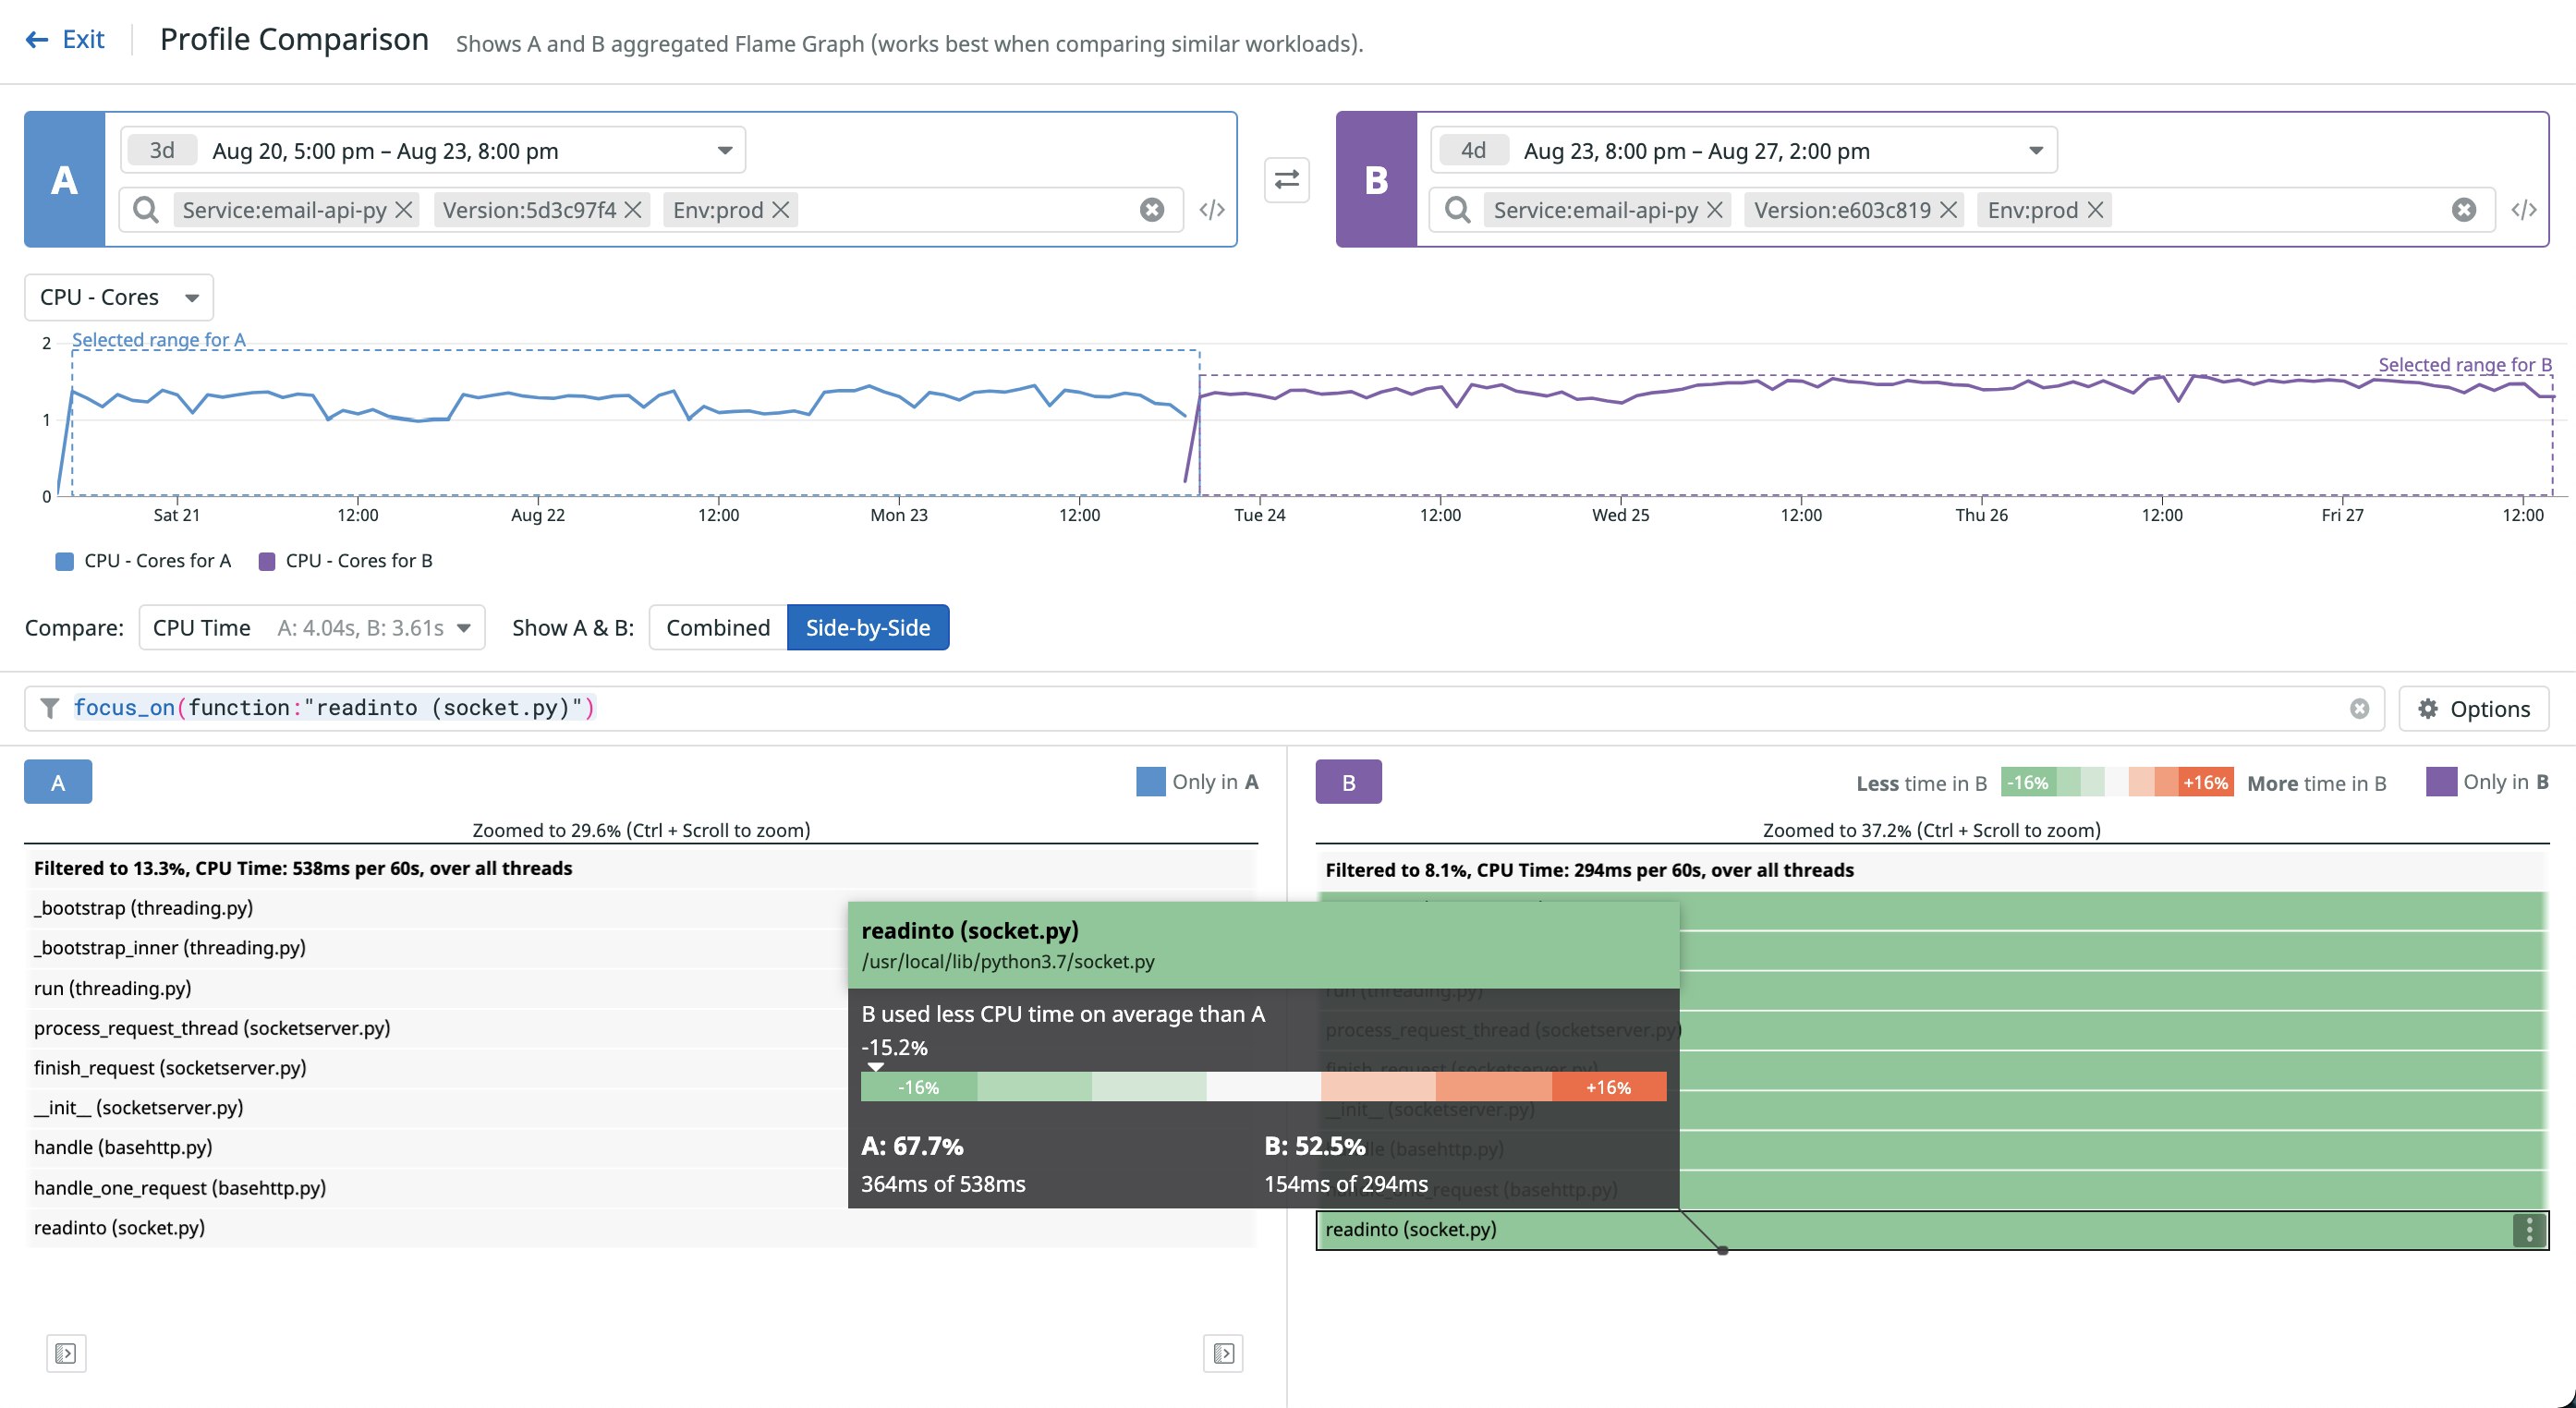
On the right, which represents the newer release, you can see that the function consumed 15 percent less CPU time than in the older version, meaning that the deployed optimizations improved performance as expected.
Better visibility into code performance
Datadog’s Continuous Profiler enables you to monitor code performance in your production environments in real time, so you can effectively diagnose performance issues, optimize costly lines of code, and deploy fixes to your customers faster. And with the ability to compare profile data side by side, you can better understand how changes to your application code improved or degraded performance over time. Check out our documentation to learn more about Datadog’s Continuous Profiler and the profile comparison view. If you don’t already have a Datadog account, you can sign up for a 14-day free trial today.
